The impact of baseline systolic blood pressure (SBP) on outcomes in patients with advanced chronic systolic heart failure (HF) has not been studied using a propensity-matched design. Of the 2,706 participants in the Beta-Blocker Evaluation of Survival Trial (BEST) with chronic HF, New York Heart Association class III to IV symptoms and left ventricular ejection fraction ≤35%, 1,751 had SBP ≤120 mm Hg (median 108, range 70 to 120) and 955 had SBP >120 mm Hg (median 134, range 121 to 192). Propensity scores for SBP >120 mm Hg, calculated for each patient, were used to assemble a matched cohort of 545 pairs of patients with SBPs ≤120 and >120 mm Hg who were balanced in 65 baseline characteristics. Matched Cox regression models were used to estimate associations between SBP ≤120 mm Hg and outcomes over 4 years of follow-up. Matched participants had a mean age ± SD of 62 ± 12 years, 24% were women, and 24% were African-American. HF hospitalization occurred in 38% and 32% of patients with SBPs ≤120 and >120 mm Hg, respectively (hazard ratio 1.33 SBP ≤120 was compared to >120 mm Hg, 95% confidence interval 1.04 to 1.69, p = 0.023). All-cause mortality occurred in 28% and 30% of matched patients with SBPs ≤120 and >120 mm Hg, respectively (hazard ratio 1.13 SBP ≤120 compared to >120 mm Hg, 95% confidence interval 0.86 to 1.49, p = 0.369). In conclusion, in patients with advanced chronic systolic HF, baseline SBP ≤120 mm Hg is associated with increased risk of HF hospitalization, but had no association with all-cause mortality.
Although hypertension is a risk factor for incident heart failure (HF), in patients with established HF, low systolic blood pressure (SBP) is associated with poor outcomes. The independent association between low SBP and poor outcomes in HF is based on studies that used traditional regression-based multivariable risk adjustment models. However, such models may be limited by strong yet inappropriate modeling assumptions and potential residual bias. Propensity score matching, in contrast, can be used to assemble a balanced cohort of patients in a blinded manner. Whether low SBP has an independent association with poor outcomes in patients with advanced chronic systolic HF has not been studied using propensity-matched design. Therefore, we examined the association between low SBP and long-term outcomes in a propensity-matched cohort of patients with advanced systolic HF.
Methods
The present analysis is based on a public-use copy of the Beta-Blocker Evaluation of Survival Trial (BEST) data obtained from the National Heart, Lung, and Blood Institute. The BEST was a multicenter randomized placebo-controlled clinical trial of bucindolol, a β blocker, in HF, the methods and results of which have been previously published. Briefly, 2,708 patients with advanced chronic systolic HF were enrolled from 90 different sites across the United States and Canada from May 1995 to December 1998. At baseline, patients had a mean duration of 49 months of HF and had a mean left ventricular ejection fraction (LVEF) of 23%. All patients had New York Heart Association (NYHA) class III to IV symptoms and >90% of all patients were receiving angiotensin-converting enzyme inhibitors, diuretics, and digitalis.
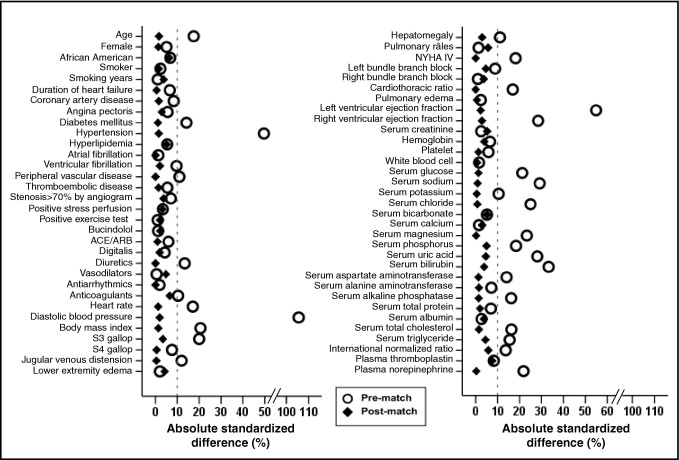
Of 2,708 BEST participants, 1 did not consent to be included in the public-use copy of the data. Of the 2,707, baseline SBP, as measured and documented by study investigators, was available in 2,706 participants, of which 1,751 patients (65%) had SBP ≤120 mm Hg (median 108, range 70 to 120) and 955 patients had SBP >120 mm Hg (median 134, range 121 to 192) at baseline. We chose an SBP of 120 mm Hg as our cutoff because it is often recommended as the target SBP in HF. Considering the significant imbalances in baseline characteristics between the 2 groups ( Table 1 ), we used propensity scores to assemble a matched cohort of 545 pairs of patients who were well balanced on 65 baseline characteristics. Propensity scores for SBP >120 mm Hg were estimated for each of the 2,706 patients using a nonparsimonious multivariable logistic regression model. Absolute standardized differences were estimated to evaluate the prematch imbalance and postmatch balance and presented as a Love plot. An absolute standardized difference of 0% indicates no residual bias and differences <10% are considered inconsequential.
| Variable | Before Propensity Matching | After Propensity Matching | ||||
|---|---|---|---|---|---|---|
| SBP >120 mm Hg (n = 955) | SBP ≤120 mm Hg (n = 1,751) | p Value | SBP >120 mm Hg (n = 545) | SBP ≤120 mm Hg (n = 545) | p Value | |
| Age (years) | 61.6 ± 11.5 | 59.5 ± 12.7 | <0.001 | 61.5 ± 11.9 | 61.5 ± 11.6 | 0.793 |
| Women | 222 (23%) | 370 (21%) | 0.203 | 133 (24%) | 130 (24%) | 0.886 |
| African-American | 239 (25%) | 388 (22%) | 0.091 | 140 (26%) | 125 (23%) | 0.321 |
| Body mass index (kg/m 2 ) | 37.7 ± 8.5 | 36.0 ± 8.3 | <0.001 | 37.0 ± 8.2 | 36.8 ± 8.6 | 0.822 |
| New York Heart Association class IV | 50 (5%) | 176 (10%) | <0.001 | 31 (6%) | 31 (6%) | 1.000 |
| Medical history | ||||||
| Heart failure duration (months) | 47 ± 49 | 51 ± 49 | 0.101 | 48 ± 51 | 50 ± 47 | 0.939 |
| Coronary artery disease ⁎ | 550 (58%) | 1,042 (60%) | 0.333 | 327 (60%) | 323 (59%) | 0.848 |
| Angina pectoris | 511 (54%) | 888 (51%) | 0.165 | 291 (53%) | 283 (52%) | 0.668 |
| >70% stenosis with wall motion abnormalities | 417 (44%) | 826 (47%) | 0.080 | 254 (47%) | 244 (45%) | 0.585 |
| Positive stress perfusion test result | 200 (21%) | 343 (20%) | 0.401 | 114 (21%) | 107 (20%) | 0.657 |
| Positive exercise test result | 74 (8%) | 131 (8%) | 0.802 | 43 (8%) | 40 (7%) | 0.820 |
| Coronary bypass | 257 (27%) | 524 (30%) | 0.098 | 156 (29%) | 150 (28%) | 0.730 |
| Percutaneous coronary intervention | 132 (14%) | 290 (17%) | 0.060 | 83 (15%) | 94 (17%) | 0.419 |
| Hypertension | 707 (74%) | 888 (51%) | <0.001 | 359 (66%) | 355 (65%) | 0.839 |
| Diabetes mellitus | 382 (40%) | 581 (33%) | <0.001 | 209 (38%) | 212 (39%) | 0.900 |
| Hyperlipidemia ⁎ | 429 (45%) | 740 (42%) | 0.182 | 254 (47%) | 240 (44%) | 0.437 |
| Chronic kidney disease | 351 (37%) | 655 (38%) | 0.737 | 197 (36%) | 213 (39%) | 0.368 |
| Atrial fibrillation | 234 (25%) | 419 (24%) | 0.739 | 138 (25%) | 138 (25%) | 1.000 |
| Ventricular fibrillation | 76 (8%) | 189 (11%) | 0.018 | 45 (8%) | 48 (9%) | 0.826 |
| Peripheral vascular disease | 181 (19%) | 260 (15%) | 0.006 | 91 (17%) | 91 (17%) | 1.000 |
| Medications | ||||||
| Bucindolol | 474 (50%) | 880 (50%) | 0.757 | 271 (50%) | 265 (49%) | 0.760 |
| Angiotensin-converting enzyme inhibitors/angiotensin receptor blockers | 913 (96%) | 1,694 (97%) | 0.130 | 521 (96%) | 522 (96%) | 1.000 |
| Digitalis | 873 (91%) | 1,621 (93%) | 0.282 | 498 (91%) | 495 (91%) | 0.824 |
| Diuretics | 869 (91%) | 1,654 (95%) | 0.001 | 507 (93%) | 505 (93%) | 0.908 |
| Vasodilators | 416 (44%) | 767 (44%) | 0.903 | 244 (45%) | 257 (47%) | 0.480 |
| Antiarrhythmic drugs | 28 (3%) | 46 (3%) | 0.642 | 16 (3%) | 16 (3%) | 1.000 |
| Anticoagulants | 522 (55%) | 1,047 (60%) | 0.010 | 289 (53%) | 307 (56%) | 0.278 |
| Physical examination | ||||||
| Pulse (beats/min) | 80 ± 13 | 82 ± 13 | <0.001 | 81 ± 13 | 81 ± 13 | 0.842 |
| Diastolic blood pressure (mm Hg) | 78 ± 11 | 67 ± 9 | <0.001 | 73 ± 9 | 73 ± 9 | 0.680 |
| Jugular venous distention | 399 (42%) | 836 (48%) | 0.003 | 228 (42%) | 227 (42%) | 1.000 |
| S 3 gallop | 355 (37%) | 823 (47%) | <0.001 | 210 (49%) | 219 (51%) | 0.622 |
| Pulmonary rales | 124 (13%) | 235 (13%) | 0.749 | 74 (14%) | 85 (16%) | 0.396 |
| Hepatomegaly | 90 (9%) | 226 (13%) | 0.007 | 55 (10%) | 60 (11%) | 0.694 |
| Lower extremity edema | 263 (28%) | 467 (27%) | 0.627 | 140 (26%) | 150 (28%) | 0.523 |
| Laboratory data | ||||||
| Serum creatinine (mg/dl) | 1.24 ± 0.41 | 1.25 ± 0.41 | 0.532 | 1.24 ± 0.40 | 1.26 ± 0.41 | 0.398 |
| Serum potassium (mEq/L) | 4.3 ± 0.5 | 4.3 ± 0.5 | 0.009 | 4.30 ± 0.5 | 4.30 ± 0.5 | 0.941 |
| Serum magnesium (mEq/L) | 1.7 ± 0.2 | 1.8 ± 0.3 | <0.001 | 1.7 ± 0.2 | 1.7 ± 0.2 | 0.906 |
| Serum glucose (mg/dl) | 145 ± 80 | 129 ± 71 | <0.001 | 139 ± 76 | 140 ± 79 | 0.835 |
| Serum uric acid (mg/dl) | 7.7 ± 2.2 | 8.3 ± 2.5 | <0.001 | 7.9 ± 2.2 | 8.0 ± 2.3 | 0.458 |
| Plasma norepinephrine (pg/ml) | 462 ± 257 | 546 ± 382 | <0.001 | 490 ± 273 | 492 ± 311 | 0.961 |
| Left bundle branch block | 216 (23%) | 463 (26%) | 0.028 | 129 (24%) | 140 (26%) | 0.489 |
| Cardiothoracic ratio | 54.9 ± 7.0 | 56.0 ± 7.2 | <0.001 | 55.2 ± 6.9 | 55.2 ± 7.2 | 1.000 |
| Left ventricular ejection fraction (%) | 25.5 ± 6.7 | 21.7 ± 7.2 | <0.001 | 24.3 ± 6.8 | 24.1 ± 6.8 | 0.695 |
| Right ventricular ejection fraction (%) | 36.8 ± 11.5 | 33.5 ± 11.7 | <0.001 | 36.0 ± 11.6 | 36.3 ± 11.4 | 0.618 |
⁎ Based on history provided by patients at time of enrollment.
BEST participants were followed for a minimum of 18 months and a maximum of 4.5 years. Primary outcomes for the present analysis were all-cause mortality and HF hospitalization during 4.1 years of follow-up (mean 2 years, range 2 days to 4.1 years). Secondary outcomes were cardiovascular and HF mortality and all-cause hospitalization. Kaplan-Meier and Cox regression analyses were used to determine associations between SBP ≤120 mm Hg and outcomes during 4.1 years of follow-up. Log-minus-log scale survival plots were used to check proportional hazards assumptions. Formal sensitivity analyses were conducted to quantify the degree of a hidden bias that would need to be present to invalidate our conclusions based on a significant association between SBP ≤120 mm Hg and primary outcomes in matched patients. Subgroup analyses were conducted to determine the homogeneity of association between SBP ≤120 mm Hg and all-cause mortality. All statistical tests were 2-tailed, with a p value <0.05 considered statistically significant. All data analyses were performed using SPSS 15 for Windows (SPSS, Inc., Chicago, Illinois).
Results
Matched patients had a mean age of 62 ± 12 years, with 24% women and 24% African-Americans. Prematch imbalances in baseline covariates and balances achieved after matching are presented in Figure 1 and Table 1 . After matching, standardized differences for all measured covariates were <10% (most were <5%), suggesting substantial covariate balance across groups ( Figure 1 ).