Native triglycerides (TG) deposited in the human vascular wall is not measurable or visible in vivo to date. We discovered that by exciting fluorescence at 345 nm and emitting at 420 nm, 3-amino-4-hydroxy-5-nitrobenzene sulfonic acid monohydrate (3-ANA) elicits a brown fluorescence that is characteristic of just TG. Therefore, localization of TG in coronary plaques and normal segments that were obtained from 19 human autopsy cases was examined by color fluorescent angioscopy (CFA) and microscopy using 3-ANA as a biomarker of TG. By CFA, the percentage (%) incidence of TG in 23 normal segments, 13 white plaques without lipid deposition, 18 white plaques (growth stage) with lipid deposition, 11 yellow plaques without necrotic core (mature stage), and 12 yellow plaques with necrotic core (advanced mature stage) was 95, 92, 50, 27, and 25, respectively. By color fluorescent microscopy, TG deposited mostly in the fibrotic area of the plaques. Contrary to the general belief that TG amount increases with plaque maturation, the results indicated that TG was deposited in most of the normal coronary segments, but the amount decreased with plaque maturation. If 3-ANA becomes applicable clinically, the CFA system could be used for imaging TG within coronary plaques in patients in vivo.
During our search for a biomarker for TG, we discovered that it exhibited a brown fluorescence in the presence of 3-amino-4-hydroxy-5-nitrobenzene sulfonic acid monohydrate (3-ANA) by excitation at 340 nm and emission at 420 nm. The present study using color fluorescent angioscopy (CFA) and color fluorescent microscopy (CFM) aimed to clarify whether the brown fluorescence excited by 3-ANA is specific for TG and, thus, show TG deposited in human coronary plaques in anticipation of clinical application.
Methods
TG singularly does not exhibit autofluorescence but when mixed with 3-ANA, brown fluorescence is evoked. Therefore, 3-ANA was used as an indicator of TG in this study. To clarify whether the fluorescent color of TG evoked by 3-ANA is characteristic, the color fluorescence of the major substances that constitute atherosclerotic plaques was examined by CFM. Chemically pure substances were used for this purpose. A CFM system with a band pass filter of 340 ± 15 nm and a band absorption filter of 420 nm was used for fluorescent imaging. The details of CFM are described elsewhere.
CFA system is consisted of a fluorescence-excitation unit, an angioscope (VecMover; Clinical Supply Co, Gifu, Japan), a fluorescence-emission unit, and a camera. The system enables observation of a coronary segment up to 7 cm in length by a single saline flush and has been approved for clinical use by the Japanese Ministry of Health and Labor, supported by National Insurance, on a commercial basis in Japan. The details of this CFA system are described elsewhere. The intensity of the fluorescence images was arbitrarily defined as strong, weak, and absent when the exposure time required for imaging was 1≥, 1< and 5≥, and 5s<, respectively.
The limitation of sensitivity of the CFA system was examined using the major substances comprising atherosclerotic plaques as the target. It was revealed that their fluorescence was not detectable by the CFA system when their concentration was ≤10 −6 M.
The conventional angioscopy system is consisted of a 4.5-F angioscope, light source, and a 3-coupled chilled device digital camera (Olympus). The details of the procedure are described elsewhere. Plaque by conventional angioscopy was defined as a nonmotile and protruding or lining mass clearly demarcated from the adjacent normal wall and whose shape, location, and color did not alter after saline solution flush. Plaques were further classified as white or yellow based on their surface color. A normal segment was defined as a milky white and smooth-surfaced portion of the vessel without any protrusion. Surface color of the plaques was measured by an AquaCosmos image analyzer (C7746; Hamamatsu Photonics, Hamamatsu, Japan).
This in vitro study was carried out with the approval of the Ethical Committees of Japan Foundation for Cardiovascular Research, Funabashi-Futawa Hospital and Toho University. After obtaining the written informed consent of the families concerned, 29 coronary arteries (17 left anterior descending arteries, 5 left circumflex arteries, and 7 right coronary arteries) were excised from 19 successive autopsy cases from April 1, 2008, to November 1, 2014 (age 61 ± 3 years, 7 women and 12 men): death from acute myocardial infarction (4), aortic dissection (2), diabetic nephropathy (5), cerebral infarction (2), pancreatic carcinoma (1), hepatocellular carcinoma (3), and gastric cancer (2). The remaining 28 arteries were difficult to excise or used for other purpose.
Coronary arteries were obtained from autopsy cases within 5 to 12 hours after death, and the following examinations were performed within 2 to 5 hours thereafter. A Y-connector was introduced into the proximal portion of the coronary artery being examined for perfusion with saline solution at a rate of 10 ml/min. Then, the angioscope, as described earlier, was introduced through the connector for observation of the artery. Initially, conventional angioscopy was carried out to detect plaque and because the light irradiated from the angioscope tip was visible through the coronary wall, the angioscope tip and, accordingly, the targeted plaque could be confirmed.
After observation by conventional angioscopy, the light guide and the image guide were connected to the fluorescence excitation and emission units, respectively. A band pass filter of 340 ± 15 nm and a band absorption filter of 420 nm were set, and a control image was obtained under perfusion of saline solution. After ceasing the perfusion, 0.5 ml of 2% 3-ANA solution was injected into the perfusion circuit, and 5 minutes later, saline solution perfusion was restarted and the target plaque was imaged again.
A total of 54 plaques were confirmed by conventional angioscopy and CFA in 29 arteries. The 4- to 5-mm-long portion of vessel in which the observed plaque was located was isolated by transecting its proximal and the distal ends at the shorter axes to avoid any damage to the plaque. Subsequently, the isolated segment was cut longitudinally to open the lumen. The 23 normal segments were similarly isolated. The 52 of the 54 isolated coronary segments that contained plaques and 22 of the 23 normal segments were mounted on a deck glass in such a way that the luminal surface of the plaque faced the deck glass. The surface was then scanned by CFM at ×10 or ×40 magnification using light wavelength filters in similar to those used for CFA. The remaining 2 plaques and 1 normal segment were not used because they were damaged during preparation.
In the 49 plaques and 22 normal segments used for observation of the luminal surface by CFM scanning, the center of the plaque was transected and half was again immersed in 3-ANA solution for 5 minutes because the 3-ANA injected into the perfusion circuit might not have penetrate into the entire wall. Next, it was mounted on a deck glass in such a way that the transected surface faces the deck glass, and the transected surface was scanned by CFM to examine localization of TG. Three plaques were destroyed because of calcium deposition and were not used for scanning. Furthermore, the relations between the deposition site of TG and plaque color determined by conventional angioscopy and the presence or absence of a necrotic core (NC) were examined.
After CFM scanning, the raw sample, which was cut into slices of 30 to 40 μm thickness at the shorter axis, had lipids stained red, calcium as black, collagen fibers and smooth muscles as blue with Oil Red O, and methylene blue dyes for histologic study.
The data obtained were tested by the Fisher’s exact test. A value of p <0.05 was considered to be statistically significant.
Results
TG did not autofluoresce, but it presented a brown fluorescence in the presence of 3-ANA. This fluorescent color was not exhibited by any of the other major known substances that comprise atherosclerotic plaques, indicating that this fluorescent color was characteristic of just TG.
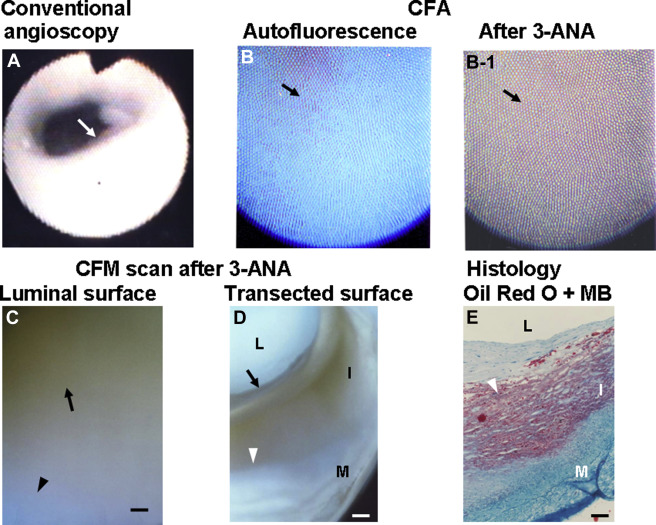
Figure 1 shows a white plaque by conventional angioscopy. It exhibited blue autofluorescence, indicating the presence of abundant collagen I. After the administration of 3-ANA, the plaque exhibited diffuse brown fluorescence, indicating diffuse deposition of TG. Diffuse brown fluorescence was also observed by luminal surface scanning of the same plaque. On transected surface scanning of the same plaque, brown fluorescence occupied the inner layer (luminal side) of the plaque but not the outer layer (medial side) of the plaque where lipids deposited according to histologic examination.

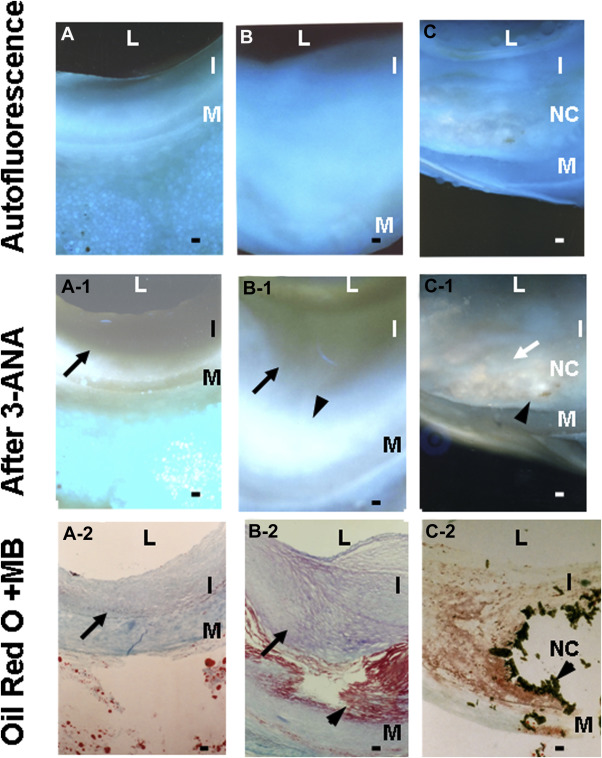
In the angioscopically normal coronary segments, TG was diffusely deposited in the fibrotic intima in the majority of specimens examined, irrespective of underlying disease or cause of death ( Figure 2 , Tables 1 and 2 ), and also frequently in the media ( Figure 2 ). In white plaques without lipid deposition, TG was deposited in the fibrotic intima ( Tables 1 and 2 ), whereas in white plaques with lipid deposition in outer layer (medial side), TG was deposited mostly in the fibrotic area but infrequently in the lipid deposition area ( Figures 1 and 2 , Table 2 ). In yellow plaques with or without NC, TG deposition was less frequently observed by CFA and CFM ( Tables 1 and 2 ). In a small number of yellow plaques with NC, TG deposits were observed within the NC ( Figure 2 , Table 2 ). As a consequence, the incidence of TG deposition studied by CFA was greatest in the normal segments and showed a tendency to decrease in the order of white plaques without lipid deposition, white plaques with lipid deposition, and yellow plaques without NC. The incidence of TG in yellow plaques with NC that was examined by CFA and CFM luminal surface scan was significantly smaller than that of normal segments ( Table 1 ).

| Plaque morphology | Normal segments | White plaques | Yellow plaques | ||
|---|---|---|---|---|---|
| Lipid(-) | Lipid (+) | NC(-) | NC(+) | ||
| (A) Color fluorescent angioscopy | |||||
| n | 23 | 13 | 16 | 11 | 12 |
| TG present | 22(95%) | 12(92%) | 9(56%) | 3(27%) | 3(25%) ∗ |
| (B)Color fluorescent microscopy | |||||
| (a)Luminal surface scan | |||||
| n | 22 | 13 | 17 | 11 | 11 |
| TG present | 20 (91%) | 10(77%) | 8(47%) | 3(27%) | 2(18%) † |
| (C) Transected surface scan | |||||
| n | 22 | 12 | 16 | 10 | 11 |
| TG present | 22(100%) | 11(97%) | 10(62%) | 5(50%) | 4(36%) |
Stay updated, free articles. Join our Telegram channel

Full access? Get Clinical Tree


