Optical coherence tomography (OCT) has been considered as the ideal tool for the evaluation of atherosclerotic plaques. Circulating trimethylamine-N-oxide (TMAO), which is a metabolite of the dietary lipid phosphatidylcholine, has recently been linked to elevated coronary artery disease (CAD) risk. The objective of the study was to investigate the relation between circulating TMAO level and coronary plaque vulnerability assessed by OCT in patients with CAD. A total of 26 patients with CAD were recruited to assess coronary plaque using OCT and measure plasma TMAO level. According to plaque rupture status, patients were divided into plaque rupture group (n = 12) and nonplaque rupture group (n = 14). Plasma TMAO level was significantly higher in patients with plaque rupture than in those with nonplaque rupture (8.6 ± 4.8 μmol/L vs 4.2 ± 2.4 μmol/L, p = 0.011). Moreover, positive correlations between plasma TMAO level and lipid arc ( r = 0.43, p = 0.031), lipid volume index ( r = 0.39, p = 0.048) were also observed. In conclusion, circulating TMAO level may reflect coronary plaque vulnerability and progression.
It is generally known that the disruption of coronary vulnerable plaques with subsequent thrombus formation is the main pathogenesis of acute coronary events. Optical coherence tomography (OCT) enables to characterize accurately atherosclerotic plaques and has potential to detect plaque rupture due to high-resolution (10 to 20 μm) cross-sectional images of tissue with near infrared light. Recently, several studies showed that plasma trimethylamine-N-oxide (TMAO), a metabolite of the dietary lipid phosphatidylcholine through the action of gut flora, was strongly linked to atherosclerosis and elevated coronary artery disease (CAD) risk, and predicted future risk for major adverse cardiac events including myocardial infarction, stroke, and death. The aim of the present study was to investigate the association between coronary plaque characteristics assessed by OCT and circulating TMAO level in patients with CAD.
Methods
We enrolled patients with diagnosis of CAD admitted for elective coronary diagnostic or interventional procedures and underwent OCT before percutaneous coronary intervention from April 2014 to December 2014. Patients were excluded if they had unstable hemodynamic status such as cardiogenic shock and congestive heart failure or had culprit lesion in the left main trunk and ostium lesion. In addition, patients with extremely tortuous vessels or with severe calcification were excluded due to difficulty in advancing the OCT catheter. The study was approved by the Ethics Committee of Beijing TianTan hospital and all patients provided written informed consent.
Blood samples for TMAO assays were drawn into vacutainer tubes containing EDTA (ethylene diamine tetraacetic acid) from a radial artery approach before coronary angiography. The measurement of TMAO with stable isotope LC/MS (liquid chromatography/mass spectrometry) was performed according to Wang et al’ method. Briefly, plasma sample (20 μl) was mixed with 80 ul of 10 uM internal standard composed of d9-TMAO in methanol. Protein was precipitated and the supernatant was recovered after centrifugation at 20,000 g at 4°C for 10 minutes. Standard curves coefficient of determination (R2) reached 0.999 and accuracy across a span of different concentrations all reached 95% ( Supplementary Figure 1 and Supplementary Table 1 ). Supernatants (70 μl) were analyzed with an API 5500Q-TRAP mass spectrometer (AB SCIEX, Framingham, Massachusetts). Analytes were monitored using electrospray ionization in positive ion mode with multiple reaction monitoring of precursor and characteristic product-ion transitions of TMAO at m/z 76→58, d9-TMAO at m/z 85→66, respectively.
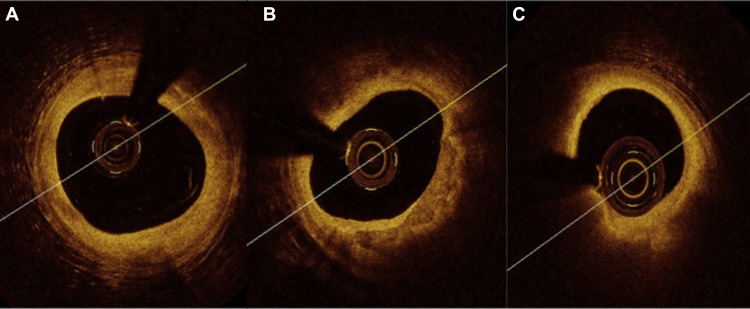
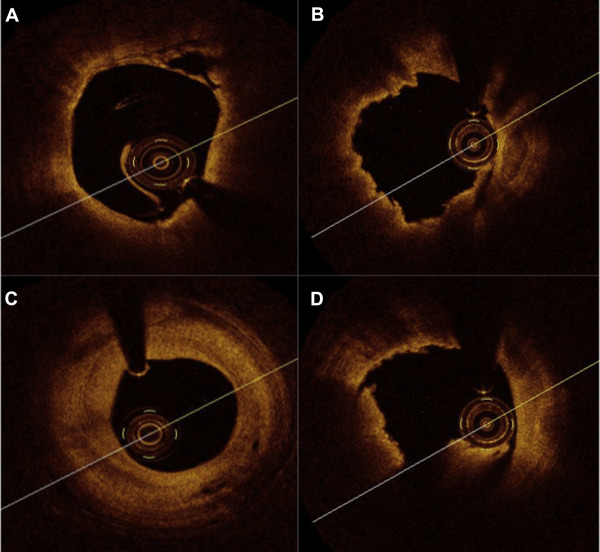
OCT procedure was performed using the frequency-domain C7-XR OCT intravascular imaging system (LightLab Imaging Inc., St Jude Medical, St. Paul, Minnesota) after coronary angiography. OCT plaque characterizations were evaluated at the site of the minimal lumen area and along the culprit segment. The OCT images of atherosclerotic plaques were categorized into 3 types based on validated criteria for plaque characterization : fibrous coronary plaque ( Figure 1 ), fibrocalcific plaque ( Figure 1 ), and lipid plaque ( Figure 1 ). The length of lipid pool was defined as consecutive longitudinal length of lipid pool at culprit plaque. The lipid arc was measured with a protractor centered in the center of lumen. Lipid volume index was defined as averaged lipid arc multiplied by the length of lipid pool. Thin-cap fibroatheroma (TCFA) was defined as a plaque with lipid content in ≥2 quadrants and thinnest part of a fibrous cap measuring ≤65 μm ( Figure 2 ). In addition, plaque rupture ( Figure 2 ), plaque erosion ( Figure 2 ), vasa vasorum ( Figure 2 ) and intracoronary thrombus ( Figure 2 ) were also identified in the present study. According to plaque rupture and TCFA status, the patients were grouped and compared plasma TMAO levels. All OCT images were analyzed by an independent investigator who was blinded to the angiographic data and clinical presentations.
Continuous values following a normal distribution were expressed as means ± SD. Categorical variables were expressed as frequencies and percentages. Differences between the 2 groups were determined using the Student t test or Mann–Whitney U test as appropriate for continuous variables. The chi-square test or Fisher’s exact test was used as appropriate to compare categorical variables. Spearman’s correlation was applied to denote the association between OCT parameters and plasma TMAO level. Differences were considered statistically significant at p <0.05. Statistical analyses were performed using SPSS 20.0 software (IBM Corporation, Armonk, New York).
Results
A total of 26 patients were included in the study. Patient clinical characteristics are summarized in Table 1 . The OCT findings are presented in Table 2 . On the basis of plaque rupture status, patients were divided into a plaque rupture group (n = 12) and a nonplaque rupture group (n = 14). Plasma TMAO levels were significantly higher in patients with plaque rupture than those with nonplaque rupture (8.6 ± 4.8 μmol/L vs 4.2 ± 2.4 μmol/L, p = 0.011; Figure 3 ). In addition, according to TCFA lesion, patients were divided into a TCFA group (n = 16) and a non-TCFA group (n = 10). There was a trend toward greater plasma TMAO level in TCFA group compared with non-TCFA group (7.3 ± 4.8 μmol/L vs 4.5 ± 2.7 μmol/L, p = 0.094; Figure 4 ). Furthermore, positive correlations between plasma TMAO level and lipid arc ( r = 0.43, p = 0.031; Figure 5 ), lipid volume index (r = 0.39, p = 0.048; Figure 6 ) were also observed, but lipid pool length, lipid quadrant, and fibrous cap thickness did not correlate with plasma TMAO level.
| Variable | |
|---|---|
| Age (years) (mean±SD) | 60±10 |
| Male sex | 20 (77%) |
| Dyslipidemia | 23 (88%) |
| Diabetes mellitus | 9 (35%) |
| Hypertension | 14 (54%) |
| Smoking | 12 (46%) |
| Clinical presentation | |
| Stable AP | 13 (50%) |
| Non-ST elevation ACS | 8 (31%) |
| ST elevation MI | 5 (19%) |
| Variable | |
|---|---|
| Qualitative OCT analysis | |
| Fibrous plaque | 6 (23%) |
| Calcified plaque | 4 (15%) |
| Lipid-rich plaque | 16 (62%) |
| Plaque rupture | 12 (46%) |
| Plaque erosion | 10 (38%) |
| Intracoronary thrombus | 3 (12%) |
| Macrophages infiltration | 3 (12%) |
| TCFA | 16 (62%) |
| Quantitative OCT analysis | |
| Lipid pool length | 10.30±3.54 |
| Lipid arc (°) | 229.04±39.04 |
| Lipid volume index | 2378.83±952.02 |
| Lipid quadrant | 3.38±4.23 |
| Fibrous cap thickness (μm) | 68.81±33.84 |
| Minimum lumen area (mm 2 ) | 1.51±0.66 |
Stay updated, free articles. Join our Telegram channel

Full access? Get Clinical Tree


