Single ventricle congenital heart disease (SV CHD) has transformed from a nearly universally fatal condition to a chronic illness. As the number of adults living with SV CHD continues to increase, there needs to be an understanding of health care resource utilization (HCRU), particularly for noncardiac conditions, for this patient population. We performed a retrospective database review of the University HealthSystem Consortium Clinical Database/Resource Manager for adult patients with SV CHD hospitalized for noncardiac conditions from January 2011 to November 2014. Patients with SV CHD were identified using International Classification of Disease (ICD)-9 codes associated with SV CHD (hypoplastic left heart, tricuspid atresia, and SV) and stratified into 2 groups by age (18 to 29 years and 30 to 40 years). Direct cost, length of stay (LOS), intensive care unit (ICU) admission rate and mortality data were compared with age-matched patients without CHD. There were 2,083,651 non-CHD and 590 SV CHD admissions in Group 1 and 2,131,046 non-CHD and 297 SV CHD admissions in Group 2. There was no difference in LOS in Group 1, but there were higher costs for several diagnoses. LOS and costs were higher for several diagnoses in Group 2. ICU admission rate and in-hospital mortality were higher for several diagnoses for patients with SV CHD in both groups. In conclusion, adults with SV CHD admitted for noncardiac diagnoses have higher HCRU (longer LOS and higher ICU admission rates) compared with similarly aged patients without CHD. These findings stress the importance of good primary care in this population with complex, chronic cardiac disease to prevent hospitalizations and higher HCRU.
The natural history of congenital heart disease (CHD) is evolving from a condition with high infant mortality to a chronic adulthood condition. As CHD treatment and management continue to improve, the number of adults with CHD now surpasses children with CHD. This increasing adult CHD population raises concerns regarding health care resource utilization (HCRU). Previous studies have shown increasing HCRU in the adult CHD population. Between 1998 and 2005, hospital admissions for adults with CHD more than doubled in the United States. Adults with CHD have hospital admission rates 2 to 3 times higher than the general population, with up to 2/3 of these admissions for cardiovascular conditions not directly due to their underlying CHD. Although there is evidence that adults with single ventricle (SV) CHD use extensive resources during cardiac admissions, there are no data regarding HCRU during hospital admissions for common noncardiac disorders in this population. Given the complexity and relative rarity of CHD, large administrative databases have been used to aggregate cases from multiple institutions to amass enough cases to determine outcomes and provide cost data for children and adults with CHD. The goal of our study was to compare HCRU of adults with SV CHD and adults without any CHD who were hospitalized for noncardiac diagnoses in the United States.
Methods
Data were obtained through retrospective review of hospital discharges from the University HealthSystem Consortium Clinical Database/Resource Manager after approval from the University of Arizona Institutional Review Board. The administrative University HealthSystem Consortium Clinical Database/Resource Manager database collects discharge data from 120 academic medical centers and 308 affiliated community hospitals across the United States; several large free-standing children’s hospitals are not represented in the database. The study cohort included all admissions from January 2011 to November 2014 for subjects aged 18 to 40 years, stratified into 2 groups: age 18 to 29 years (group 1) and 30 to 40 years (group 2). Admissions including the ICD-9 procedure code for cardiopulmonary bypass (39.61) were excluded to eliminate costs related to cardiac surgery and associated complications and more effectively restrict entries to noncardiac diagnosis admissions. In addition, the data set was manually reviewed to ensure that there were no admissions associated with surgical or catheter interventional procedures. SV CHD cases were identified through ICD-9 codes for SV lesions: hypoplastic left heart syndrome (746.7), tricuspid atresia (746.1), or common ventricle (745.3). Non-CHD cases were identified by excluding patients with ICD-9 codes for any form of CHD.
Diagnosis, direct cost, length of stay (LOS), intensive care unit (ICU) admission rate and in-hospital mortality data were obtained. Data for the 10 most common noncardiac admission diagnoses in non-CHD patients for each age group were compared between patients with SV CHD and non-CHD patients using independent t -tests and chi-square or Fisher’s exact test, as appropriate, using IBM SPSS Statistics v21.0 (IBM Corporation, Armonk, New York). We chose to analyze the 2 groups separately because of the difference in admitting diagnoses with insufficient overlap.
Noncardiac diagnoses and their ICD-9 codes included: acute kidney injury (AKI; 584.9), asthma (493.90), chronic kidney disease (CKD; 585.9), nonalcoholic liver cirrhosis (571.5), depressive disorder (311), esophageal reflux (530.81), hypothyroidism (244.9), migraine headache (346.90), obesity (278.00), obstructive sleep apnea (OSA; 327.23), pneumonia (486), and urinary tract infection (UTI; 599.0).
To maximize the data capture, the search was not exclusive to primary admission diagnosis, as patients could have SV CHD anywhere in their diagnosis list, not necessarily as their primary or secondary diagnosis.
Results
There were 2,083,651 non-CHD and 590 SV CHD admissions in group 1 and 2,131,046 non-CHD and 297 SV CHD admissions in group 2. Table 1 lists the demographics for both groups. There was no difference in age between non-CHD and SV CHD admissions in group 1; in group 2, the patients with SV CHD were slightly younger. Patients with SV CHD showed a male predominance and a higher prevalence of whites in both groups.
| Group 1 (18 – 29 years) | Group 2 (30 – 40 years) | |||||
|---|---|---|---|---|---|---|
| Non-CHD (n = 2,083,651) | SV CHD (n = 590) | p | Non-CHD (n = 2,131,046) | SV CHD (n = 297) | p | |
| Age [years; mean (SD)] | 21.1 (7.68) | 21.5 (6.32) | 0.206 | 34.7 (3.15) | 34.1 (3.21) | 0.001 |
| Female | 1,466,104 (70.4%) | 259 (43.9%) | < 0.001 | 1,468,726 (68.9%) | 156 (52.5%) | < 0.001 |
| Race/ethnicity | ||||||
| White | 1,070,460 (51.4%) | 436 (73.9%) | < 0.001 | 1,209,334 (56.7%) | 219 (73.7%) | < 0.001 |
| Black | 552,776 (26.5%) | 80 (13.6%) | < 0.001 | 458,007 (21.5%) | 24 (8.1%) | < 0.001 |
| Hispanic | 281,120 (13.5%) | 34 (5.8%) | < 0.001 | 238,462 (11.2%) | 24 (8.1%) | 0.089 |
| Asian | 52,569 (2.5%) | 16 (2.7%) | 0.769 | 83,340 (3.9%) | 11 (3.7%) | 0.854 |
Figures 1 and 2 show the mean LOS and hospital costs for groups 1 and 2, respectively. There was no difference in LOS for any diagnosis in group 1, but higher hospital costs for asthma, hypothyroidism, OSA, and UTI ( Figure 1 ). In group 2, LOS was longer for patients with SV CHD having CKD, cirrhosis, depressive disorder, reflux, hypothyroidism, migraine, and OSA ( Figure 2 ). Hospital costs were higher for patients with SV CHD having depressive disorder, hypothyroidism, migraine, and OSA ( Figure 2 ). There were no diagnoses for which non-CHD patients had longer LOS or higher hospital costs for either group.
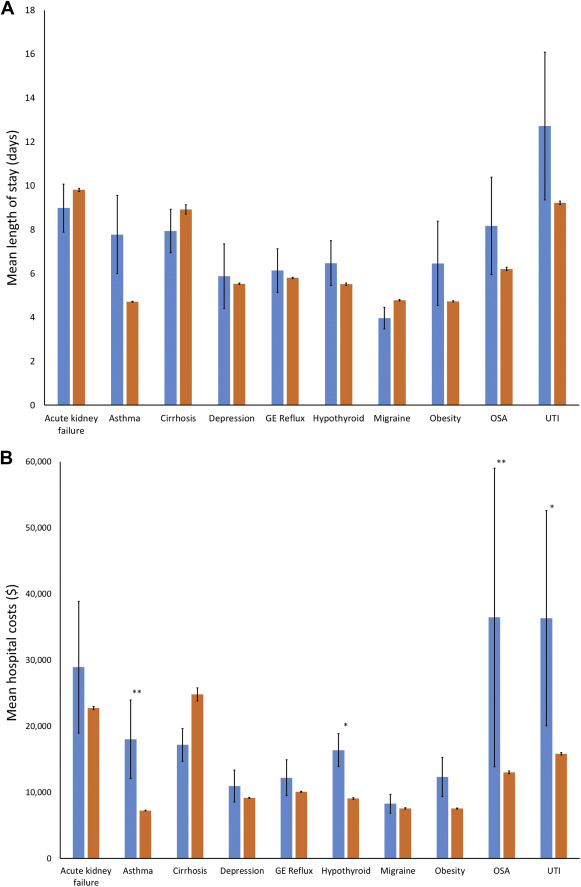
Table 2 lists the number and proportion of admissions for each diagnosis and ICU admission and in-hospital mortality rates for group 1. AKI, reflux, hypothyroidism, cirrhosis, migraine, and OSA all accounted for larger proportions of admission diagnoses for SV CHD than non-CHD patients ( Table 2 ). The ICU admission rate was higher in patients with SV CHD for all diagnoses except cirrhosis and OSA. In-hospital mortality was higher in patients with SV CHD having asthma, depressive disorder, reflux, hypothyroidism, and UTI ( Table 2 ).
| Group 1 (18 – 29 years) | |||
|---|---|---|---|
| Non-CHD (n = 2,083,651) | SV CHD (n = 590) | p | |
| Acute kidney injury | |||
| Admissions | 50,124 (2.4%) | 56 (9.5%) | < 0.001 |
| ICU admit rate | 37.05% | 58.93% | < 0.001 |
| Mortality | 4.80% | 8.93% | 0.258 |
| Asthma | |||
| Admissions | 175,727 (8.4%) | 44 (7.5%) | 0.394 |
| ICU admit rate | 9.68% | 38.64% | < 0.001 |
| Mortality | 0.32% | 4.55% | < 0.001 |
| Depressive disorder | |||
| Admissions | 133,652 (6.4%) | 48 (8.1%) | 0.088 |
| ICU admit rate | 12.77% | 38.30% | < 0.001 |
| Mortality | 0.58% | 4.17% | 0.020 |
| Esophageal reflux | |||
| Admissions | 107,931 (5.2%) | 61 (10.3%) | < 0.001 |
| ICU admit rate | 11.59% | 42.62% | < 0.001 |
| Mortality | 0.50% | 3.28% | 0.002 |
| Hypothyroidism | |||
| Admissions | 44,881 (2.2%) | 55 (9.3%) | < 0.001 |
| ICU admit rate | 12.54% | 52.73% | < 0.001 |
| Mortality | 0.65% | 9.09% | < 0.001 |
| Liver cirrhosis | |||
| Admissions | 5,057 (0.2%) | 93 (15.8%) | < 0.001 |
| ICU admit rate | 24.62% | 32.61% | 0.091 |
| Mortality | 4.03% | 5.38% | 0.515 |
| Migraine | |||
| Admissions | 46,338 (2.2%) | 31 (5.3%) | < 0.001 |
| ICU admit rate | 10.18% | 25.81% | 0.010 |
| Mortality | 0.23% | 0.00% | 0.104 |
| Obesity | |||
| Admissions | 101,482 (4.9%) | 24 (4.1%) | 0.365 |
| ICU admit rate | 8.40% | 36.36% | < 0.001 |
| Mortality | 0.31% | 0.00% | 0.120 |
| Obstructive sleep apnea | |||
| Admissions | 17,844 (0.9%) | 24 (4.1%) | < 0.001 |
| ICU admit rate | 22.97% | 25.00% | 0.813 |
| Mortality | 1.10% | 4.17% | 0.648 |
| Urinary tract infection | |||
| Admissions | 68,055 (3.3%) | 25 (4.2%) | 0.184 |
| ICU admit rate | 18.79% | 52.00% | < 0.001 |
| Mortality | 1.04% | 12.00% | < 0.001 |
Table 3 lists the number and proportion of all admissions for each diagnosis and ICU admission and in-hospital mortality rates for group 2. AKI, CKD, depressive disorder, hypothyroidism, cirrhosis, migraine, OSA, and pneumonia all accounted for a larger proportion of admission diagnoses for patients with SV CHD than for non-CHD patients ( Table 3 ). The ICU admission rate was higher in SV CHD patients with all diagnoses except AKI, CKD, and cirrhosis. Hospital mortality was higher in SV CHD patients with reflux, hypothyroidism, and migraine ( Table 3 ).
| Group 2 (30 – 40 years) | |||
|---|---|---|---|
| Non-CHD (n = 2,131,046) | SV CHD (n = 297) | p | |
| Acute kidney injury | |||
| Admissions | 80,591 (3.8%) | 42 (14.1%) | < 0.001 |
| ICU admit rate | 33.74% | 45.24% | 0.115 |
| Mortality | 5.20% | 11.90% | 0.108 |
| Asthma | |||
| Admissions | 156,998 (7.4%) | 21 (7.1%) | 0.845 |
| ICU admit rate | 10.73% | 33.33% | 0.003 |
| Mortality | 0.51% | 4.76% | 0.226 |
| Chronic kidney disease | |||
| Admissions | 22,247 (1.0%) | 23 (7.7%) | < 0.001 |
| ICU admit rate | 23.99% | 39.13% | 0.089 |
| Mortality | 2.88% | 8.7% | 0.297 |
| Depressive disorder | |||
| Admissions | 174,857 (8.2%) | 49 (16.5%) | < 0.001 |
| ICU admit rate | 13.80% | 48.98% | < 0.001 |
| Mortality | 0.78% | 4.08% | 0.070 |
| Esophageal reflux | |||
| Admissions | 188,028 (8.8%) | 24 (8.1%) | 0.727 |
| ICU admit rate | 12.60% | 45.83% | < 0.001 |
| Mortality | 0.59% | 8.33% | < 0.001 |
| Hypothyroidism | |||
| Admissions | 101,812 (4.8%) | 55 (18.5%) | < 0.001 |
| ICU admit rate | 11.39% | 34.55% | < 0.001 |
| Mortality | 0.68% | 5.45% | < 0.001 |
| Liver cirrhosis | |||
| Admissions | 9,106 (0.4%) | 55 (18.5%) | < 0.001 |
| ICU admit rate | 25.57% | 34.55% | 0.128 |
| Mortality | 4.91% | 3.64% | 0.903 |
| Migraine | |||
| Admissions | 63,221 (3.0%) | 21 (7.1%) | < 0.001 |
| ICU admit rate | 11.17% | 47.62% | < 0.001 |
| Mortality | 0.34% | 9.52% | < 0.001 |
| Obstructive sleep apnea | |||
| Admissions | 58,522 (2.7%) | 26 (8.8%) | < 0.001 |
| ICU admit rate | 21.52% | 46.15% | 0.002 |
| Mortality | 1.06% | 0.00% | 0.667 |
| Pneumonia | |||
| Admissions | 42,686 (2.0%) | 20 (6.7%) | < 0.001 |
| ICU admit rate | 31.97% | 52.63% | 0.027 |
| Mortality | 5.13% | 5.00% | 0.631 |
Stay updated, free articles. Join our Telegram channel

Full access? Get Clinical Tree


