Chapter 13 Hemodynamics for the Vascular Surgeon
Basic Principles of Arterial Hemodynamics
Fluid Pressure
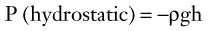 [1]
[1]where ρ is the specific gravity of blood (approximately 1.056 g/cm3), g is the acceleration due to gravity (980 cm/s2), and h is the distance in centimeters above or below the right atrium. The magnitude of hydrostatic pressure may be large. In a man 5 feet 8 inches tall, this pressure at ankle level is approximately 89 mm Hg.1
Fluid Energy
Blood flows through the arterial system in response to differences in total fluid energy. Although pressure gradients are the most obvious forces involved, other forms of energy drive the circulation.2 Total fluid energy (E) can be divided into potential energy (Ep) and kinetic energy (Ek). The components of potential energy are intravascular pressure (P) and gravitational potential energy.
The factors contributing to intravascular pressure have already been mentioned. Gravitational potential energy represents the ability of a volume of blood to do work because of its height above a specific reference level. The formula for gravitational potential energy is the same as that for hydrostatic pressure (see Equation 1) but with an opposite sign: +ρgh. Because the gravitational potential energy and hydrostatic pressure usually cancel each other out and the static filling pressure is relatively low, the predominant component of potential energy is the dynamic pressure produced by cardiac contraction. Potential energy can be expressed as follows:
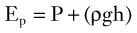 [2]
[2]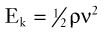 [3]
[3]By combining Equations 2 and 3, an expression for the total fluid energy per unit volume of blood (in ergs per cubic centimeter) can be obtained:
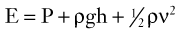 [4]
[4]Fluid Energy Losses
Bernoulli’s Principle
 [5]
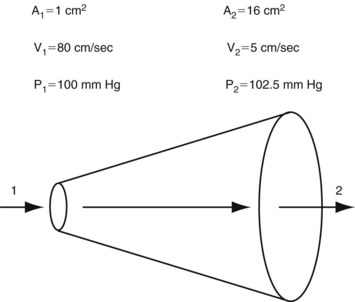
[5]This equation expresses the relationships among pressure, gravitational potential energy, and kinetic energy in an idealized fluid system. In the horizontal diverging tube shown in Figure 13-1, steady flow between point 1 and point 2 is accompanied by an increase in cross-sectional area and a decrease in flow velocity. Although the fluid moves against a pressure gradient of 2.5 mm Hg and therefore gains potential energy, the total fluid energy remains constant because of the lower velocity and a proportional loss of kinetic energy. In other words, the widening of the tube results in the conversion of kinetic energy to potential energy in the form of pressure. In a converging tube, the opposite would occur; a pressure drop and increase in velocity would result in potential energy being converted to kinetic energy.
The situation depicted in the preceding example is not observed in human arteries because the ideal flow conditions specified in the Bernoulli relationship are not present. The fluid energy lost in moving blood through the arterial circulation is dissipated mainly in the form of heat. When this source of energy loss is accounted for, Equation 5 becomes the following:
 [6]
[6]Viscous Energy Losses and Poiseuille’s Law
 [7]
[7]Shear stress is proportional to the energy loss owing to friction between adjacent fluid layers, whereas shear rate is the relative velocity of adjacent fluid layers. Fluids with particularly strong intermolecular attractions offer a high resistance to flow and have high coefficients of viscosity. For example, motor oil has a higher coefficient of viscosity than water.3 The unit of viscosity is the poise, which equals 1 dyne-s/cm2. Because it is difficult to measure viscosity directly, relative viscosity is often used to relate the viscosity of a fluid to that of water. The relative viscosity of plasma is approximately 1.8, whereas the relative viscosity for whole blood is in the range of 3 to 4.
Because viscosity increases exponentially with increases in hematocrit, the concentration of red blood cells is the most important factor affecting the viscosity of whole blood. The viscosity of plasma is determined largely by the concentration of plasma proteins. These constituents of blood are also responsible for its non-Newtonian character. In a Newtonian fluid, viscosity is independent of shear rate or flow velocity. Because blood is a suspension of cells and large protein molecules, its viscosity can vary greatly with shear rate (Figure 13-2). Blood viscosity increases rapidly at low shear rates, but approaches a constant value at higher shear rates. In most of the arterial circulation, the prevailing shear rates place the blood viscosity on the asymptotic portion of the curve. Thus, for arteries with diameters greater than approximately 1 mm, human blood resembles a constant-viscosity, or Newtonian, fluid.
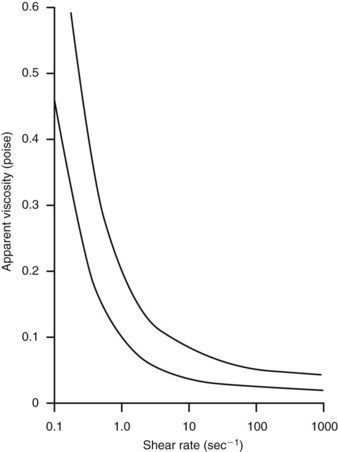
FIGURE 13-2 Viscosity of human blood as a function of shear rate. Values range between the two lines.
(From Strandness DE, Sumner DS: Hemodynamics for surgeons, New York, 1975, Grune and Stratton.)
 in centimeters per second) or volume flow (Q, in cubic centimeters per second), the tube length (L, in centimeters), and the fluid viscosity (η, in poise), and is inversely proportional to either the second or fourth power of the radius (r, in centimeters):
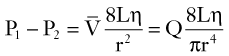 [8]
[8]Inertial Energy Losses
 [9]
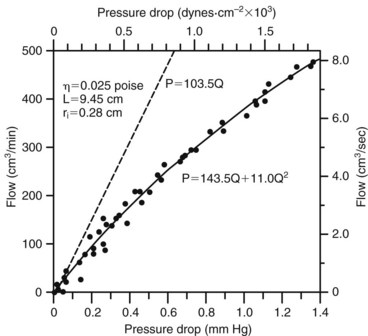
[9]Because velocity is the only independent variable in this equation, inertial energy losses result from the acceleration and deceleration of pulsatile flow, variations in lumen diameter, and changes in the direction of flow at points of curvature and branching. The combined effects of viscous and inertial energy losses are illustrated in Figure 13-3. When the pressure drop across an arterial segment is measured at varying flow rates, the experimental data fit a line with both linear (viscous) and squared (inertial) terms. The viscous energy losses predicted by Poiseuille’s law are considerably less than the total energy loss actually observed.
Vascular Resistance
 [10]
[10]Because the kinetic energy term ( ρν2) is typically a small component of the total fluid energy, and the artery is usually assumed to be horizontal so that the gravitational potential energy terms (ρgh) cancel, Equation 4 can be used to express resistance as the simple ratio of pressure drop (P1 – P2) to flow. Thus, Equation 10 becomes a rearranged version of Poiseuille’s law (Equation 8), and the minimum resistance or viscous energy losses are given by the resistance term:
 [11]
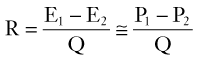
[11]The hemodynamic resistance of an arterial segment increases as the flow velocity increases, provided that the lumen size remains constant (Figure 13-4). These additional energy losses are related to inertial effects and are proportional to  ρν2.
ρν2.
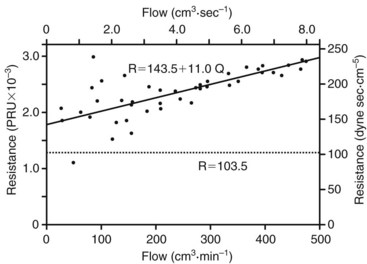
FIGURE 13-4 Resistance derived from the pressure-flow curve in Figure 13-3. The resistance increases with increasing flow. Constant resistance predicted by Poiseuille’s law is shown by the dotted line. PRU, Peripheral resistance unit.
(From Sumner DS: The hemodynamics and pathophysiology of arterial disease. In Rutherford RB, editor: Vascular surgery, Philadelphia, 1977, WB Saunders.)
According to Equation 11, the predominant factor influencing hemodynamic resistance is the fourth power of the radius. The relationship between radius and pressure drop for various flow rates along a 10-cm vessel segment is shown in Figure 13-5. For a wide range of flow rates, the pressure drop is negligible until the radius is reduced to approximately 0.3 cm; for radii less than 0.2 cm, the pressure drop increases rapidly. These observations may explain the frequent failure of femoropopliteal autogenous vein bypass grafts less than 4 mm in diameter.4
 [12]
[12] [13]
[13]The standard physical units of hemodynamic resistance are dyne-seconds per centimeter to the fifth power. A more convenient way of expressing resistance is the peripheral resistance unit (PRU), which has the dimensions of millimeters of mercury per cubic centimeter per minute. One PRU is approximately 8 × 10⁴ dyne-s/cm.5
In the human circulation, approximately 90% of the total vascular resistance results from flow through the arteries and capillaries, whereas the remaining 10% results from venous flow. The arterioles and capillaries are responsible for more than 60% of the total resistance, whereas the large- and medium-sized arteries account for only about 15%.2 Thus, the arteries that are most commonly affected by atherosclerotic occlusive disease are normally vessels with low resistance.
Blood Flow Patterns
Laminar Flow
In the steady-state conditions specified by Poiseuille’s law, the flow pattern is laminar. All motion is parallel to the walls of the tube, and the fluid is arranged in a series of concentric layers, or laminae, like those shown in Figure 13-6. While the velocity within each lamina remains constant, the velocity is lowest adjacent to the tube wall and increases toward the center of the tube. This results in a velocity profile that is parabolic in shape (Figure 13-7). As discussed previously, the energy expended in moving one lamina of fluid over another is proportional to viscosity.
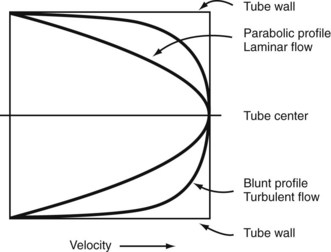
Turbulent Flow
 [14]
[14]In flowing blood at Reynolds numbers greater than 2000, inertial forces may disrupt laminar flow and produce fully developed turbulence. With values less than 2000, localized flow disturbances are damped out by viscous forces. In the normal arterial circulation, Reynolds numbers are usually less than 2000, and true turbulence is unlikely to occur; however, Reynolds numbers greater than 2000 can be found in the ascending aorta, where small areas of turbulence develop.3 Although turbulent flow is uncommon in normal arteries, the arterial flow pattern is often disturbed.5 The condition of disturbed flow is an intermediate state between stable laminar flow and fully developed turbulence. It is a transient perturbation in the laminar streamlines that disappears as the flow proceeds downstream. Arterial flow may become disturbed at points of branching and curvature.
When turbulence is the result of a stenotic arterial lesion, it generally occurs immediately downstream from the stenosis and may be present only over the systolic portion of the cardiac cycle when the critical value of the Reynolds number is exceeded. Under conditions of turbulent flow, the velocity profile changes from the parabolic shape of laminar flow to a rectangular or blunt shape (see Figure 13-7). Because of the random velocity changes, energy losses are greater for a turbulent or disturbed flow state than for a laminar flow state. Consequently, the linear relationship between pressure and flow expressed by Poiseuille’s law cannot be applied. This deviation from Poiseuille’s law in arterial flow is shown in Figure 13-3.
Boundary Layer Separation
In fluid flowing through a tube, the portion of fluid adjacent to the tube wall is referred to as the boundary layer. This layer is subject to both frictional interactions with the tube wall and viscous forces generated by the more rapidly moving fluid toward the center of the tube. When the tube geometry changes suddenly, such as at points of curvature, branching, or variations in lumen diameter, small pressure gradients are created that cause the boundary layer to stop or reverse direction. This change results in a complex, localized flow pattern known as an area of boundary layer separation or flow separation.6
Areas of boundary layer separation have been observed in models of arterial anastomoses and bifurcations.7,8 In the carotid artery bifurcation shown in Figure 13-8, the central rapid flow stream of the common carotid artery is compressed along the inner wall of the carotid bulb, producing a region of high shear stress. An area of flow separation has formed along the outer wall of the carotid bulb that includes helical flow patterns and flow reversal. The region of the carotid bulb adjacent to the separation zone is subject to relatively low shear stresses. Distal to the bulb, in the internal carotid artery, flow reattachment occurs, and a more laminar flow pattern is present.
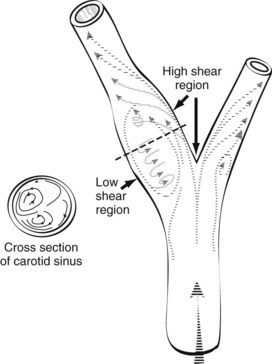
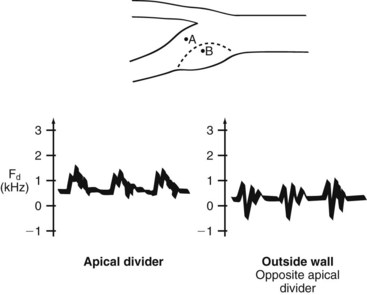
The complex flow patterns described in models of the carotid bifurcation have also been documented in human subjects by pulsed Doppler studies.9,10 As shown in Figure 13-9, the Doppler spectral waveform obtained near the inner wall of the carotid bulb is typical of the forward, quasi-steady flow pattern found in the internal carotid artery. However, sampling of flow along the outer wall of the bulb demonstrates lower velocities with periods of both forward and reverse flow. These spectral characteristics are consistent with the presence of flow separation and are considered to be a normal finding, particularly in young individuals.10 Alterations in arterial distensibility with increasing age make flow separation less prominent in older individuals.11
The clinical importance of boundary layer separation is that these localized flow disturbances may contribute to the formation of atherosclerotic plaques.12 Examination of human carotid bifurcations, both at autopsy and during surgery, indicates that intimal thickening and atherosclerosis tend to occur along the outer wall of the carotid bulb, whereas the inner wall is relatively spared.8 These findings suggest that atherosclerotic lesions form near areas of flow separation and low shear stress. It is not known whether flow separation represents a true causative factor or simply promotes the development of previously existing lesions.
Pulsatile Flow
The complex interactions of cardiac contraction, arterial wall characteristics, and blood flow are extremely difficult to define rigorously. For example, estimation of the inertial energy losses in pulsatile flow requires a value for the velocity term (see Equation 9); however, in pulsatile flow, velocity varies with both time and position across the flow profile, and skewing of the velocity profile can occur as a result of curvature or branching. The resistance term of Poiseuille’s law (see Equation 11) estimates viscous energy losses in steady flow, but it does not account for the inertial effects, arterial wall elasticity, and wave reflections that influence pulsatile flow. The term vascular impedance is used to describe the resistance or opposition offered by a peripheral vascular bed to pulsatile blood flow.3
Pulsatile flow appears to be important for optimal organ function. For example, when a kidney is perfused by steady flow instead of pulsatile flow, a reduction in urine volume and sodium excretion occurs.13 The critical effect of pulsatile flow is probably exerted on the microcirculation. Although the exact mechanism is unknown, transcapillary exchange, arteriolar tone, and lymphatic flow are all influenced by the pulsatile nature of blood flow.
Bifurcations and Branches
Bifurcation flow can be analyzed in terms of pressure gradient, velocity, and transmission of pulsatile energy. According to Poiseuille’s law, an area ratio of 1.41 would allow the pressure gradient to remain constant along a bifurcation. If the combined area of the branches equals the area of the primary artery, the area ratio is 1.0, and there is no change in the velocity of flow.14 For efficient transmission of pulsatile energy across a bifurcation, the vascular impedance of the primary artery should equal that of the branches, a situation that occurs with an area ratio of 1.15 for larger arteries and 1.35 for smaller arteries.15 Human infants have a favorable area ratio of 1.11 at the aortic bifurcation, but there is a gradual decrease in the ratio with age. In the teenage years, the average area ratio is less than 1.0; in the 20s, it is less than 0.9; and by the 40s, it drops below 0.8.16 This decline in the area ratio of the aortic bifurcation leads to an increase in both the velocity of flow in the secondary branches and the amount of reflected pulsatile energy. For example, with an area ratio of 0.8, approximately 22% of the incident pulsatile energy is reflected in the infrarenal aorta. This mechanism may play a role in the localization of atherosclerosis and aneurysms in this arterial segment.17
The curvature and angulation of an arterial bifurcation can also contribute to the development of flow disturbances. As blood flows around a curve, the high-velocity portion of the stream is subjected to the greatest centrifugal force; rapidly moving fluid in the center of the vessel tends to flow outward and be replaced by the slower fluid originally located near the arterial wall. This can result in complex helical flow patterns, such as those observed in the carotid bifurcation.9 As the angle between the secondary branches of a bifurcation is increased, the tendency to develop turbulent or disturbed flow also increases. The average angle between the human iliac arteries is 54 degrees; however, with diseased or tortuous iliac arteries, this angle can approach 180 degrees.3 In the latter situation, flow disturbances are particularly likely to develop.
Physical Properties of the Arterial Wall
Composition
As the structure of the arterial wall changes, each successive branching also increases the total cross-sectional area of the arterial tree. The cross-sectional area at the arteriolar level is approximately 125-fold that of the aorta; at the capillary level, it has increased approximately 800 times.3 The reduced elastin-to-collagen ratio and increased stiffness of the peripheral arteries result in a more rapid pulse wave velocity and a high vascular impedance. Although the impedance of the thoracic aorta must be low to minimize cardiac work, the impedance of peripheral arteries should match the high arteriolar impedance to decrease the reflected components of the pulse wave.
Tangential Stress and Tension
 [15]
[15]Equation 15 is similar to Laplace’s law, which defines tangential tension (T) as the product of pressure and radius:
 [16]
[16]Arterial Wall Properties in Specific Conditions
Aging and Atherosclerosis.
Arterial walls become less distensible with age. This increase in stiffness cannot be explained on the basis of atherosclerosis alone.3 Alterations in the elastin fibers and elastic lamellae, together with an increase in wall thickness, probably account for this increase in arterial stiffness. Changes associated with aging include fragmentation of elastic lamellae and deposition of collagen between the elastin layers. This tends to maintain the elastin fibers in the extended state. Calcium is also deposited near the elastin fibers and contributes to the increased thickness of the arterial wall.
Endarterectomy.
During an endarterectomy the atherosclerotic plaque is removed, along with the intima and a portion of the media, leaving behind a tube consisting of the outer media and adventitia. This reduces the wall thickness to approximately one third of its original value and should result in an increase in tangential stress, according to Equation 15. As would be expected, endarterectomy decreases the stiffness of an artery to circumferential expansion.18 Still, the endarterectomized artery remains stiffer and less distensible than a normal artery; this indicates that the components responsible for strength and stiffness are concentrated in the outer layers of the arterial wall. It is because of this anatomic arrangement that endarterectomy is possible.
Aneurysms.
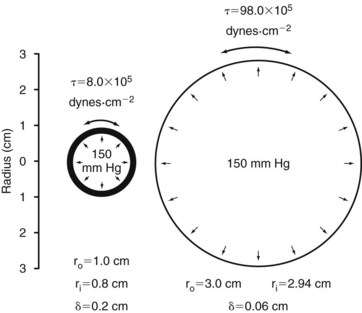
When the structural components of the arterial wall are weakened, aneurysms can form. Rupture occurs when the tangential stress within the arterial wall becomes greater than the tensile strength. Figure 13-10 shows a tube with an outside diameter of 2 cm and a wall thickness of 0.2 cm, dimensions similar to those of atherosclerotic aortas.1 If the internal pressure is 150 mm Hg, the tangential wall stress is 8.0 × 10⁵ dynes/cm2. Expansion of the tube to form an aneurysm with a diameter of 6 cm results in a decrease in wall thickness to 0.06 cm. The increased radius and decreased wall thickness increase the wall stress to 98.0 × 10⁵ dynes/cm2, assuming that the pressure remains constant. In this example, the diameter has been enlarged by a factor of 3, and the wall stress has increased by a factor of 12.
Although the tensile strength of collagen is extremely high, it constitutes only approximately 15% of the aneurysm wall.19 Furthermore, the collagen fibers in an aneurysm are sparsely distributed and subject to fragmentation. The tendency of larger aneurysms to rupture is readily explained by the effect of increased radius on tangential stress (see Equation 15) and the degenerative changes in the arterial wall. The relationship between tangential stress and blood pressure accounts for the contribution of hypertension to the risk of rupture.
The diverging and converging geometry of aneurysms can result in complex flow patterns that include areas of boundary layer separation and flow reversal.20 These patterns explain the frequent accumulation of thrombus in aneurysms, which confines the flow stream to an area not much larger than the native artery. Because this thrombus increases the effective thickness of the vessel wall, it may reduce tangential stress and provide some protection against rupture. However, the tensile strength of thrombus and arterial wall are different, and the contribution of thrombus to the integrity of an aneurysm is impossible to predict.3 Furthermore, the thrombus within an aneurysm is often not circumferential. In this situation, Equation 15 can be applied to the wall segment without thrombus, and the tangential stress at that site depends on the maximum internal radius.
Another factor to consider is that in approximately 55% of ruptured abdominal aortic aneurysms, the site of rupture is in the posterolateral aspect of the aneurysm wall.21 The posterior wall of the aorta is relatively fixed against the spine, and repeated flexion of the wall in that area could result in structural fatigue. This fatigue would produce a localized area of weakness that might predispose to rupture.
Hemodynamics of Arterial Stenosis
Energy Losses
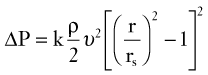
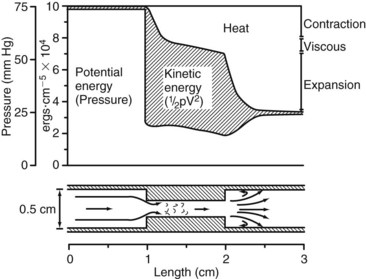
According to Poiseuille’s law (see Equation 8), the radius of a stenotic segment has a much greater effect on viscous energy losses than does its length. Inertial energy losses, which occur at the entrance (contraction effects) and exit (expansion effects) of a stenosis, are proportional to the square of blood velocity (see Equation 9). Energy losses are also influenced by the geometry of a stenosis; a gradual tapering results in less energy loss than an irregular or abrupt change in lumen size. A converging vessel geometry tends to stabilize laminar flow and flatten the velocity profile, whereas a diverging vessel produces an elongated velocity profile and a less stable flow pattern. The energy lost at the exit of a stenosis can be significant because of the sudden expansion of the flow stream and dissipation of kinetic energy in a zone of turbulence.
 [17]
[17]Figure 13-11 illustrates the energy losses related to a 1-cm-long stenosis. The viscous losses are relatively small and occur within the stenotic segment. Inertial losses resulting from contraction and expansion are much greater. Because most of the energy loss in this example results from inertial effects, the length of the stenosis is relatively unimportant.1
< div class='tao-gold-member'>
Stay updated, free articles. Join our Telegram channel

Full access? Get Clinical Tree


