Hemodynamics for the Interventional Cardiologist
Morton J. Kern MD, FSCAI, FAHA, FACC
Barry A. Borlaug MD, FSCAI, FACC
As invasive cardiology has evolved from a primarily diagnostic to a predominantly therapeutic specialty, the importance of a thorough understanding of normal and pathologic cardiovascular hemodynamics has been lost. However, such understanding is critical to appropriately recognize and treat situations that commonly arise during the practice of interventional cardiology. With the advent of structural heart disease interventions, the diagnosis of and percutaneous treatment for valvular and other structural heart disease conditions have reemphasized the value of a thorough working knowledge of these concepts. This chapter reviews the fundamentals of basic cardiac hemodynamics, including those of the most common structural heart disease entities encountered in practice. Complete reviews of hemodynamics in general and those specifically applicable to more complex conditions can be found elsewhere (1, 2, 3 and 4).
There are two major hemodynamic problems that present acutely during coronary interventions: hypotension and hypertension. Table 10-1 lists the most common causes of hypotension during coronary percutaneous interventions, which include volume loss, anaphylaxis, cardiac tamponade, arrhythmia, new valvular lesions, and shock, either hypovolemic and/or cardiogenic. Artifactual causes of hypotension because of errors in pressure measurement should also be considered.
Hypertension is uncommon during coronary interventions, but may be because of previously untreated or labile hypertension, medication delay, or overzealous vasopressor support, a recognizable condition that is easily treated. For example, 2 minutes after a left ventriculogram (Fig. 10-1), the patient became hypotensive. Assessment of the change in left ventricular (LV) diastolic pressure tracing suggests that the hypotension is related to acute reduction in preload. This rapid change after initial challenge with contrast dye suggests excessive venous and arteriolar vasodilation because of anaphylactic shock. Immediate administration of epinephrine is a lifesaver in this circumstance.
Other common diagnostic dilemmas that present for both coronary and noncardiac interventions are listed in Table 10-2. These include hemodynamic coronary lesion assessment, evaluation of hypertrophic cardiomyopathy, mitral valve disease, diastolic dysfunction, constrictive pericarditis, restrictive physiology, intracardiac shunting, low gradient aortic stenosis, and prosthetic valve dysfunction. The hemodynamics of each of these conditions are pertinent to the intervention performed for both the diagnostic results and recognition of complications, and will be discussed below.
TABLE 10-1 Causes of Hypotension during Coronary Interventions | |||||||
|---|---|---|---|---|---|---|---|
|
REVIEW OF BASIC HEMODYNAMICS
Pressure waves are generated in the heart and vasculature in response to the cardiac muscular contraction producing positive pressure waves and to the muscular relaxation producing negative pressure vortices (suction) that enhance early diastolic filling. Mechanical events are preceded by an electrical deflection on the electrocardiogram (ECG) (Fig. 10-2). Periods of LV contraction and relaxation as well as transvalvular and intraventricular pressure gradients can be identified based upon their timing relative to the ECG. Each electrical event (e.g., P wave, QRS, T wave) is followed normally by a specific pressure wave or deflection. The normal sequence and amplitude of pressure waveforms may be altered by arrhythmias and conduction defects, acute ischemia, or changes in the mechanical properties of the heart and great vessels.
NORMAL PRESSURE WAVE FORMS
The P wave identifies electrical depolarization of the atria and corresponds to the onset of atrial contraction. This is represented by the “A” wave in the atrium or pulmonary wedge (PW) position. Atrial contraction also creates a positive deflection at the end of LV diastole, just prior to the point of end-diastolic pressure, LV end-diastolic pressure (LVEDP) (Fig. 10-2). This corresponds to the point at which the R wave (vertical line) intersects with LV pressure curve. Normal LVEDP is 6 to 15 mm Hg. Elevated LVEDP is commonly seen in heart failure, aortic valve disease, or acute ischemia. Immediately following the QRS complex, the ventricles contract and the LV (and the right ventricular [RV]) pressure increases rapidly prior to the opening of the aortic (or pulmonary) valve. This is termed the isovolumetric contraction period, and the maximal rate of pressure increase during this period (dP/dtmax) is sometimes reported as a measure of ventricular contractility. When pressure in the left ventricle exceeds that in the aorta, the aortic valve opens. Systolic ejection continues until repolarization, which is signaled by the T wave. After the T wave, active myocardial relaxation and elastic recoil produce a rapid decay in LV pressure. This period is known as isovolumic relaxation, and is prolonged in patients with diastolic dysfunction. When LV pressure falls below the aortic pressure, the aortic valve closes. This is marked by the dicrotic notch in the aortic (or pulmonary artery PA) pressure tracing. When LV pressure falls below the left atrial (LA) pressure, the mitral valve opens, and the left artery empties into the LV. The peak
of the atrial (or the PW) V wave corresponds to the time just prior to mitral or tricuspid valve opening, and the rapid early filling of the ventricle corresponds to the “Y” descent in the atrial (or the PW) tracing.
of the atrial (or the PW) V wave corresponds to the time just prior to mitral or tricuspid valve opening, and the rapid early filling of the ventricle corresponds to the “Y” descent in the atrial (or the PW) tracing.
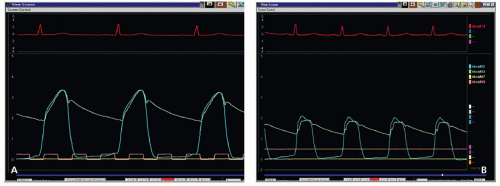 FIGURE 10-1 Hypotension during cardiac cath can be caused by volume loss, anaphylaxis, tamponade, arrhythmia, new Valvular lesion, shock, and pressure miscalibration. Two minutes after LV gram (right), the patient became hypotensive. Note low-filling pressures suggest acute volume loss or more accurately relative volume loss with anaphylactic vasodilation. This reaction requires immediate epinephrine. |
ASSESSMENT OF VALVULAR STENOSIS
Echocardiography has largely supplanted catheterization in the evaluation of aortic valve stenosis, but invasive assessment remains the gold standard and is still required in equivocal cases. Unfortunately, many operators continue to use femoral artery (FA) pressure obtained through the side arm of an arterial sheath as their distal aortic tracing for aortic outflow gradient assessment. FA pressure approximates, but typically overestimates, central aortic pressure. As incident (outgoing) pressure waves encounter zones of impedance mismatch (such as arterial bifurcations), backward-traveling reflected waves are created. These reflected waves sum with incident waves to increase arterial pressures progressively as one moves the catheter farther away from the aortic valve. This explains why FA systolic pressure is normally higher than central aortic pressure. It is also delayed in time relative to central pressure, with the degree of delay being inversely related to aortic stiffness (Fig. 10-3). Variability introduced by both delay and pressure amplification of the FA may significantly affect the mean transaortic gradient when using FA as “A0.” Figure 10-3 shows the LV aortic pressure measured from a high fidelity catheter with micromanometer pressure transducers above and below the aortic valve, compared with a fluid-filled LV catheter with the fluid-filled FA sheath pressure. The FA pressure waveform is delayed of greater magnitude compared with the aortic pressure trace. Use of FA pressure becomes even more limited when peripheral vascular disease is present at the level of the
aortic bifurcation or lower. For better accuracy, a double lumen catheter or two arterial catheters should be used.
aortic bifurcation or lower. For better accuracy, a double lumen catheter or two arterial catheters should be used.
TABLE 10-2 Common Diagnostic Hemodynamics Problems in Coronary and Noncardiac/Noncoronary Interventions | ||||||||||||||
|---|---|---|---|---|---|---|---|---|---|---|---|---|---|---|
| ||||||||||||||
 FIGURE 10-2 The Wigger’s diagram of cardiac hemodynamics. |
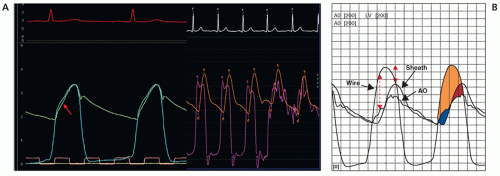 FIGURE 10-3 A: Normal LV and aortic hemodynamics. Left panel: high fidelity LV and simultaneous aortic pressures measured with dual micromanometer catheter. Right panel: fluid filled LV and femoral artery pressure waveforms showing under damped signals. The typical delay in pressure transmission to the femoral artery and its systolic pressure amplification above the LV systolic pressure is evident. B: Comparison of LV aortic valve gradients using central aortic and femoral artery pressure. The femoral artery produces a smaller gradient than central aorta owing to the overshoot of systolic pressure amplification not compensated for by delay in the upstroke. The dashed red arrow shows the peak instantaneous pressure gradient, and the solid arrow shows the peak-to-peak pressure gradient. The shaded areas show the difference between the gradients of the central and femoral artery pressures. (From: Fusberg et al. Cath CV Int. 53:553;2001, with permission.) |
The most common pressure wave artifact of a fluid-filled system is exaggerated resonance or “ringing” of an underdamped pressure system (Fig. 10-3, right side). These artifacts can jeopardize the quality of transvalvular gradient assessments. The use of short stiff tubing, properly debubbled lines, and calibrated recordings is essential to minimize these artifacts.
Valve Area Calculations
Stenotic valve areas are calculated from transvalvular pressure gradients and cardiac output. Cardiac output can be measured by indicator-dilution methods (thermodilution) or the Fick method. The Fick calculation relies on assessment of oxygen consumption and peripheral oxygen extraction:
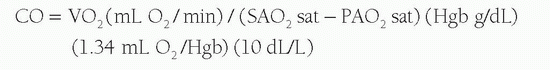
Where VO2 is the whole body O2 consumption, SAO2 sat is the systemic arterial saturation, PAO2 sat is the pulmonary arterial saturation, and Hgb is the hemoglobin content.
Oxygen consumption (VO2) can be directly measured or assumed based on body size (commonly 3 mL O2/kg or 125 mL O2/L m2 BSA). The error from this assumption can be substantial (±10% to 25%). After determining output and the transvalvular gradient, the Gorlin formula can be applied to both aortic and mitral valves to determine valve area.

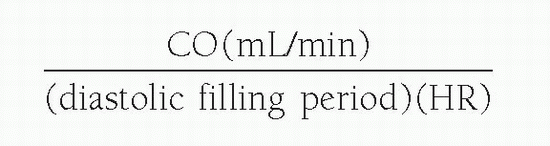
where MVG is mean valvular gradient (mm Hg), K (44.3) is a derived constant by Gorlin and Gorlin, C is an empirical constant, which is 1 for semilunar valves and tricuspid valve and 0.85 for mitral valve, and valve flow is measured in milliliters per second during the diastolic or systolic flow period. For mitral valve flow, the diastolic filling period is used:
For aortic valve flow, the systolic ejection period is used:
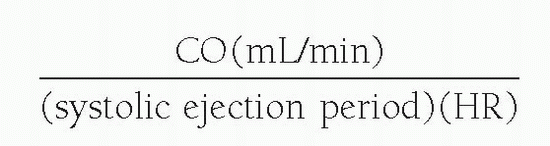
where systolic ejection period (sec/min) = systolic period (sec/beat) × HR.
A simplified formula, the Hakki equation (5), can provide a quick in-laboratory determination of aortic valve area accurately estimated as:
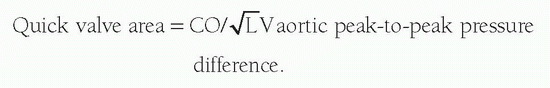
For example, if peak-to-peak gradient is 65 mm Hg and CO is 5 L/min,
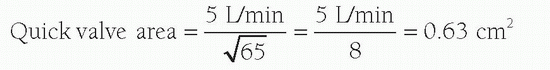
The value derived from the quick formula differs from that from the Gorlin formula by 18% ± 13% in patients with bradycardia (<65 beats/min) or tachycardia (>100 beats/min). The Gorlin equation overestimates the severity of valve stenosis in low-flow (i.e., low cardiac output) states.
AORTIC VALVE DISEASE
Aortic Stenosis
Aortic stenosis impedes systolic outflow, forcing the LV to eject against the resisting stenotic valve. Restrictive opening of the aortic valve leaflets causes the aortic upstroke to be delayed (pulsus
tardus) and reduced in amplitude (pulsus tardus). LV systolic pressure is increased in most cases with preserved cardiac output (Fig. 10-4). Surgical aortic valve replacement remains the gold standard definitive treatment for AS, but in select patients, surgical risk may be too high, and in these cases aortic balloon valvuloplasty should be considered. Percutaneous aortic balloon valvuloplasty (PAVP) opens the stiff leaflets, and its immediate success can be gauged from the changes in the Aortic LV pressures, aortic upslope, and gradient (Fig. 10-5) after balloon valvuloplasty. Note the changes in upstroke (red dotted line) and increase in aortic pressure (blue dotted line) and fall in LV peak pressure. The operator should observe the slope of aortic pressure upstroke to avoid mistakenly accepting an erroneous pressure whose zero offset resulted in an increased aortic pressure appearing as a reduced peak-to-peak gradient. A stepwise use of larger balloon inflations can produce gradually enlarged valve area, which can be documented by the hemodynamics. The hemodynamic endpoint of the procedure is a reduction in LV aortic gradient (<30 mm Hg) and increase in valve area (≥25% of baseline). Unfortunately, stenosis invariably recurs in weeks to months, and long-term outcomes remain poor, but this is often useful as a temporizing measure or to assess the reversibility of myocardial dysfunction in select patients.
tardus) and reduced in amplitude (pulsus tardus). LV systolic pressure is increased in most cases with preserved cardiac output (Fig. 10-4). Surgical aortic valve replacement remains the gold standard definitive treatment for AS, but in select patients, surgical risk may be too high, and in these cases aortic balloon valvuloplasty should be considered. Percutaneous aortic balloon valvuloplasty (PAVP) opens the stiff leaflets, and its immediate success can be gauged from the changes in the Aortic LV pressures, aortic upslope, and gradient (Fig. 10-5) after balloon valvuloplasty. Note the changes in upstroke (red dotted line) and increase in aortic pressure (blue dotted line) and fall in LV peak pressure. The operator should observe the slope of aortic pressure upstroke to avoid mistakenly accepting an erroneous pressure whose zero offset resulted in an increased aortic pressure appearing as a reduced peak-to-peak gradient. A stepwise use of larger balloon inflations can produce gradually enlarged valve area, which can be documented by the hemodynamics. The hemodynamic endpoint of the procedure is a reduction in LV aortic gradient (<30 mm Hg) and increase in valve area (≥25% of baseline). Unfortunately, stenosis invariably recurs in weeks to months, and long-term outcomes remain poor, but this is often useful as a temporizing measure or to assess the reversibility of myocardial dysfunction in select patients.
Aortic Regurgitation
Aortic regurgitation occurs when there is failure of coaptation of the aortic valve leaflets, allowing blood to enter the left ventricular cavity from the aorta during diastole. Acute aortic regurgitation is one of the most common complications of PAVP. The particular hemodynamic derangement depends on the extent of valve leaflet and/or aortic root disruption. In acute AR, the pulse pressure is narrow and LVEDP is very high, and the patient is at risk for acute pulmonary edema. Figure 10-6 shows the hemodynamic results
of PAVP that produced acute aortic regurgitation. Measurements made with the stiff exchange wire across a calcific stenotic valve may prop the leaflet open and produce an identical hemodynamic picture. The three major findings of chronic AR are wide pulse pressure, rapid upstroke of the LV diastolic filling pressures, and near pressure equilibration of end-diastolic aortic and LV pressures. Figure 10-7 shows a patient with mixed aortic stenosis and regurgitation. Note the wide pulse pressure and rapid LV diastolic filling slope up to the LVEDP. The severity of AR can be determined angiographically using the Sellars criteria.
of PAVP that produced acute aortic regurgitation. Measurements made with the stiff exchange wire across a calcific stenotic valve may prop the leaflet open and produce an identical hemodynamic picture. The three major findings of chronic AR are wide pulse pressure, rapid upstroke of the LV diastolic filling pressures, and near pressure equilibration of end-diastolic aortic and LV pressures. Figure 10-7 shows a patient with mixed aortic stenosis and regurgitation. Note the wide pulse pressure and rapid LV diastolic filling slope up to the LVEDP. The severity of AR can be determined angiographically using the Sellars criteria.
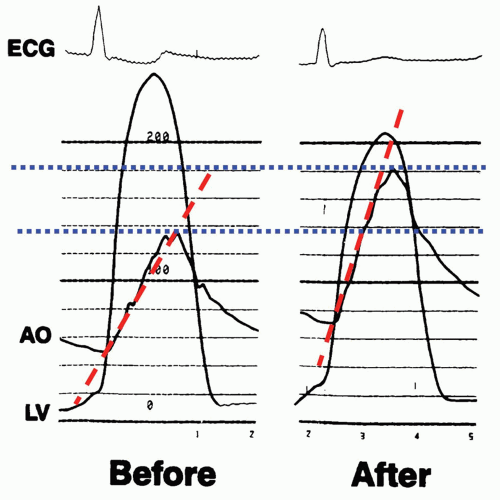 FIGURE 10-4 Hemodynamics of Aortic stenosis. Left ventricular (yellow) and aortic (green) pressure tracings obtained from dual lumen fluid-filled catheter. Scale is 200 mm Hg. Note very delayed aortic upstroke. |
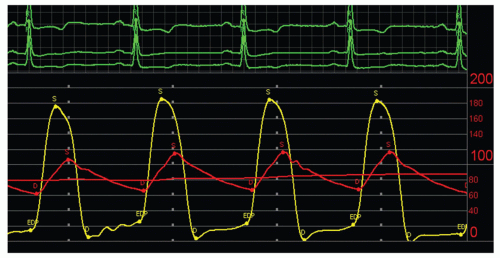 FIGURE 10-5 Hemodynamics before and after aortic balloon valvuloplasty. Left panel before AVP shows large LV-A0 gradient (100 mm Hg) with delayed upslope of aortic pressure (red line). Aortic peak pressure is 138 mm Hg, peak LV pressure is 230 mm Hg. After successful AVP, aortic pressure increased to 180 mm Hg and LV pressure fell to 205 mm Hg; LV-A0
Get Clinical Tree app for offline access
Stay updated, free articles. Join our Telegram channel
Full access? Get Clinical Tree


|