12 Hemodynamics
Basic Physics of Pressure Measurement
Measuring intracardiac and intravascular pressures is an integral part of every cardiac catheterization. The respective pressure curves are recorded inertia-free by using electric pressure transducers with appropriate recording equipment (Chapter 4). However, due to distortion in the hydraulic-flexible part of the measuring system, the pressure signal recorded at the pressure transducer is different from the actual pressure at the catheter tip. In a completely inflexible system there would not be any distortion. Due to the distensibility of the connections and the flexibility of the pressure transducer diaphragm, the fluid column from the catheter tip to the pressure transducer behaves like an oscillating system, especially if micro- and macroscopic air bubbles are present. Sudden pressure changes at the catheter tip are recorded at the pressure transducer either as damped sinusoidal oscillations or as exponential waves (Fig. 12.1).
The frequency of the sinusoidal oscillation is referred to as the natural frequency (Fn) or eigenfrequency of the system. The more the damping of the system is increased, the lower this frequency. Thus, the natural frequency is influenced by the following factors:
 The compliance of the system (connectors not sufficiently rigid, air bubbles, contrast media in the system)
 The length of the catheter and of the connections
 The internal diameter of the catheter and of the connections
This is of practical relevance as the accuracy of a given pressure measuring system is acceptable only if the natural frequency is sufficiently high (Fn > 8 Hz) with simultaneous optimal damping of the system:
 In the case of an over-damped system only frequencies substantially lower than the natural frequency are accurately transmitted.
 In contrast, if the system is under-damped frequencies close to the natural frequency are augmented, whereas only frequencies substantially lower than Fn are accurately transmitted; all other frequencies are attenuated.
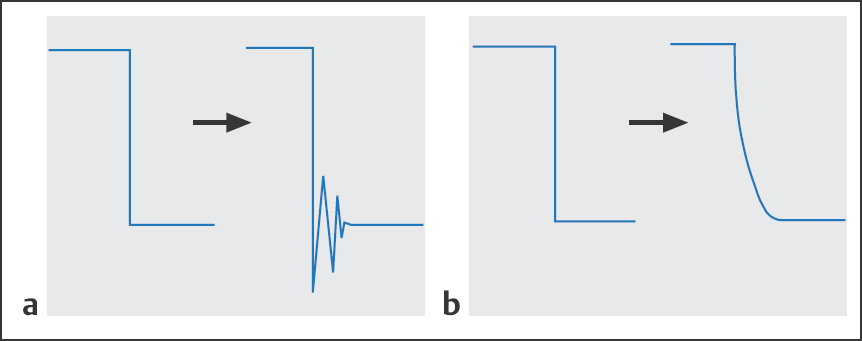
Fig. 12.1 a, b Dynamic transmission of sudden pressure changes at the catheter tip.
a Damped sinusoidal oscillation.
b Exponential waveform.
 As a consequence, if the system is under-damped the systolic pressure is overestimated and the diastolic pressure underestimated; if the curve is over-damped the blood pressure amplitude is too low.
 Transducer Zeroing
By convention the reference level of the measuring system has been defined as the pressure at the surface of the right atrium at the level at which the coronary sinus drains into the right atrium. This pressure cannot be measured directly; however, it can be assumed that at end expiration this pressure is identical with the air pressure. Prior to zeroing, the diaphragm of the pressure transducer has to be brought to the same level as the reference level.
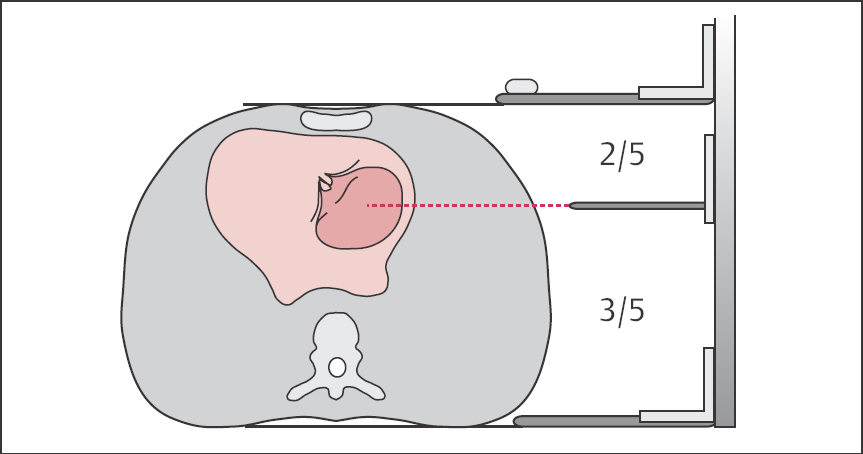
The best method for determining the reference level is the method according to Burri, which assumes the level of the right atrium to be at 3/5 of the thorax diameter from the top of the patient table or, conversely, 2/5 from the sternum (Fig. 12.2). This method accommodates different thorax diameters and is easy when using a caliper.
Measuring Range/Registration Speed
The sensitivity of the pressure amplifier is adjusted according to the magnitude of the systolic and diastolic pressure values of the curves to be recorded and according to the clinical question. For example, for simultaneous measurement of diastolic left ventricular pressure and pulmonary capillary wedge pressure, the pressure registration is always done with a lower scale (40 or 50 mm Hg). In contrast, pressure recording with catheter pull-back in severe aortic stenosis is often done with a 400 mm Hg scale. When using analog devices, simultaneous pressure measurements in different heart chambers always have to be done using the same scale; in contrast, with newer digital registration devices different scales can be adapted to each other.
In contrast to digital recording, with analog devices the recording speed also has to be predefined; for form analysis 50 mm/s is usually selected and for pressure gradient determination a speed of 100 mm/s.
 Sources of Error in Pressure Measurement
Errors in pressure measurement can be caused by
 Technical error with the measuring and registration system
 Incorrect reference point adjustment/zeroing
 Over-damping
 Under-damping (exaggeration of pressure curves, “overshoot”)
 Incorrect catheter position
 Intrathoracic pressure changes during measurement (e.g., ventilation, Valsalva maneuver)
Technical Errors
As the pressure transducer is the most sensitive part of the measurement and registration system, it is most often the source of technical errors. Calibration of the pressure transducers should be verified at regular intervals.
Oscillations of the zero line point to a technical defect in the pressure transducer. This can be caused by a leak in the hydraulic part or a drift in the electronic part of the measuring system. In most cases exchanging the pressure transducer solves the problem.
The linearity of the registration system is verified before every measurement.
Zero Adjustment
A difference in the level of the zero adjustment of 1 cm corresponds to a pressure change of 0.75 mm Hg. An incorrect zero adjustment can be assumed if the early diastolic pressure in the healthy right or in the left ventricle is not zero. This error can be easily avoided by verifying the level of the right atrium before the start of the examination and by repeating the zero adjustment before every measurement.
Excessive Damping
Possible causes include
 Air bubbles in the catheter, manifold, connecting tube or pressure gauge
 Contrast media in the catheter
 Partial obstruction of the catheter by blood or fibrin
 Distal catheter opening impinging on the vessel wall or cardiac wall
 Kinking of the catheter or of the connecting tube
 Leaky connections in the pressure measuring system
In most cases the error can be identified and corrected by thorough inspection of the entire system. It is only rarely necessary to remove the catheter or to replace the pressure measuring system. If thrombi or air are suspected, no flushing into the patient should be done; instead, forceful aspiration or removal or the catheter is required.
Exaggerated Overshoot of the Pressure Tracings
Occurrence of exaggerated overshoot in the pressure waves is the result of too little damping or too high a natural frequency of the pressure measuring system. This phenomenon is especially common when small-caliber, very flexible catheters are used. The shorter and more rigid the pressure measuring system (catheter and connecting tube) the less pronounced is the overshoot. This should always be considered when selecting a catheter for cardiac catheterization.
If an extension tube is necessary, it should also be as rigid as possible and have the same lumen as the catheter. Exaggerated overshoot can be attenuated by aspirating a small amount of blood into the catheter.
 During the entire measurement, the catheter and pressure measuring system should be undisturbed (avoid manipulations by the operator and unnecessary movements by the patient).
Wrong Catheter Position
Incorrect recording of pressure curves due to wrong catheter position during left heart catheterization should not occur under normal circumstances, as it should be possible to identify the different measuring sites unambiguously both by fluoroscopy and on the basis of the pressure curves.
In contrast, during right heart catheterization the following measuring errors or false interpretations can occur due to incorrect catheter position:
 Incomplete occlusion in wedge position
 Peripheral occlusion (overwedge)
 Catheter positioned close to the tricuspid or pulmonary valve
 Pulmonary capillary wedge pressure measurement performed in the apex of the lung
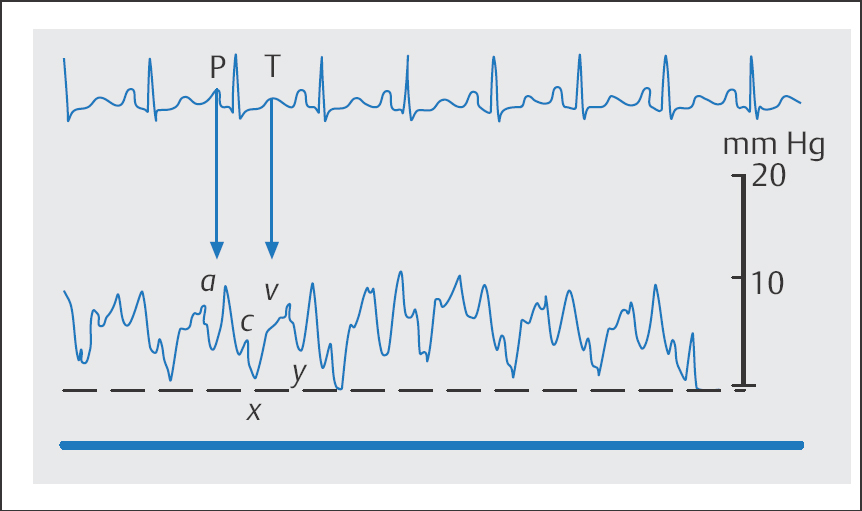
With incomplete occlusion of the pulmonary artery by the balloon a curve is obtained that can mimic a v-wave. The error can be recognized by trying to link temporally the putative v-wave to the ECG (Fig. 12.3).
The overwedge phenomenon is characterized by a slow, continuous pressure rise, which is due to occlusion of the catheter tip by a balloon inflated too much or by a catheter being positioned too peripherally.
Distorted pressure curves can occur if the catheter tip is close to the heart valves with alternating recording of either the atrial and ventricular pressure or the ventricular and pulmonary artery pressure.
If the catheter is placed in a vessel of the apex of the lung to measure pulmonary capillary wedge pressure, then the alveolar pressure may be measured instead of the left ventricular end-diastolic pressure (LVEDP). This is usually the case when the mean pulmonary capillary wedge pressure is substantially higher than the diastolic pressure in the pulmonary artery. The error can be easily corrected by changing the catheter position.
Intrathoracic Pressure Changes
Changes in intrathoracic pressures during measurement can result in substantial error if these pressure changes are not recognized. While the large increase in intrathoracic pressure during coughing can easily be identified, the interpretation of the pressure curve can be difficult if during the measurement the patient unconsciously and unnoticed by the operator performs a Valsalva maneuver. In some patients this can lead to marked increases of LVEDP and pulmonary capillary wedge pressure (Fig. 12.4). Furthermore, large variations due to respiration can complicate interpretation of the pressure curves. To avoid these types of errors the operator should make sure that during the measurement the patient is as relaxed as possible and breathes lightly and superficially with the mouth open. Nevertheless, to compensate for possible respiratory variation at least 10 consecutive cardiac cycles should be recorded.
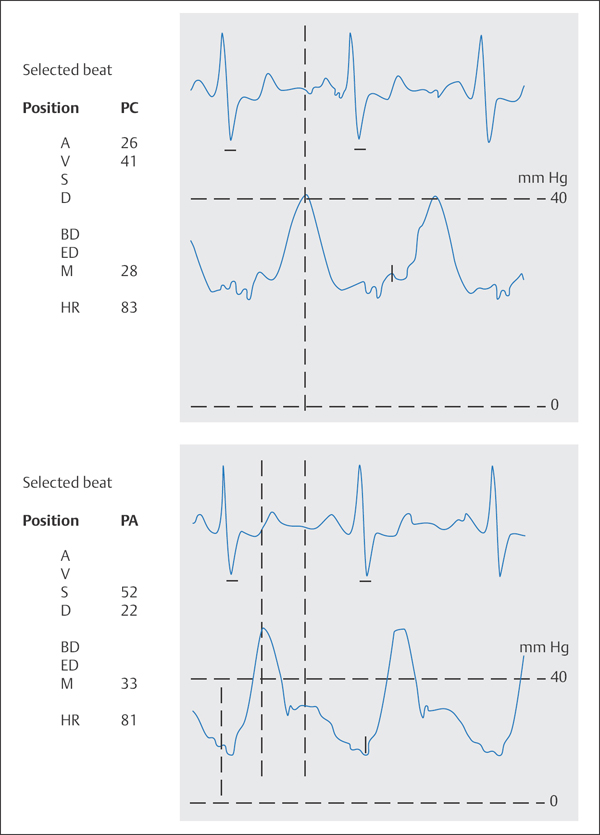
A | a-wave |
V | v-wave |
S | systolic pressure |
D | diastolic pressure |
BD | beginning of diastole |
ED | end of diastole |
M | mean pressure |
HR | heart rate |
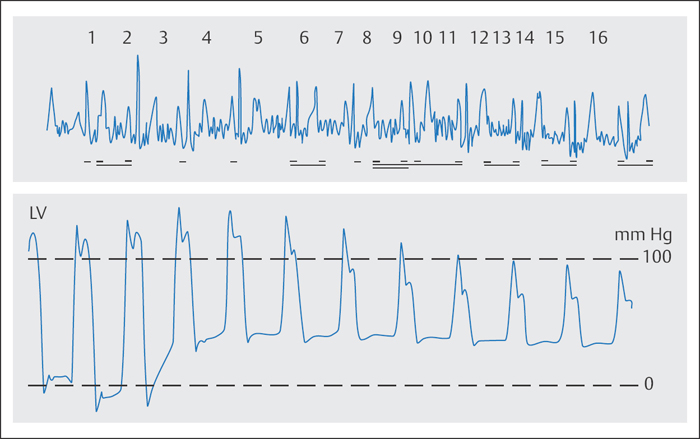
Fig. 12.4 Left ventricular pressure curve during a Valsalva maneuver (inspiration and pressing). Increase in the LVEDP to 41 mm Hg with simultaneous decrease in the systolic blood pressure by 20 mm Hg (asymptomatic patient).
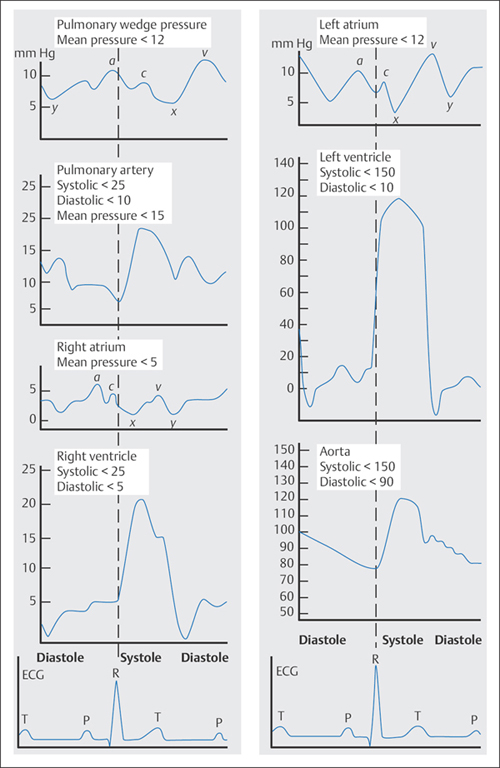
Pressure Curves
The dynamic processes during systole and diastole are represented in the recorded pressure curves from the ventricles, atria, aorta, and pulmonary artery. Interpretation of individual pathological changes in the respective pressure curves makes possible conclusions regarding the cause and severity of various myocardial, valvular, and pericardial diseases (Fig. 12.5).
 Atrial Pressure
Waveform Analysis
Pressure waveforms of the left and right atria show comparable characteristics. These are also similar to those found in the pulmonary capillary wedge pressure curve and in part in the central venous pressure curve (Fig. 12.6).
The a-wave is produced by the contraction of the atrium and is recorded after the P-wave on the ECG. Then the atrial pressure decreases due to the systolic descent of the valve plane to the mesosystolic pressure minimum, the so-called x-descent.
In the descending part of the curve a small c-wave can be recognized most of the time, which is due to the atrioventricular valve leaflets bulging at the beginning of systole. After the x-descent follows the v-wave, which develops during systole by rapid flow of venous blood into the atria with the atrioventricular valves closed and movement of the valve plane during ventricular contraction. The v-wave corresponds to the end of the T-wave on the ECG. The y-descent marks the early diastolic minimum in the atrial pressure curve, due to the rapid flow of blood into the ventricle shortly after the opening of the atrioventricular valves. After the rapid filling phase, atrial pressure increases again after the y-descent, followed by the a-wave of the next atrial contraction.
The individual pressure values in the left atrium are higher than the corresponding ones in the right atrium. In addition, the v-wave in the left atrial pressure curve is more pronounced than that for the right atrium. Consequently, the a-wave in the right atrial pressure curve is higher than the v-wave, whereas the left atrial a-and v- waves are of equal height or the v-wave is a little higher than the a-wave.
Finding the a-wave and v-wave is easiest with the ECG. The a-wave is the positive deflection of the pressure curve after the P-wave on the ECG. The average P– a interval in the atrial pressure curve is ~80 milliseconds (in the pulmonary capillary wedge curve ~160 milliseconds). The peak of the v-wave occurs after the end of the T-wave.
Normal Values
Normal values reported in the literature are quite variable. This is at least in part due to the composition of the examined subjects and to the conditions of the examination. Therefore, the values shown in Table 12.1 should be considered only as guides. Table 12.2 gives pathological changes of the atrial pressure curve and possible causes.
Table 12.1 Normal values of the atrial pressure curves
| Right atrium | Left atrium |
a-Wave | 3–9mm Hg | 4–12 mm Hg |
v-Wave | 2–6mm Hg | 5–15 mm Hg |
Mean pressure | 2–5mm Hg | 6–12 mm Hg |
Table 12.2 Pathological changes of the atrial pressure curve
Change | Causes |
Increased a-wave | – Impaired compliance of the downstream ventricle – Early ventricular failure – Mitral stenosis, tricuspid stenosis – Atrial contraction while atrioventricular valve is closed |
Missing a-wave | – Atrial fibrillation – Atrial asystole – Sham absence with very large c–v-wave, with mitral regurgitation or tricuspid regurgitation (ventricularization of the atrial pressure curve) |
Deep x-descent | – Pericardial tamponade |
Missing x-descent | – Atrial fibrillation – Regurgitation of an atrioventricular valve |
Increased v-wave | – Increased volume load (e.g., atrial septal defect) – Regurgitation of an atrioventricular valve – Left ventricular failure – Atrial fibrillation |
Deep y-descent | – Constrictive pericarditis – Restrictive cardiomyopathy – Right ventricular infarction – High cardiac output – Hypervolemia |
Flattened y-descent | – Pericardial tamponade – Stenosis of an atrioventricular valve – Tachycardia (fusion of a-wave and v-wave) |
Pulmonary Capillary Wedge Pressure
Waveform Analysis
The pulmonary capillary wedge pressure (PCW pressure) corresponds to the left atrial pressure. Due to the long fluid column consisting of pulmonary veins and capillaries, the PCW wave is damped compared with the left atrial wave and recorded with a delay of ~80 milliseconds. Due to damping, usually only the a-wave and v- wave can be well identified but not the descents. Normal values as well as pathological changes of the PCW pressure wave correspond to those of the left atrial pressure wave.
Arterial and Pulmonary Arterial Pressure
Waveform Analysis
The systemic arterial pressure curve and the pulmonary arterial pressure curve are characterized by a steep early systolic pressure rise, which begins shortly before valve opening.
The steep rise is frequently interrupted by an anacrotic notch, which coincides with the opening of the semilunar valves. In the descending part of the pressure curve the dicrotic notch indicates the closure of the aortic or pulmonary valve, followed by a dicrotic wave shoulder with subsequent diastolic pressure decrease. The arterial pressure curve characteristically changes as one goes from the aortic valve to the periphery: The steep rise is enhanced, systolic pressure increases while diastolic pressure decreases, and the mean pressure slightly decreases.
Table 12.3 Normal values for systemic arterial and pulmonary arterial pressures
| Aortic pressure | Pulmonary artery pressure |
Systolic | 100–140 mm Hg | 15–30 mm Hg |
Diastolic | 60–90 mm Hg | 5–16 mm Hg |
Mean pressure | 70–105 mm Hg | 10–22 mm Hg |
Table 12.4 Pathological changes of the pressures in the aorta and pulmonary arteries
| Aorta | Pulmonary arteries |
Increased systolic pressure | – Arterial hypertension – Aortic sclerosis – Aortic coarctation | – Pulmonary hypertension – Large left-to-right shunt – Pulmonary arterial sclerosis – Stenosis of a branch of the pulmonaryartery |
Low systolic pressure | – Hypotension – Aortic valve stenosis – Low cardiac output – Shock | – Hypovolemia – Pulmonary stenosis – Ebstein anomaly – Tricuspid valve stenosis |
Increased diastolic pressure | – Arterial hypertension | – Pulmonary hypertension – Left ventricular failure – Mitral valve stenosis |
Low diastolic pressure | – Hypotension – Aortic valve stenosis – Aortic regurgitation – Large left-to-right shunt at the level of the aorta (patent ductus arteriosus, aortopulmonary septal defect, ruptured sinus of Valsalva aneurysm) – Shock | – Hypovolemia – Pulmonary valve stenosis – Ebstein anomaly – Tricuspid valve stenosis – Pulmonary valve regurgitation |
Accelerated steep increase | – Aortic regurgitation – Hypertrophic obstructive cardiomyopathy |
|
Delayed steep increase | – Aortic valve stenosis – Aortic valve prosthesis |
|
Pronounced dicrotic notch, large dicrotic wave | – Shock – Hypovolemia |
|
Missing notch | – Severe aortic regurgitation – Severe aortic valve stenosis |
|
Pronounced anacrotic wave and notch | – Aortic valve stenosis |
|
Two-peaked aortic pressure apex | – Hypertrophic obstructive cardiomyopathy – Aortic regurgitation |
Normal Values
Normal values for systemic arterial and pulmonary arterial pressures are shown in Table 12.3; pathological changes including the most important causes are summarized in Table 12.4.
 The systolic aortic pressure is identical to the systolic pressure in the left ventricle.
 The systolic pulmonary artery pressure corresponds to the systolic pressure in the right ventricle.
 The diastolic pressure in the pulmonary artery corresponds to the mean PCW pressure.
Ventricular Pressure
Waveform Analysis
Immediately before the steep systolic increase in the ventricular pressure curve, a small atrial contraction wave (a-wave) can be seen in sinus rhythm that is correspondingly missing in atrial fibrillation. The trough of the a- wave is usually lower than the subsequent end-diastolic pressure. In early diastole ventricular pressure drops to values around or below zero, then rises steeply at the end of the rapid filling phase and with a sharp bend, characterized by a small positive wave (“overshoot”), transitions into the slow diastolic pressure rise until the beginning of the a-wave.
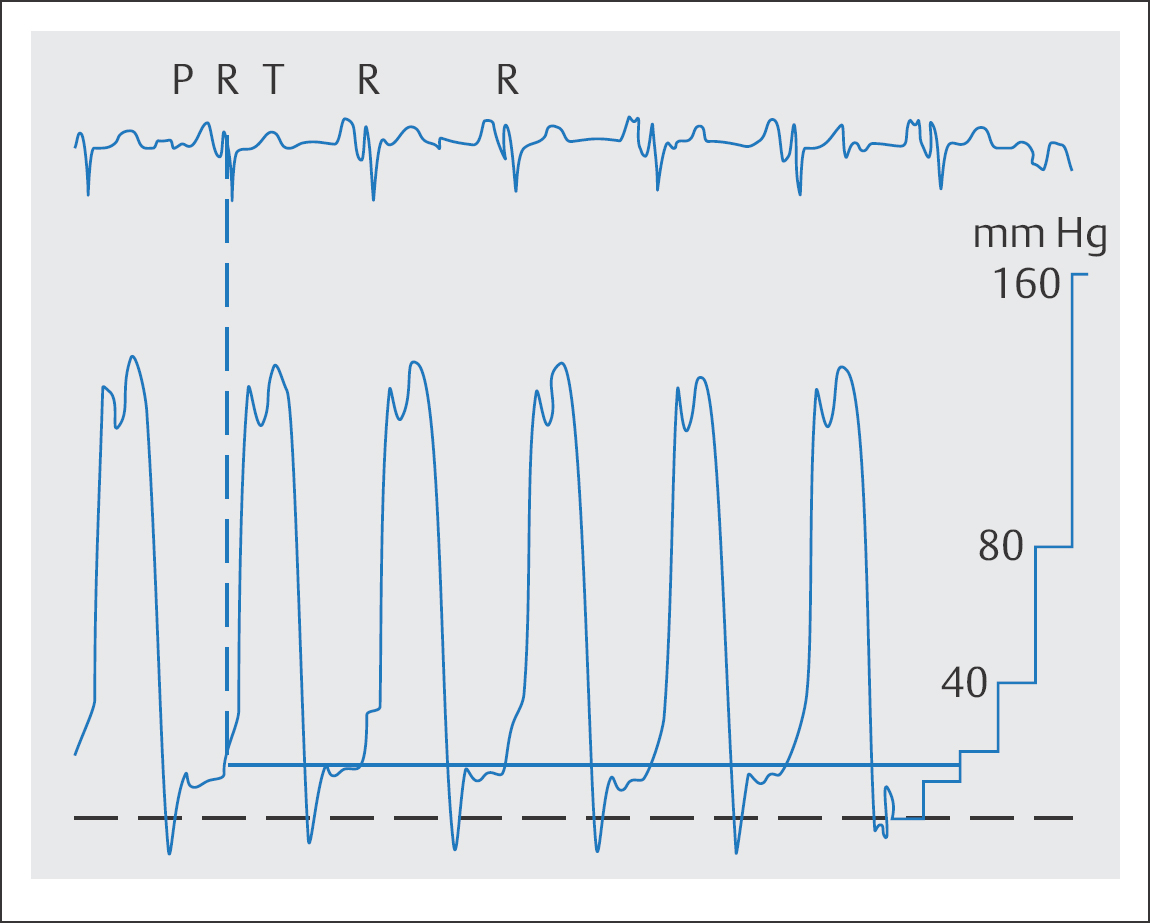
Table 12.5 Normal values of ventricular pressures
| Right ventricle | Left ventricle |
Systolic | 20–30 mm Hg | 90–140 mm Hg |
Early diastolic | 0 mm Hg | 0 mm Hg |
Late diastolic | 4–8 mm Hg | 6–12 mm Hg |
Table 12.6 Pathological changes of the ventricular pressure curves
Change | Causes |
Increased end-diastolic pressure Stay updated, free articles. Join our Telegram channel
Full access? Get Clinical Tree
 Get Clinical Tree app for offline access

|