OBJECTIVES
The student understands how central venous pressure can be used to assess circulatory status and how venous return, cardiac output, and central venous pressure are interrelated:
![]() Describes the overall arrangement of the systemic circulation and identifies the primary functional properties of each of its major components.
Describes the overall arrangement of the systemic circulation and identifies the primary functional properties of each of its major components.
![]() Defines mean circulatory filling pressure and states the primary factors that determine it.
Defines mean circulatory filling pressure and states the primary factors that determine it.
![]() Defines venous return and explains how it is distinguished from cardiac output.
Defines venous return and explains how it is distinguished from cardiac output.
![]() States the reason why cardiac output and venous return must be equal in the steady state.
States the reason why cardiac output and venous return must be equal in the steady state.
![]() Lists the factors that control venous return.
Lists the factors that control venous return.
![]() Describes the relationship between central venous pressure and venous return and draws the normal venous return curve.
Describes the relationship between central venous pressure and venous return and draws the normal venous return curve.
![]() Defines peripheral venous pressure.
Defines peripheral venous pressure.
![]() Lists the factors that determine peripheral venous pressure.
Lists the factors that determine peripheral venous pressure.
![]() Predicts the shifts in the venous return curve that occur with altered blood volume and altered venous tone.
Predicts the shifts in the venous return curve that occur with altered blood volume and altered venous tone.
![]() Describes how the output of the left heart pump is matched to that of the right heart pump.
Describes how the output of the left heart pump is matched to that of the right heart pump.
![]() Draws the normal venous return and cardiac output curves on a graph and describes the significance of the point of curve intersection.
Draws the normal venous return and cardiac output curves on a graph and describes the significance of the point of curve intersection.
![]() Predicts how normal venous return, cardiac output, and central venous pressure will be altered with any given combination of changes in cardiac sympathetic tone, peripheral venous sympathetic tone, or circulating blood volume.
Predicts how normal venous return, cardiac output, and central venous pressure will be altered with any given combination of changes in cardiac sympathetic tone, peripheral venous sympathetic tone, or circulating blood volume.
![]() Identifies possible conditions that result in abnormally high or low central venous pressure.
Identifies possible conditions that result in abnormally high or low central venous pressure.
In previous chapters, we have primarily described how individual components in the cardiovascular system work. That is, we have tried to establish their fundamental individual “rules of operation.” (For example, a basic rule for the heart is CO = SV × HR, and a basic rule for any vessel is ![]() ) Such individual rules must be obeyed in all situations including those that exist within the intact cardiovascular system. However, in the intact cardiovascular system, the individual components are interconnected. An abnormal operation of any one component necessarily causes “ripple-effect” changes throughout the entire system that may seem abnormal. Such interactions are the subject of this chapter. They are of special importance to the clinician who must be able to distinguish between primary abnormalities and secondary consequences.
) Such individual rules must be obeyed in all situations including those that exist within the intact cardiovascular system. However, in the intact cardiovascular system, the individual components are interconnected. An abnormal operation of any one component necessarily causes “ripple-effect” changes throughout the entire system that may seem abnormal. Such interactions are the subject of this chapter. They are of special importance to the clinician who must be able to distinguish between primary abnormalities and secondary consequences.
KEY SYSTEM COMPONENTS
As illustrated in Figure 8–1, the cardiovascular system is a closed hydraulic circuit that includes the heart, arteries, arterioles, capillaries, and veins.1 The venous side of this system is often conceptually separated into two different compartments: (1) a large and diverse peripheral section (the peripheral venous compartment) and (2) a smaller intrathoracic section that includes the vena cavae and the right atrium (the central venous compartment). Each of the segments of this circuit has a distinctly different role to play in the overall operation of the system because of inherent differences in anatomical volume, resistance to flow, and compliance that are summarized in Table 8–1.
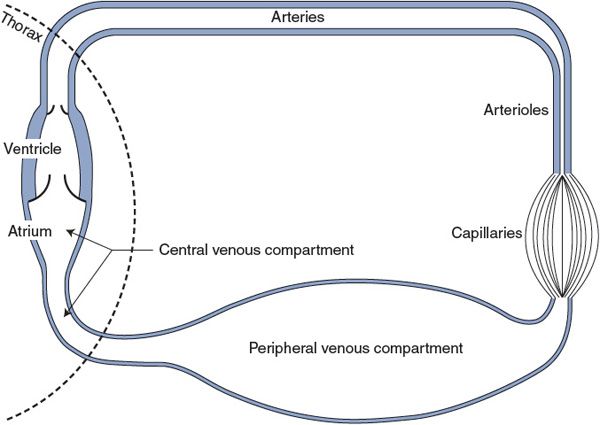
Figure 8–1. Major functionally distinct components of the systemic cardiovascular circuit.
Table 8–1. Typical Properties of the Major Components of the Systemic Cardiovascular Circuit*
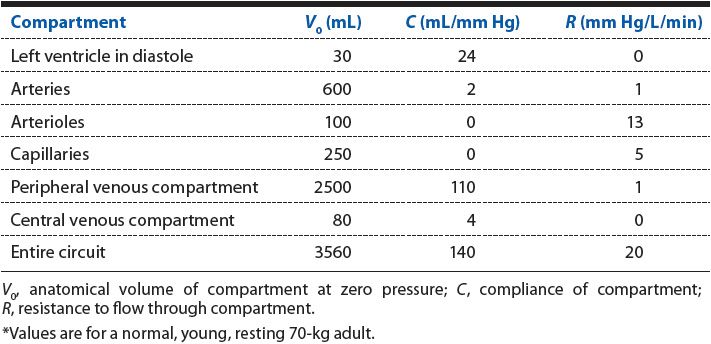
Note especially the surprisingly high ventricular diastolic compliance of 24 mL/mm Hg in Table 8–1. This value indicates how exquisitely sensitive the ventricular end-diastolic volume (and therefore stroke volume and cardiac output) is to small changes in cardiac filling pressure (ie, central venous pressure). In all physiological and pathological situations, cardiac filling pressure is a crucial factor that determines how well the cardiovascular system will be operating.
Mean Circulatory Filling Pressure
![]() Imagine the heart arrested in diastole with no flow around the circuit shown in Figure 8–1. It will take a certain amount of blood just to fill the anatomical space contained by the systemic system without stretching any of its walls or developing any internal pressure. This amount is 3.56 L, as indicated by the total systemic circuit volume (V0) in Table 8–1. Normally, however, the systemic circuit contains approximately 4.5 L of blood and is thus somewhat inflated. From the total systemic circuit compliance (C) given in Table 8–1, one can see that an extra 1000 mL of blood would result in an internal pressure of approximately 7 mm Hg (ie, 1000 mL/140 mL/mm Hg). This theoretical pressure is called the mean circulatory filling pressure and is the actual pressure that would exist throughout the system in the absence of flow. The two major variables that affect mean circulatory filling pressure are the circulating blood volume and the state of the peripheral venous vessel tone. In the latter case, look at Figure 8–1 and imagine how constriction of the vessels of the large venous compartment (increasing venous tone) will significantly increase pressure throughout the system. In contrast, squeezing on arterioles (increasing arteriolar tone) will have a negligible effect on mean circulatory filling pressure because arterioles contain so little blood in any state. The other major components of the system (arteries and capillaries) essentially do not actively change their volume.
Imagine the heart arrested in diastole with no flow around the circuit shown in Figure 8–1. It will take a certain amount of blood just to fill the anatomical space contained by the systemic system without stretching any of its walls or developing any internal pressure. This amount is 3.56 L, as indicated by the total systemic circuit volume (V0) in Table 8–1. Normally, however, the systemic circuit contains approximately 4.5 L of blood and is thus somewhat inflated. From the total systemic circuit compliance (C) given in Table 8–1, one can see that an extra 1000 mL of blood would result in an internal pressure of approximately 7 mm Hg (ie, 1000 mL/140 mL/mm Hg). This theoretical pressure is called the mean circulatory filling pressure and is the actual pressure that would exist throughout the system in the absence of flow. The two major variables that affect mean circulatory filling pressure are the circulating blood volume and the state of the peripheral venous vessel tone. In the latter case, look at Figure 8–1 and imagine how constriction of the vessels of the large venous compartment (increasing venous tone) will significantly increase pressure throughout the system. In contrast, squeezing on arterioles (increasing arteriolar tone) will have a negligible effect on mean circulatory filling pressure because arterioles contain so little blood in any state. The other major components of the system (arteries and capillaries) essentially do not actively change their volume.
Flow-Induced Distribution of Blood Volume and Pressure
The presence of flow around the circuit does not change the total volume of blood in the system or the mean circulatory filling pressure. The flow caused by cardiac pumping action does, however, tend to shift some of the blood volume from the venous side of the circuit to the arterial side. This causes pressures on the arterial side to rise above the mean circulatory pressure, whereas pressures on the venous side fall below it. Because veins are approximately 50 times more compliant than arteries (Table 8–1), the flow-induced decrease in venous pressure is only approximately 1/50th as large as the accompanying increase in arterial pressure. Thus, flow or no flow, pressure in the peripheral venous compartment is normally quite close to the mean circulatory filling pressure.
CENTRAL VENOUS PRESSURE: AN INDICATOR OF CIRCULATORY STATUS
The cardiovascular system must adjust its operation continually to meet changing metabolic demands of the body. Because the cardiovascular system is a closed hydraulic loop, adjustments in any one part of the circuit will have pressure, flow, and volume effects throughout the circuit. Because of the critical influence of cardiac filling on cardiovascular function, the remainder of this chapter focuses on the factors that determine the pressure in the central venous compartment. In addition, the way in which measures of central venous pressure can provide clinically useful information about the state of the circulatory system is discussed.
The central venous compartment corresponds roughly to the volume enclosed by the right atrium and the great veins in the thorax. Blood leaves the central venous compartment by entering the right ventricle at a rate that is equal to the cardiac output. Venous return, in contrast, is by definition the rate at which blood returns to the thorax from the peripheral vascular beds and is thus the rate at which blood enters the central venous compartment. The important distinction between venous return to the central venous compartment and cardiac output from the central venous compartment is illustrated in Figure 8–2.
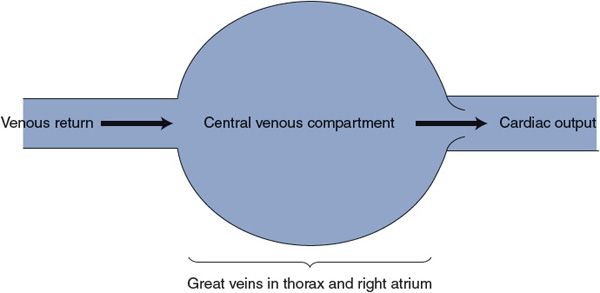
Figure 8–2. Distinction between cardiac output and venous return.
In any stable situation, venous return must equal cardiac output or blood would gradually accumulate in either the central venous compartment or the peripheral vasculature. However, there are often temporary differences between cardiac output and venous return. Whenever such differences exist, the volume of the central venous compartment must be changing. Because the central venous compartment is enclosed by elastic tissues, any change in central venous volume produces a corresponding change in central venous pressure.
As discussed in Chapter 3, the central venous pressure (ie, cardiac filling pressure) has an extremely important positive influence on stroke volume, and therefore, cardiac output (Starling’s law of the heart). As argued later, central venous pressure has an equally important negative effect on venous return. Thus, central venous pressure is always automatically driven to a value that makes cardiac output equal to venous return. The factors that determine central venous pressure in any given situation are discussed in the following section.
Influence of Central Venous Pressure on Venous Return
The important factors involved in the process of venous return can be summarized as shown in Figure 8–3A. Basically, venous return is blood flow from the peripheral venous compartment to the central venous compartment through converging vessels. Anatomically the peripheral venous compartment is scattered throughout the systemic organs, but functionally it can be viewed as a single vascular space that has a particular pressure (PPV) at any instant of time. The normal operating pressure in the peripheral venous compartment is usually very close to mean circulatory filling pressure. Moreover, the same factors that influence mean circulatory filling pressure have essentially equal influences on peripheral venous pressure. Thus “peripheral venous pressure” can be viewed as essentially equivalent to “mean circulatory filling pressure.” The blood flow rate between the peripheral venous compartment and the central venous compartment is governed by the basic flow equation (![]() ), where ΔP is the pressure drop between the peripheral and central venous compartments and R is the small resistance associated with the peripheral veins. In the example in Figure 8–3, peripheral venous pressure is assumed to be 7 mm Hg. Thus, there will be no venous return when the central venous pressure (PCV) is also 7 mm Hg, as shown in Figure 8–3B.
), where ΔP is the pressure drop between the peripheral and central venous compartments and R is the small resistance associated with the peripheral veins. In the example in Figure 8–3, peripheral venous pressure is assumed to be 7 mm Hg. Thus, there will be no venous return when the central venous pressure (PCV) is also 7 mm Hg, as shown in Figure 8–3B.
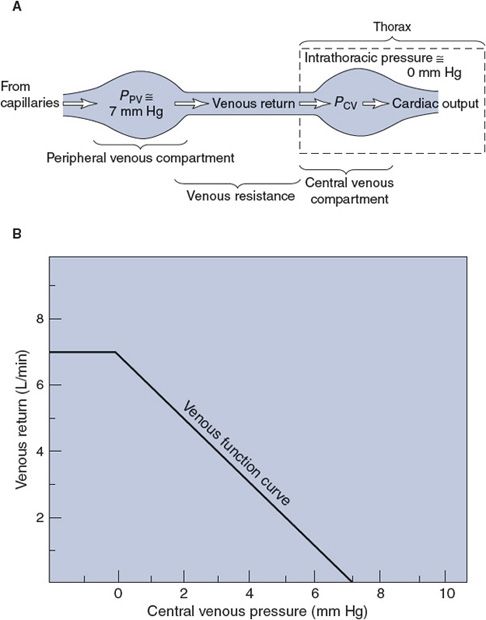
Figure 8–3. (A) Factors influencing venous return and (B) the venous function curve.
![]() If the peripheral venous pressure remains at 7 mm Hg, decreasing central venous pressure will increase the pressure drop across the venous resistance and consequently cause an elevation in venous return. This relationship is summarized by the venous function curve, which shows how venous return increases as central venous pressure drops.2 If central venous pressure reaches very low values and falls below the intrathoracic pressure, the veins in the thorax are compressed, which therefore tends to limit venous return. In the example in Figure 8–3, intrathoracic pressure is taken to be 0 mm Hg and the flat portion of the venous function curve indicates that lowering central venous pressure below 0 mm Hg produces no additional increase in venous return.
If the peripheral venous pressure remains at 7 mm Hg, decreasing central venous pressure will increase the pressure drop across the venous resistance and consequently cause an elevation in venous return. This relationship is summarized by the venous function curve, which shows how venous return increases as central venous pressure drops.2 If central venous pressure reaches very low values and falls below the intrathoracic pressure, the veins in the thorax are compressed, which therefore tends to limit venous return. In the example in Figure 8–3, intrathoracic pressure is taken to be 0 mm Hg and the flat portion of the venous function curve indicates that lowering central venous pressure below 0 mm Hg produces no additional increase in venous return.
Just as a cardiac function curve shows how central venous pressure influences cardiac output, a venous function curve shows how central venous pressure influences venous return.3
Influence of Peripheral Venous Pressure on Venous Return
As can be deduced from Figure 8–3A, it is the pressure difference between the peripheral and central venous compartments that determines venous return. Therefore, an increase in peripheral venous pressure can be just as effective in increasing venous return as a drop in central venous pressure.
![]() The two ways in which peripheral venous pressure can change were discussed in Chapter 6. First, because veins are elastic vessels, changes in the volume of blood contained within the peripheral veins alter the peripheral venous pressure. Moreover, because the veins are much more compliant than any other vascular segment, changes in circulating blood volume produce larger changes in the volume of blood in the veins than in any other vascular segment. For example, blood loss by hemorrhage or loss of body fluids through severe sweating, vomiting, or diarrhea will decrease circulating blood volume and significantly reduce the volume of blood contained in the veins and thus decrease the peripheral venous pressure. Conversely, transfusion, fluid retention by the kidney, or transcapillary fluid reabsorption will increase circulating blood volume and venous blood volume. Whenever circulating blood volume increases, so does peripheral venous pressure.
The two ways in which peripheral venous pressure can change were discussed in Chapter 6. First, because veins are elastic vessels, changes in the volume of blood contained within the peripheral veins alter the peripheral venous pressure. Moreover, because the veins are much more compliant than any other vascular segment, changes in circulating blood volume produce larger changes in the volume of blood in the veins than in any other vascular segment. For example, blood loss by hemorrhage or loss of body fluids through severe sweating, vomiting, or diarrhea will decrease circulating blood volume and significantly reduce the volume of blood contained in the veins and thus decrease the peripheral venous pressure. Conversely, transfusion, fluid retention by the kidney, or transcapillary fluid reabsorption will increase circulating blood volume and venous blood volume. Whenever circulating blood volume increases, so does peripheral venous pressure.
![]() Recall from Chapter 7 that the second way that peripheral venous pressure can be altered is through changes in venous tone produced by increasing or decreasing the activity of sympathetic vasoconstrictor nerves supplying the venous smooth muscle. Peripheral venous pressure increases whenever the activity of sympathetic vasoconstrictor fibers to veins increases. In addition, an increase in any force compressing veins from the outside has the same effect on the pressure inside veins as an increase in venous tone. Thus, such things as muscle exercise and wearing elastic stockings tend to elevate peripheral venous pressure.
Recall from Chapter 7 that the second way that peripheral venous pressure can be altered is through changes in venous tone produced by increasing or decreasing the activity of sympathetic vasoconstrictor nerves supplying the venous smooth muscle. Peripheral venous pressure increases whenever the activity of sympathetic vasoconstrictor fibers to veins increases. In addition, an increase in any force compressing veins from the outside has the same effect on the pressure inside veins as an increase in venous tone. Thus, such things as muscle exercise and wearing elastic stockings tend to elevate peripheral venous pressure.
Whenever peripheral venous pressure is altered, the relationship between central venous pressure and venous return is also altered. For example, whenever peripheral venous pressure is elevated by increase in blood volume or by sympathetic stimulation, the venous function curve shifts upward and to the right (Figure 8–4). This phenomenon can be most easily understood by focusing first on the central venous pressure at which there will be no venous return. If peripheral venous pressure is 7 mm Hg, then venous return will be 0 L/min when central venous pressure is 7 mm Hg. If peripheral venous pressure is increased to 10 mm Hg, then considerable venous return will occur when central venous pressure is 7 mm Hg, and venous return will stop only when central venous pressure is raised to 10 mm Hg. Thus, increasing peripheral venous pressure shifts the whole venous function curve upward and to the right. By similar logic, decreased peripheral venous pressure caused by blood loss or decreased sympathetic vasoconstriction of peripheral veins shifts the venous function curve downward and to the left (Figure 8–4).
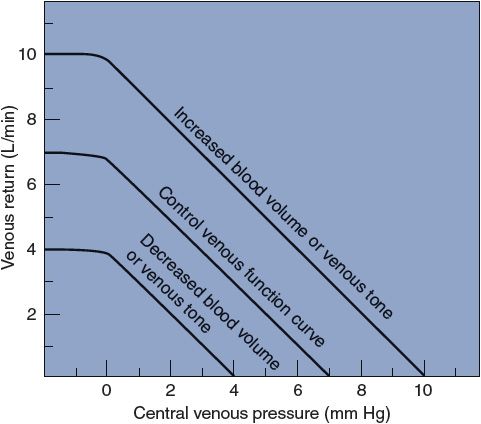
Figure 8–4. Effect of changes in blood volume and venous tone on venous function curves.
Determination of Cardiac Output and Venous Return by Central Venous Pressure
The significance of the fact that central venous pressure simultaneously affects both cardiac output and venous return can be best seen by plotting the cardiac function curve and the venous function curve on the same graph, as shown in Figure 8–5.
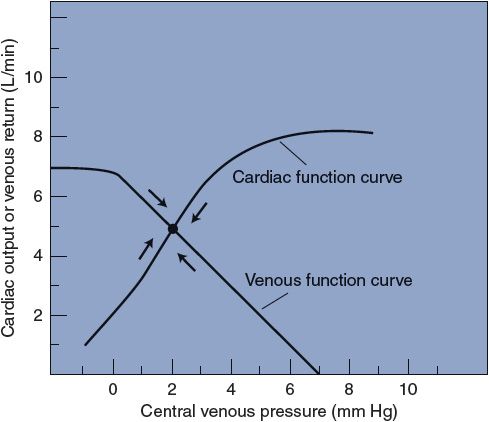
Figure 8–5. Interaction of cardiac output and venous return through central venous pressure.
Central venous pressure, as defined earlier, is the filling pressure of the right heart. Strictly speaking, this pressure directly affects only the stroke volume and output of the right heart pump. In most contexts, however, “cardiac output” implies the output of the left heart pump. How is it then, as we have previously implied, that central venous pressure (the filling pressure of the right side of the heart) profoundly affects the output of the left side of the heart? The short answer is that in the steady state, the right and left sides of the heart have equal outputs. (Because the right and left sides of the heart always beat with identical rates, this implies that their stroke volumes must be equal in the steady state.) The proper answer is that changes in central venous pressure automatically cause essentially parallel changes in the filling pressure of the left side of the heart (ie, in left atrial pressure). Consider, for example, the following sequence of consequences that a small step increase in central venous pressure has on a heart that previously was in a steady state:
1. Increased central venous pressure.
2. Increased right ventricular stroke volume via Starling’s law of the heart.
3. Increased output of the right side of the heart.
4. The right side of the heart output temporarily exceeds that of the left side of the heart.
5. As long as this imbalance exists, blood accumulates in the pulmonary vasculature and raises pulmonary venous and left atrial pressures.
6. Increased left atrial pressure increases left ventricular stroke volume via Starling’s law.
7. Very quickly, a new steady state will be reached when left atrial pressure has risen sufficiently to make left ventricular stroke volume exactly equal to the increased right ventricular stroke volume.
The major conclusion here is that left atrial pressure will automatically change in the correct direction to match left ventricular stroke volume to the current right ventricular stroke volume. Consequently, it is usually an acceptable simplification to say that central venous pressure affects cardiac output as if the heart consisted only of a single pump.
Note that in Figure 8–5, cardiac output and venous return are equal (at 5 L/min) only when the central venous pressure is 2 mm Hg. If central venous pressure were to decrease to 0 mm Hg for any reason, cardiac output would fall (to 2 L/min) and venous return would increase (to 7 L/min). With a venous return of 7 L/min and a cardiac output of 2 L/min, the volume of the central venous compartment would necessarily increase and this would produce a progressively increasing central venous pressure. In this manner, central venous pressure would return to the original level (2 mm Hg) in a very short time. Moreover, if central venous pressure were to increase from 2 to 4 mm Hg for any reason, venous return would decrease (to 3 L/min) and cardiac output would increase (to 7 L/min). This would quickly reduce the volume of blood in the central venous pool, and the central venous pressure would soon fall back to the original level. The cardiovascular system automatically adjusts to operate at the point where the cardiac and venous function curves intersect.
![]() Central venous pressure is always inherently driven to the value that makes cardiac output and venous return equal. Cardiac output and venous return always stabilize at the level where the cardiac function and venous function curves intersect.
Central venous pressure is always inherently driven to the value that makes cardiac output and venous return equal. Cardiac output and venous return always stabilize at the level where the cardiac function and venous function curves intersect.
To fulfill its homeostatic role in the body, the cardiovascular system must be able to alter its cardiac output. Recall from Chapter 3 that cardiac output is affected by more than just cardiac filling pressure and that at any moment the heart may be operating on any one of a number of cardiac function curves, depending on the existing level of cardiac sympathetic tone. The family of possible cardiac function curves may be plotted along with the family of possible venous function curves, as shown in Figure 8–6. At a particular moment, the existing influences on the heart dictate the particular cardiac function curve on which it is operating, and similarly, the existing influences on peripheral venous pressure dictate the particular venous function curve that applies. Thus, the influences on the heart and on the peripheral vasculature determine where the cardiac and venous function curves intersect and thus what the central venous pressure and cardiac output (and venous return) are in the steady state. In the intact cardiovascular system, cardiac output can rise only when the point of intersection of the cardiac and venous function curves is raised. All changes in cardiac output are caused by either a shift in the cardiac function curve, a shift in the venous function curve, or both.
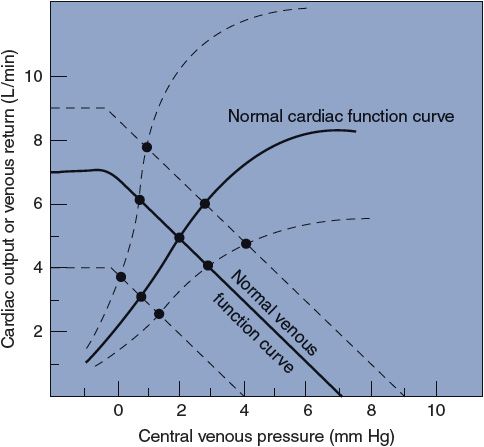
Figure 8–6. Families of cardiac function and venous function curves. Intersection points indicate equilibrium values for cardiac output, venous return, and central venous pressure under various conditions.
The cardiac function and venous function curves are useful for understanding the complex interactions that occur in the intact cardiovascular system. With the help of Figure 8–7, let us consider, for example, what happens to the cardiovascular system when there is a significant loss of blood (hemorrhage). Assume that before the hemorrhage, sympathetic activity to the heart and peripheral vessels is normal, as is the blood volume. Therefore, cardiac output is related to central venous pressure, as indicated by the “normal” cardiac function curve in Figure 8–7. In addition, venous return is determined by central venous pressure, as indicated by the “normal” venous function curve shown. The normal cardiac and venous function curves intersect at point A, so cardiac output is 5 L/min and central venous pressure is 2 mm Hg in the normal state. When blood volume decreases because of hemorrhage, the peripheral venous pressure falls and the venous function curve is shifted to the left. In the absence of any cardiovascular responses, the cardiovascular system must switch its operation to point B because this is now the point at which the cardiac function curve and the new venous function curve intersect. This automatically occurs because, at the moment of blood loss, the venous function curve is shifted to the left and venous return falls below cardiac output at the central venous pressure of 2 mm Hg. This is what leads to the fall in the central venous compartment’s volume and pressure that causes the shift in operation from point A to point B. Note by comparing points A and B in Figure 8–7 that blood loss itself lowers cardiac output and central venous pressure by shifting the venous function curve. In going from point A to point B, cardiac output falls solely because of decreased filling pressure and Starling’s law of the heart.
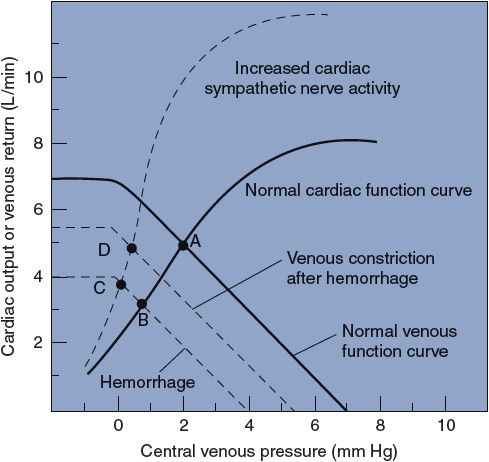
Figure 8–7. Cardiovascular adjustments to hemorrhage.
Subnormal cardiac output evokes a number of cardiovascular compensatory mechanisms to bring cardiac output back to more normal levels. One of these compensatory mechanisms is an increase in the activity of cardiac sympathetic nerves, which, as discussed in Chapter 3, shifts the heart’s operation to a cardiac function curve that is higher than normal. The effect of increasing cardiac sympathetic activity is illustrated by a shift in cardiovascular operation from point B to point C. In itself, the increased cardiac sympathetic nerve activity increases cardiac output (from 3 to 4 L/min) but causes a further decrease in central venous pressure. This drop in central venous pressure occurs because points B and C lie on the same venous function curve. Cardiac sympathetic nerves do not affect the venous function curve.4
An additional compensatory mechanism evoked by blood loss is increased activity of the sympathetic nerves leading to veins. Recall that this raises peripheral venous pressure and causes a rightward shift of the venous function curve. Therefore, increased sympathetic activity to veins tends to shift the venous function curve, originally lowered by blood loss, back toward normal. As a consequence of the increased peripheral venous tone and the shift to a more normal venous function curve, the cardiovascular operation shifts from point C to point D in Figure 8–7. Thus, peripheral venous constriction increases cardiac output by raising central venous pressure and moving the heart’s operation upward along a fixed cardiac function curve. It must be pointed out that separating the response to hemorrhage into distinct, progressive steps (ie, A to B to C to D) is only a conceptualization for appreciating the individual effects of the different processes involved. In reality, the reflex venous and cardiac responses occur simultaneously and so quickly that they will easily keep up with the blood loss as it occurs. Thus, the actual course of a patient’s net response to hemorrhage would follow nearly a straight line from point A to point D.
In summary, point D illustrates that near-normal cardiac output can be sustained in the face of blood loss by the combined effect of peripheral and cardiac adjustments. Hemorrhage is only one of an almost infinite variety of disturbances to the cardiovascular system. Plots such as those shown in Figure 8–7 are very useful for understanding the many disturbances to the cardiovascular system and the ways in which they may be compensated.
Clinical Implications of Abnormal Central Venous Pressures
![]() Although, in the clinical situation, there is no way to actually determine the position of either cardiac function or venous function curves, important information about the patient’s circulatory status can be obtained from measures of central venous pressure. From what has been presented in this chapter, it is possible to conclude that a patient with abnormally high central venous pressure must have a depressed cardiac function curve, a right-shifted venous function curve, or both. As will be discussed in Chapter 11, very high central venous pressures are a hallmark of patients with congestive heart failure because they have the combination of dysfunctional heart muscle (depressed cardiac function curve) and excessive fluid volume (right-shifted venous function curve).5 Abnormally low central venous pressures, on the other hand, could theoretically be caused by either an elevated cardiac function curve or a left-shifted venous function curve. The clinical reality is that abnormally low central venous pressures are almost always the result of a left shift of the venous function curve, caused by either low blood volume or lack of venous tone.
Although, in the clinical situation, there is no way to actually determine the position of either cardiac function or venous function curves, important information about the patient’s circulatory status can be obtained from measures of central venous pressure. From what has been presented in this chapter, it is possible to conclude that a patient with abnormally high central venous pressure must have a depressed cardiac function curve, a right-shifted venous function curve, or both. As will be discussed in Chapter 11, very high central venous pressures are a hallmark of patients with congestive heart failure because they have the combination of dysfunctional heart muscle (depressed cardiac function curve) and excessive fluid volume (right-shifted venous function curve).5 Abnormally low central venous pressures, on the other hand, could theoretically be caused by either an elevated cardiac function curve or a left-shifted venous function curve. The clinical reality is that abnormally low central venous pressures are almost always the result of a left shift of the venous function curve, caused by either low blood volume or lack of venous tone.
![]() Rough estimates of a patient’s central venous pressure can be obtained quite easily by observing the external jugular veins. Because the force of gravity tends to keep veins in the head and neck collapsed when an individual is in an upright position, there should be no distention (or retrograde pulsations from atrial contractions) in these neck veins. Conversely, when an individual is fully recumbent, the neck veins should be full and pulsations should be easily detected. If a healthy individual is placed in a semirecumbent position so that the external jugular veins are positioned at ~7 cm above the right atrium, the point between the collapsed venous segment and the filled segment can usually be visualized.6 Abnormally high central venous pressures will be associated with neck vein distention at a higher level (perhaps even when the patient is upright).
Rough estimates of a patient’s central venous pressure can be obtained quite easily by observing the external jugular veins. Because the force of gravity tends to keep veins in the head and neck collapsed when an individual is in an upright position, there should be no distention (or retrograde pulsations from atrial contractions) in these neck veins. Conversely, when an individual is fully recumbent, the neck veins should be full and pulsations should be easily detected. If a healthy individual is placed in a semirecumbent position so that the external jugular veins are positioned at ~7 cm above the right atrium, the point between the collapsed venous segment and the filled segment can usually be visualized.6 Abnormally high central venous pressures will be associated with neck vein distention at a higher level (perhaps even when the patient is upright).
Because of its diagnostic value in critical care situations, central venous pressure is often monitored continuously via a catheter that is inserted in a peripheral vein and advanced centrally until its tip is in the central venous compartment (ie, near or in the right atrium). In some situations, it is desirable to assess left atrial pressure, which is the filling pressure for the left side of the heart. This is commonly done with a specialized flow-directed venous catheter that uses a small inflatable balloon at its tip to drag it with the blood flow through the right ventricle and pulmonic valve into the pulmonary artery. The balloon is then deflated and the cannula is advanced further until it wedges into a terminal branch of the pulmonary vasculature. The pulmonary wedge pressure recorded at this junction provides a useful estimate of left atrial pressure.
PERSPECTIVES
The junction of the venous side of the circulation with the heart is a critical site of functional integration between the heart and the vasculature. As previously stated, flow through the circulation depends upon the pressure difference across the circulation and the vascular resistance. A primary determinant of the arterial pressure is the cardiac output. The two determinants of the cardiac output are the heart rate and the stroke volume. A major determinant of the stroke volume is ventricular filling, which, as described in this chapter, is a function of the central venous pressure. Thus, we come back to strongly emphasize the original statement in this chapter that a change in any one variable will have ripple effects throughout the system and the alert clinician will have to discern the primary disturbances from secondary consequences.
Stay updated, free articles. Join our Telegram channel

Full access? Get Clinical Tree


