Heart
Cardiac disease is one of the leading causes of morbidity and mortality in the developed world. Unlike other organs of the body, the heart is constantly subject to both cardiac and respiratory motion within the thoracic cavity. Additionally, there is a constant flow of blood through the cardiac structures that presents unique technical and diagnostic challenges for imaging. Depending on the disease process, cardiac imaging evaluation has focused on the use of echocardiography, nuclear cardiac imaging techniques, and invasive coronary angiography. Technologic advances in magnetic resonance (MR) imaging and computed tomography (CT) have led to an explosion of interest in these new approaches to image the heart and vascular structures. We can now visualize in great detail cardiac structure, motion, and function important for clinical diagnosis, treatment, and management of cardiac disease.
Imaging Techniques
Computed Tomography
With the advent of multidetector scanners in 1998, cardiac CT imaging has become one of the fastest growing areas of major interest. Prior to multidetector scanners, electron beam computed tomography (EBCT) had been in use for cross-sectional CT imaging of the heart. With its high temporal resolution of 50 to 100 ms, coronary artery imaging, including calcium scoring and functional assessment of the heart, has been its focus. With the technical evolution of multidetector CT scanners (MDCT) as well as their widespread availability, however, much of the focus in recent years has shifted to the replacement of EBCT with MDCT for cardiac CT imaging.
Important aspects of cardiac CT imaging include the following:
High temporal resolution to minimize cardiac motion artifacts
High spatial resolution for visualization of small cardiac structures
Fast volume coverage during one breath-hold to minimize respiratory motion artifacts
Electrocardiogram (ECG) synchronization of data acquisition
Isotropic voxels to allow for oblique reconstructions without loss of resolution
Optimization of image quality is mainly related to the elimination of artifacts related to cardiac and respiratory motion. However, variables including collimation, pitch, breath-hold period, field of view, reconstruction interval, rate and volume of intravenous contrast administration, reconstruction algorithm, and radiation dose need to be addressed. Unfortunately, no single set of optimal scan parameters currently suffices for all cardiac CT applications on all CT systems. Instead, CT techniques often reflect a combination of personal or institutional preferences coupled with individual manufacturer capabilities. Table 1-1 lists general MDCT guidelines used at New York University Medical Center for cardiac CT imaging.
Table 1-1 General Multidetector Scanner Computed Tomography Cardiac Protocol for 16- to 64-Slice Scanners | ||||||||||||||||||||||||||||||||||||||||
|---|---|---|---|---|---|---|---|---|---|---|---|---|---|---|---|---|---|---|---|---|---|---|---|---|---|---|---|---|---|---|---|---|---|---|---|---|---|---|---|---|
| ||||||||||||||||||||||||||||||||||||||||
Technical Design
The gantry geometry of all MDCT generations is essentially identical with only minor variations. As the number of slices has steadily increased from 4 to 16 to 64, major changes have occurred with detector geometry and the necessary post-processing algorithms. Special three-dimensional (3D) backprojection algorithms are needed to correct for artifacts that arise from the cone beam geometry that results from the oblique x-ray projections of thin collimated slices generated from the gantry (1). New MDCT scanners with up to 64 slices allow for either 64 parallel slices based on widened detector arrays or for overlapping projections based on flying focal spots along the z-axis, which allows for an improvement of spatial resolution and for reduction of cone beam geometry image artifacts (2). Thin-slice collimations (0.5 to 0.625 mm) with reconstructed slice thickness of 0.4 to 0.7 mm allow for near isotropic voxels, which are important
for oblique reconstructions without loss of spatial resolution. Gantry speed rotations of 330 to 420 ms per 360 degrees allow for high temporal resolution in the range of 165 to 190 ms, and new dual-source technology will allow for further improvement in temporal resolution down to 83 ms, which is important for functional assessment of the heart as well as for improving image quality for patients with fast heart rates (HRs). ECG dose modulation schemes can further reduce the radiation dose received during image acquisition by lowering the tube current during acquisition of nondesired phases.
for oblique reconstructions without loss of spatial resolution. Gantry speed rotations of 330 to 420 ms per 360 degrees allow for high temporal resolution in the range of 165 to 190 ms, and new dual-source technology will allow for further improvement in temporal resolution down to 83 ms, which is important for functional assessment of the heart as well as for improving image quality for patients with fast heart rates (HRs). ECG dose modulation schemes can further reduce the radiation dose received during image acquisition by lowering the tube current during acquisition of nondesired phases.
Electrocardiogram Referencing
The rapid, constant motion of the heart is a source of significant motion artifact on conventional CT imaging. Because cardiac motion varies throughout the cardiac cycle, usually in a predictable manner, synchronization of data acquisition to the cardiac cycle allows for combination of data acquired from consecutive gantry rotations in volumetric datasets with minimal blurring artifact related to cardiac motion.
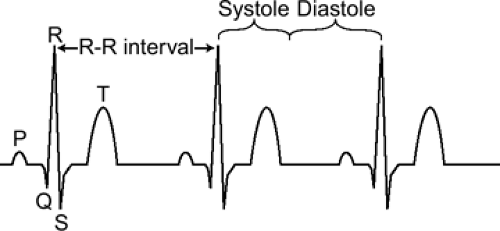
Typically, synchronization is based on the ECG signal (Fig. 1-1). The time between two consecutive heartbeats is defined by the RR interval (the interval between consecutive R waves of the ECG, 1,000 ms for a HR of 60 beats per minute). Depending on the acquisition mode, the RR interval of the ECG signal is used to either trigger data acquisition or to retrospectively gate the acquisition.
With prospective triggering, data acquisition is triggered to the ECG R peak after a preselected delay within the following cardiac cycle at a stable table position. After table movement, data are again sampled based on the next available R trigger (Fig. 1-2). This type of data acquisition is similar to the step and shoot mode. With retrospective ECG gating, a conventional spiral dataset is acquired with simultaneous tracing and recording of the patient’s ECG. Sub-sequent merging of the image and ECG data allows for ECG-related image reconstruction after scanning (Fig. 1-3). In contrast to other CT spiral acquisitions, cardiac algorithms usually require a substantially reduced pitch factor (0.2 to 0.3) to allow image reconstruction at any time point of the cardiac cycle. A comparison of these two acquisition techniques is shown in Table 1-2.
Table 1-2 Basic Advantages and Disadvantages of Data Acquisition Schemes | |||||||||||||||||||||||||
|---|---|---|---|---|---|---|---|---|---|---|---|---|---|---|---|---|---|---|---|---|---|---|---|---|---|
|
One of the major benefits of retrospectively ECG-gated data acquisitions is the ability to provide image data coverage of the full cardiac cycle. Depending on the patient’s individual HR, optimal timing of image data reconstruction can be chosen based on individual experience, multiple pre-reconstructions, or using semiautomated data evaluation tools. Image data reconstruction can be related to the R-wave trigger in a forward or retrograde manner, and it can be performed as a preset absolute time delay or as a percentage of the cardiac cycle. In addition, this type of reconstruction is less sensitive to aberrancy of the heart rhythm (e.g., premature ventricular contractions) (3).
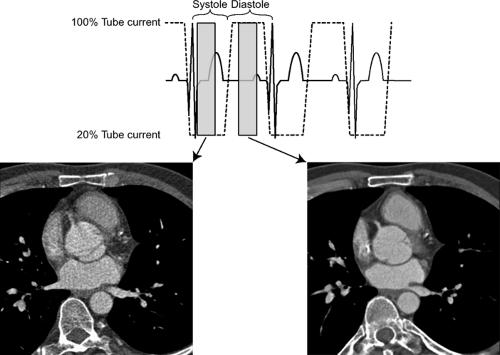
Dose modulation schemes, in which tube current is lowered during acquisition of nondesired phases of the cardiac cycle, can be used with up to 50% reduction in radiation dose (Fig. 1-4). However, this type of acquisition requires
one to have preset phases of the cardiac cycle desired for acquisition because the other phases will often be suboptimal for image reconstruction and interpretation.
one to have preset phases of the cardiac cycle desired for acquisition because the other phases will often be suboptimal for image reconstruction and interpretation.
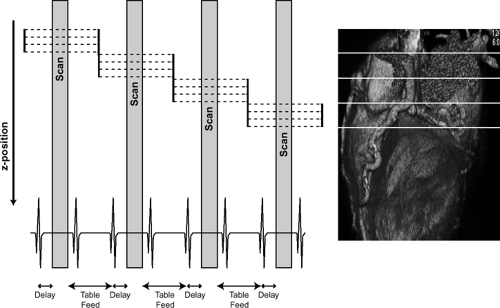 Figure 1-2 Schematic diagram of prospective ECG triggering for CT data acquisition and reconstruction. |
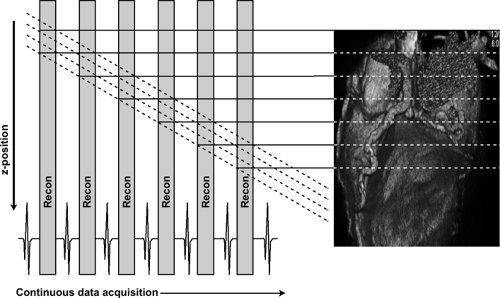 Figure 1-3 Schematic diagram of retrospective ECG triggering for CT data acquisition and reconstruction. |
Temporal Resolution
Temporal resolution is the amount of time needed to acquire necessary scan data to reconstruct an image (4). Temporal resolution in cardiac MDCT is primarily dependent on gantry speed rotation. Half-scan reconstruction algorithms result in temporal resolutions corresponding to half of a full 360-degree rotation, or 165 ms with a 330 ms per 360 degree rotation speed. Further improvements in temporal resolution can be achieved with multisector reconstruction algorithms, which are based on merging data of adjacent cardiac cycles (two to four heartbeats) to fill a data segment more rapidly. However, in using these algorithms, image quality is often degraded because of blurring artifacts related to differences in the position of cardiac structures from cycle to cycle even within the same phase of the cycle (4,5). Dual-source CT scanners achieve temporal resolution of 83 ms because of simultaneous scanning using two sets of sources and detectors, and similar to single-source scanners, multisector reconstruction algorithms can further reduce the temporal resolution.
Given the limited temporal resolution offered by current MDCT technologies, image quality can often be improved by optimizing the patient’s HR. Reconstruction is usually performed during diastole, when cardiac motion is minimal. The duration of diastole is approximately two thirds of the cardiac cycle; however, the proportion of the cardiac cycle spent in diastole decreases with increasing HR and increases with lowering of the HR (1,6). Beta-blockers have been used to both lower the HR and promote regularity of the heart rhythm or decrease arrhythmias. Depending on the optimal diastolic time interval desired, oral or intravenous beta-blockers have been shown to be safe when administered to patients prior to CT scanning (6,7,8). In patients unable to tolerate beta-blockers (e.g., severe asthmatics), calcium-channel blockers can provide a similar benefit.
Spatial Resolution
Spatial resolution is mainly dependent on detector width, slice collimations, and data sampling. Coronary arteries are small, ranging from 1 to 2 mm in diameter (9). Nitro-glycerin (0.4 mg) is often given just prior to scanning to
dilate the coronary arteries (10,11). The spatial resolution of EBCT is 0.7 × 0.7 × 3 mm, and that of four detector MDCT scanners is 0.6 × 0.6 × 1.0 mm. In comparison, the spatial resolution of MR coronary angiography is about 1.0 × 1.0 × 1.5 mm, depending on the scanning parameters. With helical CT volume acquisition and reconstruction of overlapping sections, the z-axis resolution is improved, leading to near isotropic voxels. The resolution of 16-detector MDCT is 0.5 × 0.5 × 0.6 mm, and that of 64-slice systems is up to 0.4 × 0.4 × 0.4 mm (12). These advances have greatly enhanced the visualization of small structures such as the coronary arteries, but the resolution remains inferior to that of conventional coronary angiography, which has a spatial resolution of 0.2 × 0.2 mm (13).
dilate the coronary arteries (10,11). The spatial resolution of EBCT is 0.7 × 0.7 × 3 mm, and that of four detector MDCT scanners is 0.6 × 0.6 × 1.0 mm. In comparison, the spatial resolution of MR coronary angiography is about 1.0 × 1.0 × 1.5 mm, depending on the scanning parameters. With helical CT volume acquisition and reconstruction of overlapping sections, the z-axis resolution is improved, leading to near isotropic voxels. The resolution of 16-detector MDCT is 0.5 × 0.5 × 0.6 mm, and that of 64-slice systems is up to 0.4 × 0.4 × 0.4 mm (12). These advances have greatly enhanced the visualization of small structures such as the coronary arteries, but the resolution remains inferior to that of conventional coronary angiography, which has a spatial resolution of 0.2 × 0.2 mm (13).
Contrast Administration
Several considerations are important to be aware of with contrast use in cardiac imaging. First, because image quality is greatly affected with irregularity of the heart rhythm, nonionic contrast is used to prevent perturbations in the HR during image acquisition (14). Second, patients with cardiac disease may have low cardiac outputs (COs), and, as such, the timing of contrast arrival into the regions of interest can be variable. Hence, it becomes important to accurately track contrast arrival times individually for each patient. Finally, the physiologic impact of receiving contrast media must be taken into consideration, as this can also affect the timing of contrast arrival.
Two types of contrast timing methods are employed in current MDCT scanning systems. The first involves determining the circulation time by giving a small-volume test bolus (10 to 20 mL) of contrast and observing the time of its arrival in the heart, also known as a timing run. We usually subtract 6 seconds from the circulation time to determine the time to start image acquisition. The second involves imaging a specific region of interest (e.g., ascending aorta), and once the contrast density attenuation reaches a prespecified point, the scanner turns on and starts imaging, also known as bolus tracking. Again, exact values are dependent on scanner type, contrast type, amount and delivery method, scan delay time, and individual preference.
Post Processing
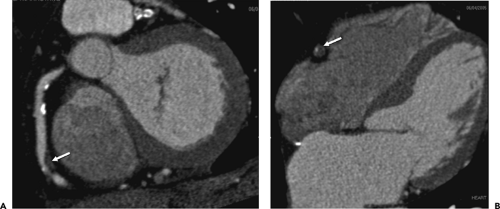
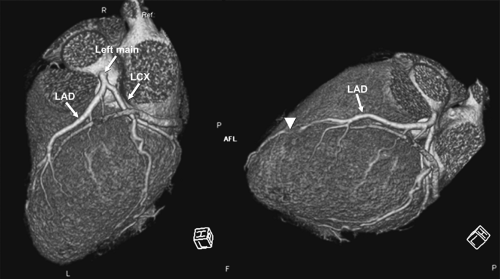
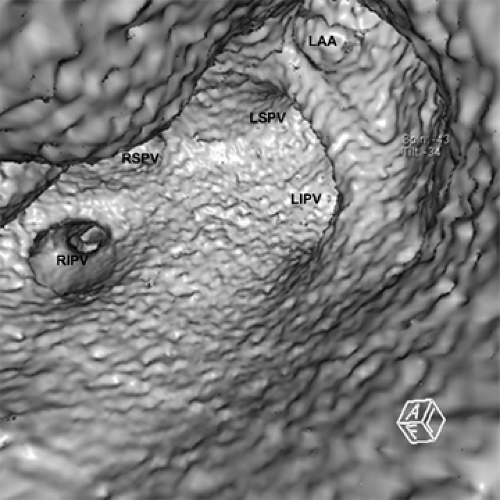
Because of the near isotropic volumetric nature of the MDCT data, oblique multiplanar and thin maximum intensity projection reconstructions, including curved re-formations, are used in addition to standard axial two-dimensional (2D) evaluation of CT images to better understand cardiac structures. These oblique reconstructions are especially important for visualization of the coronary vessels throughout their course in both a longitudinal and axial plane to the vessel of interest for the assessment of atherosclerotic plaque and luminal narrowing (Fig. 1-5). In addition to 2D evaluations, volume and shaded surface rendered 3D reconstructions with advanced visualization algorithms allow for the extraction of specific overlying structures, such as bones, lung tissue and vessels, and soft tissue structures, to focus on cardiac anatomy. These volume rendered 3D images (Fig. 1-6) are invaluable for understanding complex cardiac anatomy (e.g., anomalous coronary arteries) and in surgical planning. Shaded surface displays are commonly used for visualization of internal structures from a specified point simulating an endoscopic or angioscopic view (Fig. 1-7) and can provide the important information on the internal relationship of structures, which may be important for guiding procedures (e.g., pulmonary vein isolation). ECG gating greatly reduces the amount and degree of stair-step artifact related to changes in cardiac position between gantry rotations but may still be apparent primarily because of slight changes in the position of cardiac structures that occur from beat to beat, especially when there is even minor irregularity in the heart rhythm.
Because CT data are volumetric and are acquired synchronized to the cardiac cycle, slices in any arbitrary plane in 3D space can be created during multiple phases of the cardiac cycle. Although currently temporal resolution is still limited (83 ms at best), qualitative evaluation of wall motion and valve function can be made. Additionally, precise quantitative calculation of ventricular volumes and ejection fraction can be obtained from the datasets (15,16,17,18).
Magnetic Resonance Imaging
The challenge in cardiac MR imaging is to cope with the cardiac motion and superimposed respiratory motion during the time needed for imaging sequences. The ongoing development of MR scanners, sequence techniques, and gradient amplifier enhancements has led to increasingly widespread cardiovascular MR applications. In addition, the use of parallel imaging has led to further improvements in temporal and spatial resolution. With the progress in rapid MR techniques, data acquisition is possible in just a fraction of the heart cycle. However, synchronization with the heart cycle is still needed to obtain images without blurring throughout the cardiac cycle for both structural and functional analysis.
Technical Design
Technical improvements in hardware and software design have promoted the growth of cardiovascular MR imaging. Developments of MR systems, coil technology, and sequence techniques have produced considerably shortened acquisition times and improvements in overall image quality. High field imaging at 3 Tesla and multichannel coils result in improved spatial resolution but may introduce other technical issues that need to be addressed.
Acceleration techniques (e.g., parallel imaging) can further reduce scan acquisition time but usually at the expense of spatial resolution. Hence, a combination of factors is often needed to optimize cardiac imaging protocols.
Acceleration techniques (e.g., parallel imaging) can further reduce scan acquisition time but usually at the expense of spatial resolution. Hence, a combination of factors is often needed to optimize cardiac imaging protocols.
Motion Compensation
Electrocardiogram Referencing
Synchronization of image data is usually performed with ECG referencing to the R wave. However, the magneto-hydrodynamic effect of the flowing blood can lead to an increase in the T-wave amplitude of the ECG, which may be misinterpreted as an R wave. This misinterpretation can result in mistriggering, with consequent blurring of the image data. The development of vectorcardiography-based triggering can classify cardiac events by comparing them with a previously calculated reference vector of the QRS complex of the heart cycle (19). In this way, events with the same magnitude but different phase as the R wave are not misinterpreted as such.
Similar to ECG referencing with MDCT, detected R waves act as reference points for data acquisition, which can be performed as prospective triggering or retrospective gating (Fig. 1-8). With prospective triggering, the detection of the R wave triggers the execution of the next part of the imaging sequence. The search for the next trigger event is enabled after the completion of the sequence part. Consequently, a single measurement can cover more than one cardiac cycle to ensure that a complete heart cycle is covered. With retrospective gating, data acquisition occurs continuously with recording of the patient’s ECG. This type of gating is useful for studies of cardiac function, in which the complete heart cycle is covered during data acquisition. Image data can then be referenced to the ECG and reconstructed with a user-definable temporal resolution. Additionally, arrhythmia rejection can be employed to reject data acquired outside a user-definable heart cycle range.
Respiratory Referencing
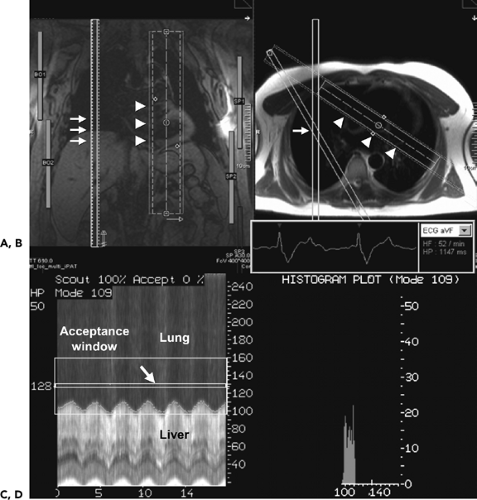
Cardiac MR sequences are often acquired over multiple heart cycles and usually require a breath-hold to avoid blurred images due to respiratory motion. With particularly long sequences and in patients unable to adequately hold their breaths, multiple averages and navigator techniques that track the movement of the diaphragm have been used to acquire data during a particular phase of the respiratory cycle.
Cardiac Acquisition Sequences
Tomographic Imaging
General anatomic imaging is performed using either spin-echo or gradient-echo techniques for evaluation of cardiac
structure and morphology. The spin-echo sequences can be performed with T1 and T2 weighting, fat saturation, inversion recovery (IR), and pre– and post–contrast administration to provide static high-resolution images with excellent contrast between the intracavitary blood flow and myocardium or other structures (20). The gradient-echo sequences are a quick method for providing information about cardiac structure, although tissue contrast for characterization is not as great as with spin-echo sequences. In general, gradient-echo sequences are widely used at present for assessment of functional characteristics of the heart. Methods to shorten acquisition time as well as cardiac gating are used to decrease cardiac motion artifact and improve overall image quality.
structure and morphology. The spin-echo sequences can be performed with T1 and T2 weighting, fat saturation, inversion recovery (IR), and pre– and post–contrast administration to provide static high-resolution images with excellent contrast between the intracavitary blood flow and myocardium or other structures (20). The gradient-echo sequences are a quick method for providing information about cardiac structure, although tissue contrast for characterization is not as great as with spin-echo sequences. In general, gradient-echo sequences are widely used at present for assessment of functional characteristics of the heart. Methods to shorten acquisition time as well as cardiac gating are used to decrease cardiac motion artifact and improve overall image quality.
 Figure 1-8 Schematic diagram of prospective and retrospective ECG triggering for MR data acquisition. |
In spin-echo sequences, flowing blood generally appears hypointense. A complete signal void usually results if all of the spins excited by the 90-degree pulse have flowed out of the slice of interest and hence do not experience the 180-degree pulse. This effect can be intensified by the use of 180-degree preparation pulses that invert the blood and tissue signal inside and outside the excitation slice (nonselective inversion) followed by a subsequent 180-degree slice-selective inversion pulse, which results in re-inversion of the signal within the slice of interest. Blood flowing into a slice is inverted by the first 180-degree pulse, and acquisition timing is such that the blood flows through the slice during the zero-crossing of its magnetization, resulting in signal from the adjacent tissue and none from the flowing blood.
Turbo/fast spin-echo (TSE/FSE) sequences shorten the acquisition times of general spin-echo sequences considerably by acquiring multiple-k-space lines using multiple phase-encoded echoes acquired following a single excitation. The multiple 180-degree refocused echoes are also referred to as the echo train. The length of the echo train determines the maximum time savings and is also known as the turbo factor. Single-shot TSE/FSE sequences use a single excitation followed by multiple RF refocused echoes to acquire all data in one heart cycle. In addition, the half-Fourier technique accelerates the measurement further by acquiring and using only a little more than half of the raw data.
 Figure 1-9 Tomographic axial MR image using dark blood spin-echo (A) and bright blood gradient-echo (B) imaging. |
In a general gradient-echo–based sequence, the 180-degree refocusing pulse is omitted, and spin dephasing occurs because of local field inhomogeneities that are not refocused. Hence, flowing blood appears bright because of the wash-in effect of fresh blood. The advantage of the gradient-echo–based sequences is the potentially short repetition time.
The spoiled gradient-echo sequence uses the steady state of the longitudinal magnetization (small flip angle), and the remaining transverse magnetization is destroyed or “spoiled.” This can be accomplished by using a long repetition time (TR), by adding a phase offset, or by extending the duration of the readout gradient (spoiler or crusher gradients). Spoiled gradient-echo images may be either T1- or T2*-weighted. The longer the TR and the higher the flip angle, the more T1-weighted the image becomes, whereas the longer the echo time (TE), the more T2*-weighted the image is (21). This technique is less sensitive to field inhomogeneities compared with steady-state free precession techniques, with excellent contrast between blood and tissue in through-plane orientations due to the wash-in phenomenon of fresh blood (Fig. 1-9).
The fully balanced steady-state free precession sequence uses the steady state of the residual transverse magnetization (high flip angle) in addition to the steady state of the longitudinal magnetization. In steady-state free precession, all echo paths that have been dephased for the purpose of spatial encoding are rephased (21). Theoretically,
the achieved contrast between blood and tissue becomes a function of the ratio between T1 and T2, rather than a function of TE and TR. The TR/TE in steady-state free precession sequences are much shorter than in the spoiled gradient-echo sequences. At TR<<T2, the image signal is proportional to the T2/T1 ratio, which is approximately 1:5 in arterial blood and 1:18 in myocardium. Hence, there is high contrast between blood and myocardium, but because steady-state free precession sequences are more sensitive to field inhomogeneities, they can exhibit more artifacts (Fig. 1-10). The implementation of steady-state free precession sequences requires high-performance MR systems capable of delivering fast gradients to ensure short enough times to preserve transverse magnetization (21).
the achieved contrast between blood and tissue becomes a function of the ratio between T1 and T2, rather than a function of TE and TR. The TR/TE in steady-state free precession sequences are much shorter than in the spoiled gradient-echo sequences. At TR<<T2, the image signal is proportional to the T2/T1 ratio, which is approximately 1:5 in arterial blood and 1:18 in myocardium. Hence, there is high contrast between blood and myocardium, but because steady-state free precession sequences are more sensitive to field inhomogeneities, they can exhibit more artifacts (Fig. 1-10). The implementation of steady-state free precession sequences requires high-performance MR systems capable of delivering fast gradients to ensure short enough times to preserve transverse magnetization (21).
Cine Sequences
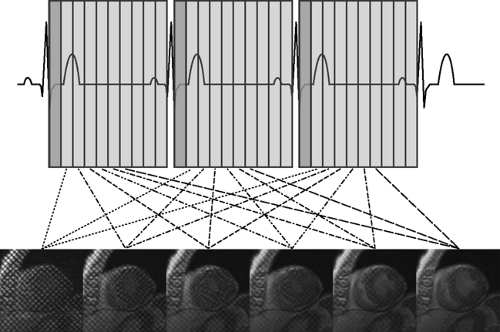
Cine sequences used in cardiac MR imaging consist of a collection of images (usually at the same spatial location) covering one full period of the cardiac cycle. The pulse sequence used is commonly a type of gradient-echo sequence because these can be acquired with relatively short acquisition times. The image acquisition utilizes cardiac gating to yield a multiphase sequence covering the cardiac cycle. As previously mentioned, data can be timed to the cardiac cycle in a prospective or retrospective manner. Segmented data acquisition is commonly employed to reduce overall imaging time. Segments are then pieced together from different cardiac cycles to yield an image loop tracking the motion of tissues within the heart and/or vessels over the cardiac cycle (Fig. 1-11).
Tagging
Magnetic tissue tagging is a process in which landmarks on an MR imaging plane are introduced noninvasively prior to cine imaging (Fig. 1-12). Presaturation pulses are used to create linear dark stripes or a grid pattern over the myocardium. As systole proceeds, the pattern distorts in the direction corresponding to myocardial movement. This technique can be very useful in the analysis of the heart wall motion because it can provide temporal correspondence of material points within the heart wall, which can be assessed reproducibly and quantitatively.
Phase Contrast
Phase-contrast MR methods are based on the sensitivity of the phase of the MR signal to motion. Using appropriate velocity encoding gradients, the motion-dependent phase effect can be used to measure two datasets with different velocity-dependent phase at otherwise identical acquisition parameters. Subtraction of the two resulting phase images allows for quantitative assessment of the velocities of the underlying motion. In the simplest phase-contrast pulse sequence, bipolar gradients (two gradients with equal magnitude but opposite direction) are used to encode the velocity of blood flow. Stationary tissue will undergo no net change in phase after the two gradients are applied. Flowing blood will experience a different magnitude of the second gradient compared with the first owing to its different spatial position and a resultant net phase shift. This information can be used directly to determine the velocity of the flowing blood.
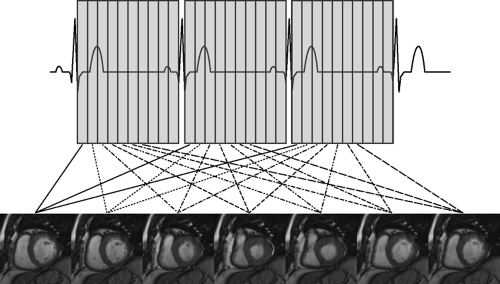 Figure 1-11 Schematic diagram demonstrating acquisition of gradient-echo cine MR imaging at a basal short axis level of the heart. |
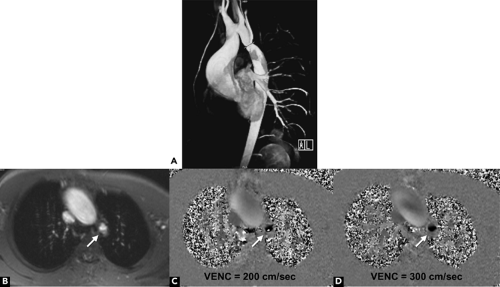
With the phase-contrast method, two sequences are acquired, one with and one without motion compensation. By comparing the phase of signals from each location in the two sequences, the exact amount of motion-induced phase change can be determined and mapped, where pixel color (black vs. white) represents velocity direction and pixel brightness is proportional to spatial velocity (Fig. 1-13). In the basic sequence, signal only occurs when a voxel of tissue contains a uniform velocity in a specific direction. Acquisition of the sequence in the three orthogonal directions is needed to obtain a complete map of flow regardless of direction. Phase change is measured on a circular scale and is designed so that different flow velocities are displayed along the 360 degrees of phase shift, depending on the velocity-encoding factor, or VENC. For best results, the VENC is chosen to be slightly more than the maximum expected flow velocity in a region. However, if a higher velocity is encountered than that set for the VENC, it will be represented as a darker (or brighter, depending on direction) pixel, otherwise known as velocity aliasing (Fig. 1-13). Phase-encoded images are generally displayed as corresponding magnitude and phase display, usually in encompassing an entire cardiac cycle (cine display). For the phase display, the flow information on flow direction (bright vs. black) and flow velocity (signal intensity) can be visually interpreted.
First Pass Perfusion
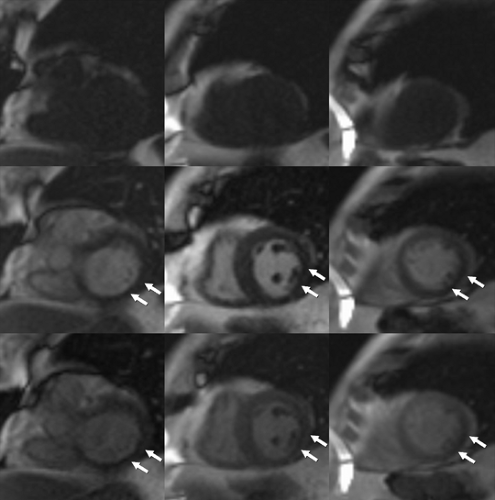
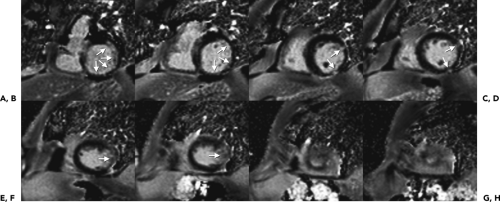
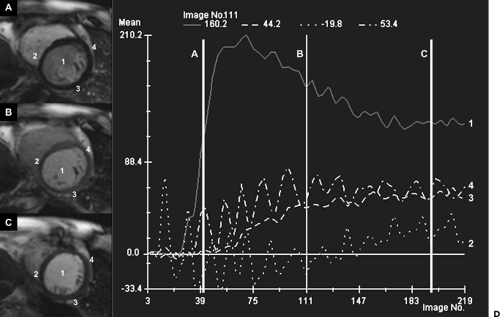
A saturation recovery technique is used in cardiac MR to maximize the T1 contrast between normal and hypoperfused myocardium during a dynamic contrast-enhanced first pass myocardial perfusion acquisition. This is accomplished by using a 90-degree saturation pulse in combination with a gradient-echo–based sequence. The preparation pulse saturates the entire tissue in the slice of interest, and the contrast between the different perfused tissues is based on the very short T1 generated by the contrast uptake (Fig. 1-14). Fast acquisition sequences allow for the collection of multiple images during a single cardiac cycle, and the flow of contrast into the imaging planes can be followed during the first pass of the contrast agent.
Contrast-enhanced Magnetic Resonance Angiography
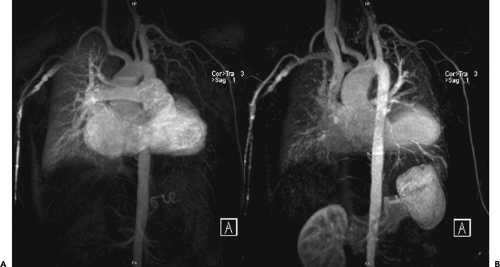
Depiction of blood vessels is based on their T1 values alone. The tissue surrounding blood vessels should have a higher T1 value compared with blood itself. Additionally, T1-shortening agents such as gadolinium-based contrast can further reduce the T1 value of the blood to below 50 ms. As such, vessels of interest become much brighter than background fat and visualization of in-plane blood vessels is improved. This sequence is commonly performed
as a T1-weighted 3D spoiled gradient-echo pulse sequence with zero interpolation in the slice-selected direction and short TR and TE values. Contrast injection is timed with respect to the k-space acquisition such that peak enhancement coincides with optimal contrast imaging (Fig. 1-15). This can be achieved with educated guess, bolus timing, or bolus tracking techniques as discussed previously.
as a T1-weighted 3D spoiled gradient-echo pulse sequence with zero interpolation in the slice-selected direction and short TR and TE values. Contrast injection is timed with respect to the k-space acquisition such that peak enhancement coincides with optimal contrast imaging (Fig. 1-15). This can be achieved with educated guess, bolus timing, or bolus tracking techniques as discussed previously.
Coronary Magnetic Resonance Angiography
Coronary artery imaging is one of the most technically challenging areas of MR imaging. In addition to the spatial requirements necessary to visualize the small coronary arteries, respiratory and cardiac motion provide further impediments to optimizing image quality. Numerous MR sequences have been used for imaging the coronary arteries. Bright-blood techniques, including spoiled gradient-echo, echo planar, and steady-state free precession gradient-echo sequences and black-blood techniques, have been proposed. Furthermore, conventional gadolinium contrast agents and newer intravascular agents have also been utilized to improve image contrast. Both 2D and 3D sequences are available, each with its own pros and cons. The most widely available sequence is a 2D segmented k-space gradient-echo acquisition in which multiple thick slices are acquired through the vessel of interest. Variability in breath-holds and thick slices can limit the registration of images from slice to slice. 3D imaging methods are commonly performed using bright-blood techniques with free breathing. These sequences can be performed with or without gadolinium-based contrast agents (21).
Regardless of the sequence used, certain fundamental components are common to all the sequences. 2D slices or 3D slabs need to be positioned appropriately to encompass the entire course of the coronary artery to be imaged. Depending on the slab thickness, often at least two slabs are needed to image all three major coronary arteries, including an oblique sagittal slab directed along the atrio-ventricular (AV) groove and a second oblique sagittal acquisition along the anterior border of the heart. Data
acquisition is typically constrained to a window less than 150 to 200 ms per heartbeat during diastole to minimize cardiac motion. Respiratory motion artifacts are minimized by using multiple short breath-hold acquisitions or navigator techniques to track the diaphragm position during data acquisition (Fig. 1-16). Because the coronary arteries lie against the epicardial surface of the heart and are surrounded by epicardial fat, methods to improve the image contrast between fat, myocardium, and flowing blood are used, such as fat and myocardial suppression. Anterior saturation bands and prone imaging can reduce ghosting artifacts related to free-breathing techniques (21).
acquisition is typically constrained to a window less than 150 to 200 ms per heartbeat during diastole to minimize cardiac motion. Respiratory motion artifacts are minimized by using multiple short breath-hold acquisitions or navigator techniques to track the diaphragm position during data acquisition (Fig. 1-16). Because the coronary arteries lie against the epicardial surface of the heart and are surrounded by epicardial fat, methods to improve the image contrast between fat, myocardium, and flowing blood are used, such as fat and myocardial suppression. Anterior saturation bands and prone imaging can reduce ghosting artifacts related to free-breathing techniques (21).
Inversion Recovery (Delayed Enhancement Imaging)
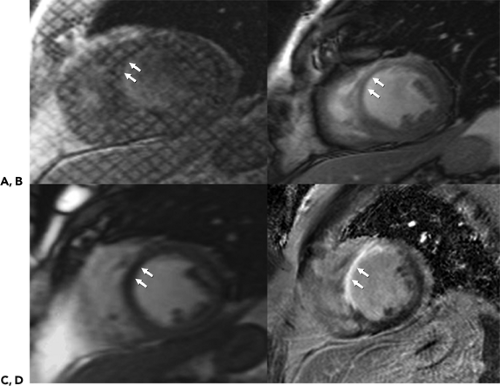
The IR technique is often used in cardiac MR imaging to characterize tissue after the administration of contrast media. Normally perfused myocardium is often suppressed to better visualize areas with increased contrast uptake that appear hyperintense (Fig. 1-17). In conjunction with TSE imaging, the IR technique can be used to suppress fat to identify fatty infiltration seen in arrhythmogenic right ventricular (RV) dysplasia or to visualize edema and tissue damage seen in acute myocardial infarctions.
A 180-degree inversion pulse is applied before data acquisition. As the longitudinal magnetization relaxes, the magnetization of different tissue types (fat, normal or hyperintense, scarred myocardium) reaches zero at different times. Appropriate selection of inversion time (TI) can suppress the signal of relevant tissue and improve contrast between different tissue types with different TI relaxation times. The challenge is in the choice of TI, which depends on the amount and time of contrast administration and continually changes during the examination.
Acceleration Techniques in Magnetic Resonance
Although the speed of pulse sequences has steadily improved with the performance of gradient hardware, the maximum gradient switching rates (slew rate) are still a limiting factor because further increments will lead to patient nerve stimulation. Because the speed of MR imaging is generally limited by the number of required phase-encoding steps, several approaches have been introduced to reduce the number of required phase-encoding steps and thus further shorten data acquisition time.
With single-shot k-space filling, the goal is to acquire all the needed k-space lines during one heart cycle. In TSE/FSE, this is performed by a single excitation followed by multiple 180-degree refocusing pulses. In segmented k-space filling, only some k-space lines are acquired per heart cycle. Depending on the total number of k-space lines, the sequence is repeated until the entire k-space is filled. This technique is used to collect data over a longer period of
time to improve the spatial and temporal resolution. Segmented k-space with view sharing is based on the segmented technique and involves sharing the outer lines of kspace between adjacent cardiac phases to improve temporal resolution. Because the most important information is in central k-space, these lines are acquired separately for each image. In nonsegmented k-space filling, one k-space line is acquired per cardiac phase, resulting in a long acquisition time but higher spatial resolution.
time to improve the spatial and temporal resolution. Segmented k-space with view sharing is based on the segmented technique and involves sharing the outer lines of kspace between adjacent cardiac phases to improve temporal resolution. Because the most important information is in central k-space, these lines are acquired separately for each image. In nonsegmented k-space filling, one k-space line is acquired per cardiac phase, resulting in a long acquisition time but higher spatial resolution.
Half- and partial-Fourier techniques decrease scan time by omitting certain lines of k-space, which are reconstructed after measurement using theoretical symmetry of k-space. Shared k-space filling, in which outer k-space lines between adjacent cardiac phases are “shared,” is used to shorten the acquisition and improve temporal resolution. Parallel acquisition techniques (PAT) involve omitting certain phase-encoding steps, depending on the number of coil elements aligned along the phase-encoding direction. The number of skipped phase-encoding steps is identified by the acceleration/PAT factor [e.g., factor of 3 (PAT3) implies that only every third k-space line is measured]. The missing information is replaced using the individual coil sensitivity profiles from all involved coil elements. Different reconstruction methods such as sensitivity encoding (SENSE) (22) and generalized autocalibrating partial parallel acquisition (GRAPPA) (23) can eliminate aliasing artifacts related to the reduction of k-space lines. Depending on slice orientation and coil arrangement, PAT factors of 2 to 3 for 2D measurements and 4 to 6 for 3D measurements can usually be obtained. With short acquisition time it is possible to acquire the data in free breathing and to minimize image blurring during arrhythmias. Data acquisition usually is set to occur during mid-to-late diastole to avoid image degradation from cardiac motion.
Specific Evaluations
Ventricular Analysis
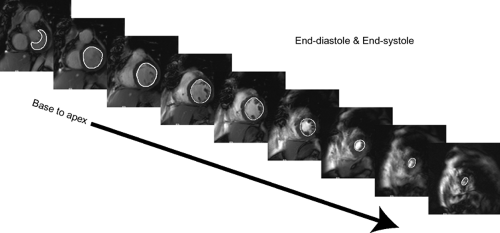
Ventricular analysis requires acquisition of a volumetric cine imaging data set usually acquired in the true short axis plane from the base of the heart to the apex, although long axis orientations have also been used (24). Next, representative end-diastole ED and end-systole ES cardiac-phase images are chosen as phases with the largest and smallest ventricular volumes or the phase images obtained immediately before mitral valve closure ED and opening ES. Once the phase images are chosen, the right and left ventricles are traced along the endocardial margin on each section obtained in the selected ED and ES phases from the cardiac apex to the section just prior to the one that depicts the mitral and tricuspid valve annuli. By convention, the tracings should exclude trabeculations. Papillary muscles are also commonly excluded but may be included inside the endocardial margin, as long as there is consistency followed for both ED and ES phases (Fig. 1-18). Calculations can then be made as follows:
ED and ES volumes for each section are totaled to yield the RV and left ventricular (LV) end-diastolic volume (EDV) and end-systolic volume (ESV); ∑EDLV = LVEDV, ∑ESLV = LVESV, ∑EDRV = RVEDV, ∑ESRV = RVESV
Stroke volume (SV) equals the EDV minus the ESV; LV SV = LVEDV – LVESV
Ejection fraction (EF) equals the SV divided by the EDV multiplied by 100 [EF = (SV/EDV) × 100] to be reported as a percentage
CO equals SV multiplied by the HR; CO = SV × HR
Myocardial mass can be calculated by inclusion of the RV and LV epicardial borders during the ED phase. The interventricular septum is included with the LV and excluded from the RV tracing for myocardial mass calculation. The volumes of all sections are added, and the corresponding EDV is subtracted from the endocardial EDV to yield the myocardial volume. This result is then multiplied by the specific gravity of myocardium (i.e., 1.05 g/mL) to calculate the mass. Although this measure is useful for the assessment and follow-up of hypertrophic states, clinicians commonly also rely on the one-dimensional ED thickness measurement at specific segments throughout the left ventricle. Normal cardiac chamber dimensions using steady-state free precession cine MR techniques are shown in Table 1-3 (see ref. 346).
Diastolic function of the ventricles can be measured by several different methods (25). The use of phase-contrast velocity mapping at the transtricuspid or transmitral level for calculation of time-velocity curves is a method similar to that used in Doppler echocardiography. However, the calculation of RV and LV time-volume curves is generally the most reliable method used in practice (1). Diastolic function can be evaluated by several parameters related to both early and atrial filling. The early rapid filling phase can be characterized by parameters such as peak filling
rate, time-to-peak filling rate, acceleration and deceleration slope of the early filling peak, deceleration time, and duration of the rapid filling period (26). The atrial filling peak is often quantified by peak filling rate. The ratio of early and atrial peak filling rate (E/A ratio) is another parameter that is commonly used. Tagged MR imaging can also be used to measure global and regional diastolic function by calculation of diastolic strain rate (27).
rate, time-to-peak filling rate, acceleration and deceleration slope of the early filling peak, deceleration time, and duration of the rapid filling period (26). The atrial filling peak is often quantified by peak filling rate. The ratio of early and atrial peak filling rate (E/A ratio) is another parameter that is commonly used. Tagged MR imaging can also be used to measure global and regional diastolic function by calculation of diastolic strain rate (27).
Table 1-3 Normal Range of Left Ventricular and Right Ventricular Cardiac Dimensions | ||||||||||||||||||||||||||||||||||||||||||||||||||||||||||||||||||||||||||||||||
|---|---|---|---|---|---|---|---|---|---|---|---|---|---|---|---|---|---|---|---|---|---|---|---|---|---|---|---|---|---|---|---|---|---|---|---|---|---|---|---|---|---|---|---|---|---|---|---|---|---|---|---|---|---|---|---|---|---|---|---|---|---|---|---|---|---|---|---|---|---|---|---|---|---|---|---|---|---|---|---|---|
| ||||||||||||||||||||||||||||||||||||||||||||||||||||||||||||||||||||||||||||||||
Flow Analysis
Quantitative assessment of blood flow through the cardiac chambers, valves, and blood vessels is important in the management of cardiac patients. Phase-contrast velocity measurements allow the assessment of the volume flow through a cross-sectional area of a vessel according to a simple relationship: Q = V × A, where Q = blood flow, V = velocity in cm/sec, and A = lumen area in cm2. Phase-contrast velocity measurements have been validated and are currently used to quantify flow and other physiologic parameters such as SV, valvular stenosis and regurgitation, and CO, with an overall error rate in flow measurement below 10% (28). It should be noted that peak velocities might be underestimated with this method due to factors such as angle effects in the case of eccentric jets or low temporal resolution. Hence, imaging planes should be positioned orthogonal (through-plane) to the direction of the flow, and at least 16 phases of the cardiac cycle must be sampled with the encoding velocity (VENC) set well above the actual peak velocity in the region of interest to avoid aliasing (1).
Assessment of Intracardiac Shunts
Accurate assessment of the ratio of pulmonary (Qp) to systemic (Qs) flow is important in the management of patients with intracardiac left to right shunts. Large shunts with a Qp/Qs ratio exceeding 1.5 are usually closed because chronic left to right shunting with increased blood flow to the lungs may lead to irreversible elevation of pulmonary resistance, also known as Eisenmenger physiology.
The Qp/Qs ratio is usually derived directly from heart catheterization oximetry, but noninvasive methods for calculation of this ratio can be made using Doppler echocardiography, radionuclide angiography, and MR. With phase-contrast velocity mapping MR, flow quantification in both great arteries can be used to quantify Qp/Qs and has been shown to have good agreement with other methods for calculation of shunt size (29,30).
Normal Anatomy
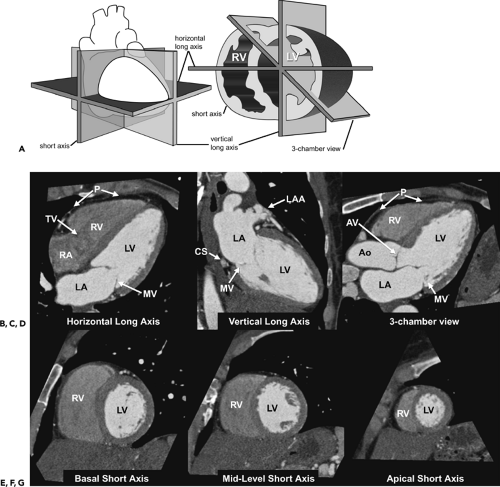
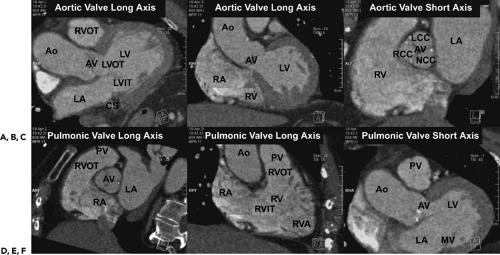
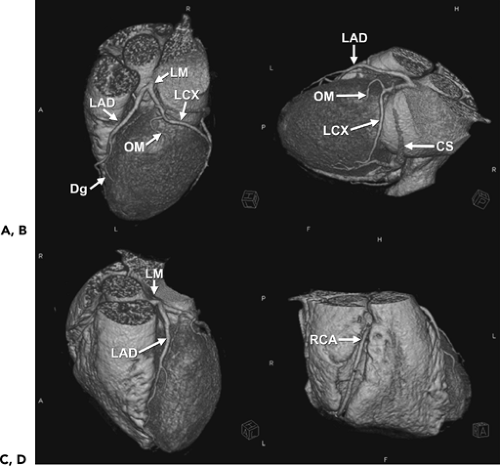
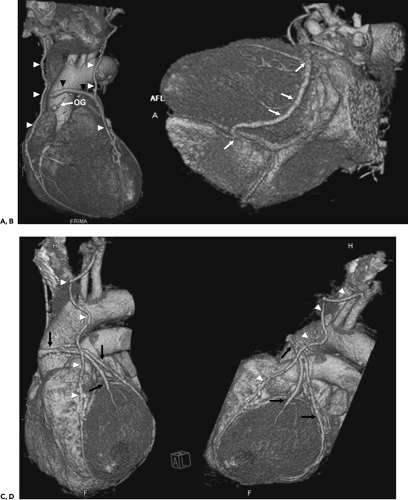
Given the complexity of the cardiac anatomy and the individual variations unique to each patient, cardiac structures can have different appearances depending on the imaging plane. Hence, the most useful imaging planes are those that are parallel and perpendicular to the cardiac axes, which are based on internal cardiac landmarks. The most common standard views of the heart are demonstrated in Figure 1-19. The two-chamber and four-chamber long axis views along with the short axis views are often used for visualization of the cardiac chambers and for evaluation of cardiac anatomy and function. The three-chamber view allows for visualization of the aortic root and provides the basis for demonstrating aortic valve and aortic root anatomy as well as for obtaining additional images of the ascending aorta. Depending on the structure of interest, additional imaging planes directed to best depict the anatomic relationships may be important for diagnosis (Fig. 1-20). The coronary anatomy is best displayed in conventional angiographic views, including right anterior oblique, left anterior oblique, and so forth. However, the use of 3D images allows for visualization of the coronary arteries in relation to the underlying cardiac chambers (Fig. 1-21). Hence, depending on the technique, imaging protocols often need to be customized to accommodate individual patient variations and distortions that may be normal or due to cardiac disease.
Cardiac Chambers
The heart is a hollow muscular organ with a conical shape, located between the lungs in the middle mediastinum just to the left of and below the sternum. The heart is enclosed in the pericardium. The adult heart measures about 12 cm in length, 8 to 9 cm in breadth at its broadest section, and 6 cm in thickness. The heart is subdivided by septa into right and left halves, and a constriction subdivides each half of the organ into two cavities, with the upper cavity named the atrium and the lower cavity named the ventricle, resulting in four main chambers: right and left atria and right and left ventricles. The atria are separated from the ventricles by the AV groove.
The right atrium is located high and anterior in the heart. It consists of the large, posterior quadrangular cavity situated between the vena cava and a smaller, anterior portion known as the appendage. The main body of the right atrium consists of a thin, smooth wall, whereas the wall of the appendage contains raised muscular fibers termed pectinate muscles. The separation of the appendage from the main cavity of the right atrium is indicated externally by the terminal sulcus groove and internally by the vertical muscular ridge known as the crista terminalis. The superior vena cava returns blood from the upper half of the body and opens without a valve into the upper and posterior part of the atrium, directing blood downward and anteriorly toward the AV valve. The inferior vena cava, larger than the superior, opens into the lowest part of the atrium near the atrial septum and directs blood returning from the lower half of the body upward and posteriorly toward the atrial septum. The eustachian valve guards the orifice of the inferior vena cava, directing blood through the foramen ovale in the fetus. This valve structure may persist as a small remnant, cribriform or filamentous in appearance in the adult. The coronary sinus opens into the right atrium between the orifice of the inferior vena cava and the AV opening. It returns blood from the main heart muscles and is protected by a semicircular valve known as the thebesian valve (31).
The left atrium is located high and posterior in the heart. Similar to its right-sided counterpart, the left atrium also consists of two main portions, including a large cuboidal principal cavity and smaller, anteriorly situated appendage. Its walls are thicker than the corresponding right atrium (3 mm). The appendage is somewhat constricted at its junction with the main cavity and is longer, narrower, and more curved than that of the right side. The pulmonary veins, four in number, open without valves into the upper part of the posterior surface of the left atrium. The left AV opening is the aperture between the left atrium and ventricle. The pectinate muscles are fewer and
smaller than in the right-sided appendage and are confined to the inner surface of the appendage (31).
smaller than in the right-sided appendage and are confined to the inner surface of the appendage (31).
The atria are separated by a wall of tissue known as the interatrial septum. In the right atrium, it forms the posterior wall in the region superior to the coronary sinus. In the left atrium, the septum lies obliquely, running posteriorly from right to left. The fossa ovale is an oval depression on the septal wall of the atrium, and corresponds to the location of the foramen ovale in the fetus. The fossa ovale is the thinnest section of the interatrial septum, and it is situated in the lower part of the septum, above and to the left of the inferior vena cava orifice. The limbus of the fossa ovale is the prominent oval margin of the fossa ovalis. A small slitlike valvular opening is occasionally found, at the upper margin of the fossa (31).
The right ventricle is pyramidal and extends from the right atrium to near the apex of the heart. The RV chamber can be divided into three components consisting of the inlet, the apical trabecular portion, and the outlet portion (Fig. 1-20). The inlet component extends from the AV junction to the distal attachments of the chordae tendineae of the tricuspid valve. The apical trabecular component extends from the junction of the inlet and outlet portions to the apex. The trabeculae consist of rounded or irregular muscular columns, which project into the ventricular cavity as either prominent ridges, traversing muscle bundles, or numerous small papillary muscles that arise from both the septal and anterior free wall and form the distal attachments of the chordae tendineae of the tricuspid valve. A muscular band named the moderator band frequently extends from the base of the anterior papillary muscle to the ventricular septum, and assists in preventing overdistension of the ventricle. The outlet component is the smooth-walled tube of muscle, infundibulum, which supports the leaflets of the pulmonary valve. The right AV orifice is the large oval aperture of communication between the right atrium and right ventricle, surrounded by a fibrous ring and guarded by the tricuspid valve. The opening of the pulmonary artery is circular, located at the summit of the infundibulum and guarded by the pulmonary semilunar valve. The leaflets of the pulmonary valve and the tricuspid valve are widely separated by the infundibular musculature. The RV free wall is thin, measuring 2 to 3 mm in thickness (31).
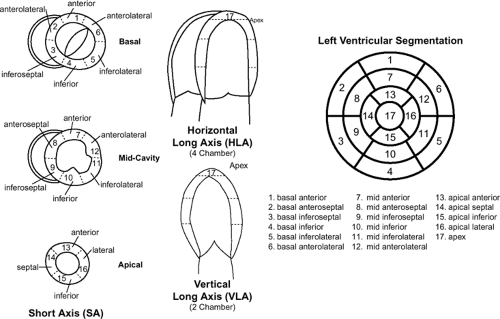
The left ventricle is longer and more cone shaped than the right. Similar to the right ventricle, the left ventricle can be described in terms of inlet, apical trabecular, and outlet components. The inlet component extends from the left AV junction to the distal attachments of the chordae tendineae of the left-sided AV valve. The apical trabecular portion contains fine trabeculations, which are numerous, fine muscular projections that give the endocardial surface of the chamber a smooth surface. There are two prominent papillary muscles that have attachments to the chordae tendineae: the anterior lateral and the posterior medial. Unlike the papillary muscles of the right ventricle, these papillary muscles are large and arise only from the free wall surface. The outlet component consists of the portion of the ventricle that gives rise to the aortic valve. Two leaflets of the aortic valve have muscular attachments to the outlet component. The posterior part of the outlet component is short, with the remaining aortic leaflet supported by the fibrous tissue of the aortic root, which is in fibrous continuity with the anterior leaflet of the mitral valve (Figs. 1-19 and 1-20). The left AV opening is inferior and to the left of the aortic orifice and a little smaller than the corresponding aperture on the right side. This aperture is surrounded by a dense fibrous ring, covered by the lining membrane of the heart and guarded by the bicuspid AV valve known as the mitral valve. The aortic opening is circular and located anterior and to the right of the mitral valve. Its orifice is guarded by the aortic semilunar valve. The LV walls are about three times as thick as those of the right ventricle, and on short axis section its shape presents an oval or nearly circular outline. Unlike the right ventricle, the LV myocardium has a smooth endocardial surface and normally measures 1 cm thick at ED. The interventricular septum separates the left ventricle from the right ventricle. The greater portion of the septum is thick and muscular, termed the muscular ventricular septum. However, the upper and posterior part of the septum, which separates the LV outlet component from the lower part of the right atrium and upper part of the right ventricle, is thin and fibrous and is termed the membranous ventricular septum (31). For the purposes of standardization, the LV myocardium is commonly divided into 17 segments (Fig. 1-22). This 17-segment model is used across all imaging modalities and is useful for describing the locations of myocardial disease and their relationships to coronary artery territories (32).
Cardiac Valves
The heart has four main cardiac valves that function to keep the blood flow circulating in one direction. The valves can be divided by the type of chambers they separate and include the AV valves, separating the atria from the ventricles, and the semilunar valves, separating the ventricles from the great arteries.
The right-sided AV valve, the tricuspid valve, consists of three triangular cusps. The largest cusp is interposed between the AV orifice and the infundibulum and is termed the anterior (or infundibular) cusp. A second, posterior (or marginal) cusp is in relation to the right margin of the ventricle, and the third, medial (or septal) cusp is adjacent to the ventricular septum. The cusps are fibrous structures attached to a fibrous ring surrounding the AV orifice at the base to form a continuous annular membrane with their apices projecting into the ventricular cavity. The atrial surfaces are generally smooth, and their ventricular surfaces are often rough and irregular and, together with the apices and margins of the cusps, give attachment to several
delicate chordae that connect to trabeculae carnae of the right side. The tricuspid valve is often slightly more apically displaced than the corresponding left-sided AV valve.
delicate chordae that connect to trabeculae carnae of the right side. The tricuspid valve is often slightly more apically displaced than the corresponding left-sided AV valve.
The left-sided AV valve, the mitral valve, is a bicuspid valve that is a little smaller and more basally placed than the corresponding tricuspid valve. It also consists of fibrous tissue surrounded by a dense fibrous ring, covered by the lining membrane of the heart. The two triangular cusps are of unequal size and are larger, thicker, and stronger than those of the tricuspid valve. The larger cusp is placed in front and to the right between the AV and aortic orifices and is known as the anterior cusp; the smaller posterior cusp is placed behind and to the left of the opening. Similar to the tricuspid valve, there are chordae tendineae that attach the body and tips of both cusps to the anterolateral and posteromedial papillary muscles in the left ventricle; however, the chordae tendineae are thicker, stronger, and less numerous than on the right.
The pulmonary semilunar valve directs blood flow from the right ventricle into the main pulmonary artery. The valve consists of three cusps, two in front and one behind, again consisting of fibrous tissue. They are officially designated as right, left, and anterior for their positions in the fetal heart but are sometimes termed right anterior, posterior, and left anterior cusps, respectively, for their positions in the adult heart. They are attached by their convex margins to the wall of the artery at its junction with the ventricle, with their free borders directed upward toward the lumen of the vessel. The free and attached margins of each are strengthened by tendinous fibers, and the former presents, at its middle, a thickened nodule (corpus Arantii). From this nodule, tendinous fibers radiate through the segment to its attached margin but are absent from two narrow crescentic portions, the lunulae, placed one on either side of the nodule immediately adjoining the free margin. Between the semilunar cusps and the wall of the pulmonary artery are the three sinuses.
The aortic semilunar valve directs blood flow from the left ventricle into the aorta. The valve consists of three cusps, which are often referred to for their relationship to the orifices of the coronary sinuses; two are anterior (right coronary and left coronary), and one is posterior (noncoronary). They are similar in structure and mode of attachment to the pulmonary semilunar valves but are larger, thicker, and stronger; the lunulae are more distinct, and the noduli or corpora Arantii thicker and more prominent. Opposite the valve, the aortic root consists of the sinuses of Valsalva and sinotubular junction, which separates the sinuses from the tubular portion of the aorta (31).
Coronary Arteries and Veins
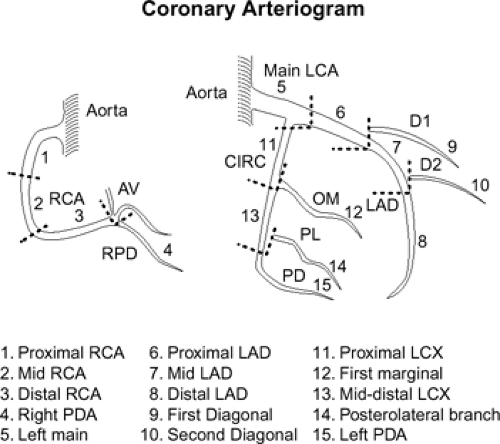
Each coronary artery arises from the corresponding aortic sinus. A segmentation scheme for the coronary arteries is shown in Figure 1-23 (33). The left main artery arises from the left coronary sinus, is 5 to 10 mm long, and is constant in diameter. It passes leftward posterior to the pulmonary trunk and usually bifurcates into the left anterior descending (LAD) and the left circumflex (LCX) arteries, although it sometimes trifurcates to include a ramus intermedius. The LAD courses in the anterior interventricular groove and terminates near the apex of the heart, supplying numerous septal perforators to the interventricular septum and a variable number of diagonal branches to the anterolateral wall of the left ventricle. The proximal LAD is the portion proximal to and including the origin of the first major septal perforator branch. The mid segment of the LAD corresponds to the segment immediately distal to the origin of the first major septal perforator branch and extending approximately one half the distance to the apex of the heart (coinciding or close to the origin of the second diagonal branch). The distal segment of the LAD runs along the interventricular groove from the end of the mid segment and usually extending beyond the apex. The LCX in turn courses along the left AV groove, providing a variable number of obtuse marginal branches to supply the lateral wall. Some institutions, depending on the location of the first marginal branch, may refer to this branch as the high lateral branch of the circumflex, with subsequent branches named lateral or posterolateral branches, depending on their destination. The LCX continues in the AV groove for a variable distance. The LCX may be segmented as proximal (from the origin off the left main to and including the origin of the first major obtuse marginal branch), and distal or AV LCX (distal to the origin of the major obtuse marginal branch and running along or close to the posterior left AV groove), which may be very small caliber. In patients with a left dominant system, the LCX reaches the posterior interventricular groove and gives rise to a posterior descending artery (PDA) branch. The ramus intermedius, if present, has a course similar to that of the first diagonal branch of the LAD. For nomenclature purposes, the septal, diagonal, and obtuse marginal branches are sequentially numbered as they arise from each respective vessel.
The right coronary artery (RCA) arises from the right coronary sinus and runs rightward posterior to the pulmonary outflow tract and then inferiorly in the right AV groove toward the posterior interventricular groove, providing atrial branches (to the right atrium) and marginal branches (to the right ventricle), including the acute marginal branch, which arises at the junction of the mid and distal RCA. The RCA is often segmented as proximal (first one half of the distance to the acute margin of the heart), mid (latter one half of the distance to the acute margin of the heart), and distal (portion running along the posterior right AV groove, from the acute margin of the heart to the origin of the PDA). The first branch of the RCA is usually the conus branch, which runs superiorly and supplies the RV outflow tract (RVOT); this branch can also have a separate origin directly from the right coronary sinus 50% of the time (34). The sinus node artery also arises from the proximal RCA in 60% of individuals (otherwise a left atrial branch of the LCX serves this function) and runs superiorly and posteriorly. In patients with a right dominant system, the distal RCA divides into the PDA and posterior LV branches. Dominance refers to which artery gives off a PDA to supply the posterior part of the heart. About 85% of patients are right dominant, 7% are codominant, and 8% are left dominant. The PDA courses along the inferior interventricular groove, providing septal perforators to supply the inferior septum (34).
Most of the veins of the heart drain into the coronary sinus, a wide venous channel about 2.25 cm in length that runs from left to right in the posterior portion of the AV groove. The coronary sinus opens into the right atrium between the right AV orifice and the inferior vena cava orifice. The tributaries are the great, small, and middle cardiac veins; the posterior vein of the left ventricle; and the oblique vein of the left atrium. The great cardiac vein drains most of the area supplied by the left coronary artery system and begins at the apex of the heart, ascends in the anterior interventricular groove with the LAD artery, and
enters the left end of the coronary sinus. The left marginal vein is a tributary of the great cardiac vein and ascends along the left margin of the heart. The middle and small cardiac veins drain most of the area supplied by the RCA. The middle cardiac vein begins at the apex, ascending in the posterior interventricular groove with the PDA, and empties into the right side of the coronary sinus. The small cardiac vein runs in the right AV groove and, along with the right marginal vein, which ascends along the right margin of the heart, drains into the right side of the coronary sinus or directly into the right atrium. The posterior vein of the left ventricle runs along the diaphragmatic surface of the left ventricle and drains either directly into the coronary sinus or into the great cardiac vein. The oblique vein of the left atrium is a small vessel that descends obliquely posterior to the left atrium and opens into the left end of the coronary sinus. There are also several smaller cardiac veins that drain directly into the right atrium (31).
enters the left end of the coronary sinus. The left marginal vein is a tributary of the great cardiac vein and ascends along the left margin of the heart. The middle and small cardiac veins drain most of the area supplied by the RCA. The middle cardiac vein begins at the apex, ascending in the posterior interventricular groove with the PDA, and empties into the right side of the coronary sinus. The small cardiac vein runs in the right AV groove and, along with the right marginal vein, which ascends along the right margin of the heart, drains into the right side of the coronary sinus or directly into the right atrium. The posterior vein of the left ventricle runs along the diaphragmatic surface of the left ventricle and drains either directly into the coronary sinus or into the great cardiac vein. The oblique vein of the left atrium is a small vessel that descends obliquely posterior to the left atrium and opens into the left end of the coronary sinus. There are also several smaller cardiac veins that drain directly into the right atrium (31).
Pulmonary Arteries and Veins
The pulmonary artery is a short, wide vessel, about 5 cm in length and 3 cm in diameter, which supplies deoxygenated blood from the right side of the heart to the lungs. It commonly arises from the conus arteriosus of the right ventricle and extends obliquely upward and posterior, passing at first in front and then to the left of the ascending aorta. The right branch of the pulmonary artery is longer and larger than the left, runs horizontally to the right, posterior to the ascending aorta and superior vena cava and in front of the right bronchus to the hilum of the right lung, where it divides into two branches. The larger, lower branch continues to the middle and lower lobes of the lung, and the smaller, upper branch distributes to the upper lobe. The left branch of the pulmonary artery is shorter and somewhat smaller than the right, passes horizontally anterior to the descending aorta and left bronchus to the hilum of the left lung, where it divides into two branches to supply each lobe of the left lung. The ligamentum arteriosum, a remnant of the ductus arteriosus, connects the pulmonary artery to the concavity of the aortic arch. The ligament of the left vena cava joins the pulmonary artery to the left upper pulmonary vein.
The pulmonary veins return oxygenated blood from the lungs to the left atrium of the heart. In general, there are four, two from each lung. The vein from the middle lobe of the right lung generally unites with the vein from the upper lobe prior to entering the left atrium, but occasionally the three veins on the right side may remain separate. Not infrequently, the left-sided veins may open into the left atrium via a common ostium. At the hilum of the lung, the superior pulmonary veins lie anterior and slightly inferior to the pulmonary artery. The right pulmonary veins pass behind the right atrium and superior vena cava, and the left pulmonary veins are in front of the descending aorta.
Pericardium and Myocardium
The pericardium is a double-walled sac surrounding the heart, composed of a serous membrane, the visceral pericardium, which directly overlies the external surface of the heart and epicardial fat, and a fibrocollagenous outer layer, the parietal pericardium, which separates the heart from other intrathoracic structures (35,36). The pericardial cavity is the potential space that lies between the parietal and visceral layers and normally contains about 15 to 50 mL of serous fluid, which allows the two membranes to slide smoothly over one another and thus permit free motion of the heart within the pericardial sac (37). The parietal pericardium is attached anteriorly via ligaments to the chest wall, posteriorly to the vertebral column, and inferiorly to the central tendon of the diaphragm. Superiorly, the fibrous pericardium blends with the adventitia of the great arteries. Posteriorly, it is more loosely attached to the esophagus and descending aorta. The pericardial space is limited superiorly by sleevelike attachments of the pericardium to the great arteries just distal to their origins. The short transverse sinus lies behind the great arteries, anterior to the atria and superior vena cava. Posteriorly, the pericardial space is also fixed at the insertions of the pulmonary veins and venae cavae. This posterior series of venous attachments forms a U-shaped arc that is concave inferiorly and creates a blind cul-de-sac behind the left atrium (the oblique pericardial sinus).
The heart consists of muscle fibers and fibrous rings that serve for their attachment. It is covered by the visceral layer of serous pericardium and lined by the endothelial membrane. Between these two membranes lies the muscular wall, or myocardium. The myocardium is often subdivided into endocardial (adjacent to the endothelial membrane), mid wall, and epicardial (adjacent to the visceral pericardium) layers.
Ischemic Heart Disease
Atherosclerotic heart disease remains one of the leading causes of morbidity and mortality worldwide. The accurate detection of coronary artery disease with its functional consequences at an early stage can significantly decrease morbidity and mortality associated with the disease process by guiding optimal patient management. Just as important is the accurate exclusion of individuals without significant coronary artery disease because unnecessary invasive testing with their inherent risks can ultimately be avoided. Hence, noninvasive imaging techniques have been developed and used extensively over the years for these purposes. The ultimate focus of nonimaging in ischemic heart disease is two-fold: (a) anatomic imaging to directly visualize the coronary arteries and associated atherosclerotic plaques and (b) functional imaging to assess the hemodynamic consequences of obstructive
coronary artery plaques. Until recently, reliable noninvasive anatomic imaging of the entire coronary artery tree was not possible because of limits in spatial resolution and cardiac motion. Currently, noninvasive coronary angiography can be performed using MR, MDCT, and EBCT. Functional imaging has traditionally been performed using stress nuclear [single photon emission computed tomography (SPECT) or positron emission tomography (PET)] and stress echocardiography techniques, but stress MR protocols are becoming more available and, hence, more frequent in clinical practice.
coronary artery plaques. Until recently, reliable noninvasive anatomic imaging of the entire coronary artery tree was not possible because of limits in spatial resolution and cardiac motion. Currently, noninvasive coronary angiography can be performed using MR, MDCT, and EBCT. Functional imaging has traditionally been performed using stress nuclear [single photon emission computed tomography (SPECT) or positron emission tomography (PET)] and stress echocardiography techniques, but stress MR protocols are becoming more available and, hence, more frequent in clinical practice.
Coronary Artery Imaging
Goals in the assessment of coronary artery disease include identification of flow-limiting coronary stenoses, and calcified plaques, direct visualization of atherothrombotic lesions, measurement of atherosclerotic burden, and characterization of plaque components (38). Noninvasive imaging of the coronary arteries for anatomic evaluation of atherosclerotic disease can be accomplished by MR or CT.
Calcium Scoring
Atherosclerotic coronary calcifications are often found in patients with long-standing coronary atherosclerosis. Elevated levels of coronary calcification have been shown to correspond to increased risk of myocardial events (39, 40, 41, 42). Current clinical indications for quantification of coronary calcium are in patients with atypical chest pain, as well as asymptomatic patients with traditional cardiovascular risk factors (43). Noncontrast CT is currently the only method available to accurately quantify the coronary calcium plaque burden. EBCT using an ECG-triggered acquisition of the entire heart performed with 3-mm contiguous slices has been considered the “gold standard” for assessment of calcified plaques (44). MDCT with retrospective ECG triggering using 3-mm slice thickness with 1.5 mm overlap has also been shown to be comparable to EBCT for the quantification of coronary calcification (45). Coronary artery calcium is assessed through the measurement of the number of pixels in the CT image with a density of 130 or more Hounsfield units (HU) to calculate a total calcium score (44), a calcium volumetric score (46), or an absolute calcium mass (47) (Fig. 1-24). Each method has shown similar reproducibility (45,48,49), and most software processing programs can easily provide all three scores simultaneously. A high coronary calcium score is a sensitive but nonspecific marker for obstructive coronary artery disease, and changes in the calcium score have not been shown to correspond to changes in cardiovascular event risk (43).
Coronary Angiography
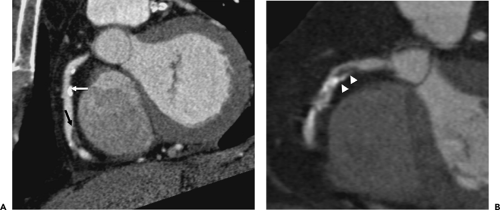
Noncalcified atherosclerotic plaques in the coronary arteries can be visualized using contrast enhanced CT or MR. With the superior spatial resolution obtained by MDCT (0.4 to 1 mm) compared with EBCT (1.5 mm), clinical evaluation for noncalcified coronary atherosclerosis commonly utilizes MDCT technology. The general imaging protocol has already been described, and aggressive use of beta-blockers to decrease the HR to less than 65 beats per minute has been shown to greatly improve image quality by diminishing image artifact related to cardiac motion (50, 51, 52). The high spatial resolution and soft tissue delineation may also provide information about the content of atherosclerotic plaques and coronary artery wall (53), including distinction between low-density lipid-rich (47 ± 9 HU) versus higher density fibrous (104 ± 28 HU) plaques (54,55). Several studies have demonstrated the high sensitivity (72% to 99%) and specificity (86% to 97%) and particularly the high negative predictive value (97% to 100%) of MDCT for the detection of significant coronary artery disease (52,56, 57, 58, 59, 60, 61) (Fig. 1-25). More importantly, with an increasing number of detectors and faster
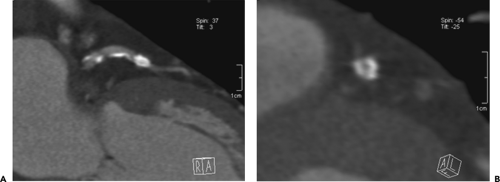
gantry speeds leading to an improvement in image resolution, there has been a significant increase in the number of evaluable segments than with early-generation scanners. The presence of coarse calcifications with related blooming and streak artifact, however, still remains problematic in regard to accurate interpretation for degree of luminal narrowing (Fig. 1-26).
gantry speeds leading to an improvement in image resolution, there has been a significant increase in the number of evaluable segments than with early-generation scanners. The presence of coarse calcifications with related blooming and streak artifact, however, still remains problematic in regard to accurate interpretation for degree of luminal narrowing (Fig. 1-26).
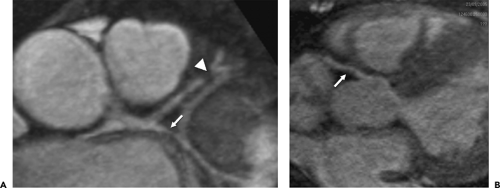
Coronary artery MR angiography has been one of the most challenging areas of cardiovascular MR because of the small size and tortuosity of the coronary arteries, their near constant motion during both respiratory and cardiac cycles, and the adjacent epicardial fat and myocardium (62). Numerous technical improvements and innovations have been made since the first clinical results were presented in 1993, and coronary MR imaging has matured from breath-hold 2D gradient-echo imaging to navigator-based methods using targeted 3D gradient-echo, followed by targeted 3D steady-state free precession, to most recently volumetric “whole heart” approaches mimicking that of cardiac CT. A recent meta-analysis evaluating coronary MR angiography for detection of coronary artery disease demonstrated moderately high sensitivity and specificity (73% and 86%, respectively) for evaluable vessel segments that were commonly limited to the proximal and mid segments (63) (Fig. 1-27). In the only international multicenter trial, coronary MR angiography demonstrated high sensitivity
(100%) and negative predictive value (100%) with modest specificity (85%) for detection of significant coronary artery disease in interpretable proximal and middle coronary artery segments (64). Of concern is the fact that 69% to 100% of proximal and mid segments were considered interpretable in these studies, and the inclusion of the unevaluable segments lowers the overall diagnostic accuracy. Additionally, several groups have reported on MR of the coronary vessel wall for plaque characterization. Although current data demonstrate the potential clinical utility and high potential usefulness of coronary vessel wall imaging for evaluation of coronary artery disease (65, 66, 67), visualization of plaque components such as the fibrous cap is currently not possible because of limited spatial resolution (68). Hence, based on the data to date, coronary artery MR angiography for the identification of focal coronary artery stenosis has been limited to the evaluation of left main or multivessel disease.
(100%) and negative predictive value (100%) with modest specificity (85%) for detection of significant coronary artery disease in interpretable proximal and middle coronary artery segments (64). Of concern is the fact that 69% to 100% of proximal and mid segments were considered interpretable in these studies, and the inclusion of the unevaluable segments lowers the overall diagnostic accuracy. Additionally, several groups have reported on MR of the coronary vessel wall for plaque characterization. Although current data demonstrate the potential clinical utility and high potential usefulness of coronary vessel wall imaging for evaluation of coronary artery disease (65, 66, 67), visualization of plaque components such as the fibrous cap is currently not possible because of limited spatial resolution (68). Hence, based on the data to date, coronary artery MR angiography for the identification of focal coronary artery stenosis has been limited to the evaluation of left main or multivessel disease.
In patients undergoing potential revascularization, it is important to report also on the status of plaques in the ascending aorta and supra-aortic vessels due to the potential risk of embolic stroke related to both catheter-based and surgical procedures. Additionally, the presence of aortic aneurysm or dissection in the proximal aorta should also be noted for patients undergoing surgical revascularization because bypass grafts will often be anastomosed in the aortic wall. It is also useful to note anomalies in the internal mammary arteries, which may be used for graft conduits, and concomitant aortic valve disease, which can be repaired at the time of surgery (69).
Functional Myocardial Imaging
Functional imaging focuses on the assessment of the hemodynamic consequences of coronary artery disease. Although coronary artery angiography (invasive or noninvasive) can depict an anatomic view of the coronary arteries for assessment of coronary artery disease, the effects that such plaques have on the myocardial territory supplied by the affected artery is important. Atheromatous plaques that cause obstruction of less than 70% of the luminal diameter of the vessel rarely cause symptoms of obstructive coronary artery disease. As the plaques grow in thickness and obstruct more than 70% of the vessel diameter, patients may experience symptoms of ischemic heart disease. These symptoms are often initially noted only during increased workload of the heart and manifest as exertional angina or decreased exercise tolerance. As the degree of luminal narrowing increases, there may be near complete obstruction of the coronary artery lumen, severely restricting blood flow to the myocardium. Patients with this degree of coronary artery luminal narrowing may suffer from myocardial infarction or have signs and symptoms of chronic coronary ischemia, including symptoms of rest angina and congestive heart failure.
The myocardium can exist in several different states, depending on the status of the supplying coronary artery. Limitation of blood flow to the heart causes ischemia of the myocytes. Prolonged lack of blood flow to the myocardium eventually leads to myocyte death and myocardial infarction. Functional imaging relies on the myocardial assessment for regional perfusion or wall motion abnormalities at rest or induced during stress. A myocardial territory may be described as normal, ischemic, stunned, hibernating, or infarcted (scarred). Ischemia induction is based on the principle that although resting myocardial blood flow in territories supplied by a stenotic coronary artery is normal with preserved regional function, the increased flow demand during stress conditions cannot be met, resulting in a sequence of events referred to as the ischemic cascade (70)
(Fig. 1-28). Initially perfusion abnormalities are induced, followed by diastolic and systolic dysfunction. Clinical symptoms of angina are a relatively late phenomenon of the cascade. Hence, preclinical detection of inducible myocardial ischemia is an important feature of noninvasive imaging in the diagnosis of coronary artery disease. Additionally, in the setting of recent ischemia or chronic ischemia, regional myocardial function may become depressed, resulting in stunned (transient dysfunction) or hibernating (prolonged dysfunction) states without overt myocardial infarction. Because stunned or hibernating myocardium may normalize after revascularization of the involved regions, as opposed to regions with myocardial infarction, the distinction between these myocardial states is an important one (71, 72, 73).
(Fig. 1-28). Initially perfusion abnormalities are induced, followed by diastolic and systolic dysfunction. Clinical symptoms of angina are a relatively late phenomenon of the cascade. Hence, preclinical detection of inducible myocardial ischemia is an important feature of noninvasive imaging in the diagnosis of coronary artery disease. Additionally, in the setting of recent ischemia or chronic ischemia, regional myocardial function may become depressed, resulting in stunned (transient dysfunction) or hibernating (prolonged dysfunction) states without overt myocardial infarction. Because stunned or hibernating myocardium may normalize after revascularization of the involved regions, as opposed to regions with myocardial infarction, the distinction between these myocardial states is an important one (71, 72, 73).
Currently, functional imaging can be performed using gated SPECT or PET, contrast stress echocardiography, and MR, and depending on the imaging protocol utilized, an assessment of perfusion and/or function can be made at rest and during stress conditions. In addition to evaluation for inducible ischemia, distinction between dysfunctional but viable (stunned or hibernating) myocardium and dysfunctional, nonviable (scarred) myocardium can be assessed with all these techniques, depending on the imaging protocol. MDCT thus far has not played an important clinical role in functional imaging assessment of the myocardium, although investigational work is in progress.
Myocardial Stress Perfusion Assessment
Myocardial perfusion assessment with MR relies on the concept that first passage of gadolinium contrast into the heart reflects delivery at the myocardial level. Under normal circumstances, there is uptake of gadolinium contrast in all regions of the heart, which temporarily shortens T1 relaxation time and thereby increases the signal intensity of the perfused myocardium. In regions with inadequate blood supply either from significant epicardial coronary artery stenosis or microvascular obstruction at the capillary level, there will be a delay in contrast delivery, with resultant dark or hypoenhanced regions when compared with normally enhanced myocardium. After about 1 to 3 minutes, microvascular obstruction can be detected. After about 10 minutes, depending on the amount of gadolinium administered, delayed enhancement in areas of infarction or fibrosis can be demonstrated. Unlike standard SPECT or PET assessment of myocardial perfusion, the high spatial resolution (approximately 2 mm) of MR allows distinction between subendocardial and transmural perfusion defects (Fig. 1-29). Perfusion assessment is ideally performed under both pharmacologic stress and rest conditions. Currently, physiologic stress testing is not possible with MR. Stress MR perfusion has an overall sensitivity of 84% and specificity of 85% for the detection of coronary artery disease (74) and appears to be more sensitive for the detection of myocardial ischemia compared with nuclear imaging techniques (75).
Pharmacologic stress is often performed using a potent vasodilator, either adenosine or dipyridamole. Adenosine has the advantage of being very fast acting, with a half-life of 4 to 10 seconds. Adenosine is typically administered at a rate of 140 μg/kg/min over a 4- to 6-minute infusion, depending on the protocol. First pass perfusion imaging using a bolus injection of gadolinium-based contrast agent at a dose of 0.05 to 0.2 mmol/kg and a rate of 4 to 7 mL/sec is usually performed after 3 minutes of adenosine infusion, at which point maximum vasodilation and steady state have been achieved. Patients often experience shortness of breath, chest tightness, and occasional palpitations or headaches, which resolve quickly once the medication is stopped. Because gadolinium perfusion imaging is performed during the adenosine infusion, two sites of intravenous access or connector tubing setup need to be in place during the study. Dipyridamole has the advantage of being less expensive and easier to administer than adenosine, with fewer side effects, but it has a longer half-life. Dipyridamole is typically administered at a dose of 0.56 μg/kg over a 4-minute infusion. First pass perfusion imaging is performed 7 minutes after the start of dipyridamole administration, when peak vasodilation has occurred. In patients unable to tolerate the side effects of dipyridamole, aminophylline (50 to 100 mg) can be given to reverse the effects. Both stress agents should be avoided in patients with asthma or high-degree AV blocks. In addition, caffeine and medications containing aminophylline and/or theophylline should be withheld for at least 24 hours prior to the exam because of their interaction with these agents. Hemodynamic and rhythm monitoring is required during administration of the stress agent.
Because the goal of myocardial perfusion assessment is to measure the gadolinium concentration in the blood and in the myocardium, single-shot images are acquired during each cardiac cycle to cover as much myocardium as possible (5 to 8 slices in short axis orientation) while maintaining high spatial and temporal resolution. Challenges with this technique are to reduce the acquisition time per image to avoid blurring and artifact related to cardiac motion. The use of parallel acquisition technology can help reduce
acquisition time. Following image acquisition, in most clinical settings, a qualitative visual assessment of perfusion is made (Fig. 1-29). This provides a quick and easy method of image interpretation with overall sensitivity of 93% and specificity of 63%, which is comparable to SPECT. Quantitative assessment in the ideal examination would be to measure the actual myocardial blood flow within each segment of the heart. This assessment can be made by examining the change in signal intensity over time, gradient of the upslope, peak signal intensity, and the time to peak (Fig. 1-29). The myocardial perfusion reserve index can be quantified by differences between myocardial perfusion reserve in the stress and rest studies (76, 77, 78).
acquisition time. Following image acquisition, in most clinical settings, a qualitative visual assessment of perfusion is made (Fig. 1-29). This provides a quick and easy method of image interpretation with overall sensitivity of 93% and specificity of 63%, which is comparable to SPECT. Quantitative assessment in the ideal examination would be to measure the actual myocardial blood flow within each segment of the heart. This assessment can be made by examining the change in signal intensity over time, gradient of the upslope, peak signal intensity, and the time to peak (Fig. 1-29). The myocardial perfusion reserve index can be quantified by differences between myocardial perfusion reserve in the stress and rest studies (76, 77, 78).
Myocardial Stress Systolic Function Assessment
Global and regional systolic LV function can be assessed by MR. Gradient-echo techniques demonstrate clear endocardial border definition, which is important in the assessment for regional wall thickening (Fig. 1-11). Myocardial tagging techniques can be used to track segmental motion and help in directly distinguishing impaired myocardium from myocardium that may move abnormally owing to proximal tethering to a diseased area (Fig. 1-12). Myocardial tagging techniques can be used to further depict regional strain for improved quantification of wall motion abnormalities. A tomographic approach allows for measurement of ventricular volumes without geometric assumptions, resulting in accurate measurements for severely distorted ventricles. Similar to perfusion assessment, cine MR images are obtained under pharmacologic stress (primarily dobutamine) and rest conditions. Dobutamine MR has an overall sensitivity of 83% to 89% and specificity of 81% to 86% for the detection of significant coronary artery disease (79, 80, 81).
Pharmacologic stress is commonly performed using dobutamine because it has both chronotropic and inotropic properties and mimics physiologic stress. Dobutamine is commonly infused starting at a rate of 10 μg/ kg/min and is gradually increased by 10 μ/kg in 3-minute increments to a rate of 40 μg/kg/min. Atropine (up to 2 mg) may be given if target HR is not achieved with dobutamine infusion alone and the patient has no contraindications to atropine. Evaluation for regional wall motion abnormalities is made using cine MR sequences with or without myocardial tissue tagging during each stage of infusion. Myocardial function and contractility should normally increase with each stage of infusion. Myocardial
segments with stress-induced (or worsened) wall motion abnormalities reflect ischemia of the involved segments.
segments with stress-induced (or worsened) wall motion abnormalities reflect ischemia of the involved segments.
Myocardial Viability Assessment
The incidence of heart failure has been increasing over the past several decades, in part due to improvements in cardiac survival. Coronary artery disease represents the underlying cause of heart failure in more than 70% of patients (82). Current therapeutic options for these patients include optimization of medical treatment, heart transplantation, revascularization (with optional LV restoration and/or mitral valve repair), and cardiac resynchronization therapy (83). Viability assessment is important in guiding therapeutic options because patients with viable myocardium may improve in LV function and overall mortality after revascularization, whereas patients with only scar tissue often will not improve (84). In view of the potential risks inherent in surgical and percutaneous revascularization techniques, optimal selection of patients most likely to benefit from the procedure is warranted. Traditionally, viability assessment was performed using nuclear imaging techniques (SPECT and PET) to assess myocardial metabolism, perfusion, cell membrane and mitochondrial integrity, and echocardiography to assess contractile reserve. Given the high spatial resolution provided by MR, which allows distinction between subendocardial and transmural processes, as well as the additional information needed to optimize revascularization strategies (LV function, volumes, aneurysms, intracavitary thrombus, concomitant mitral regurgitation), viability assessment by MR has become a valuable tool for the evaluation of patients with ischemic cardiomyopathy.
Several studies have noted that LV dysfunction is not necessarily an irreversible process but that improvement in LV function is possible after revascularization. Over the years, many studies have focused on identifying dysfunctional but viable myocardium to predict improvement of function post-revascularization. Although viable myocardium theoretically includes the entire spectrum ranging from normal myocardium to epicardial regions of viable myocardium in non-transmural infarction, the term viability is only important in regions with chronic contractile dysfunction where there may be an improvement in function with revascularization. This has often been referred to as hibernating myocardium, a situation in which there is chronic hypoperfusion (85) or repetitive stunning (86) that results in the chronic dysfunction. Several MR techniques have been proposed for the assessment of myocardial viability. These techniques include resting cine MR for evaluation of end-diastolic wall thickness (EDWT), low-dose dobutamine MR for evaluation of contractile reserve, first pass perfusion MR for evaluation of contrast uptake kinetics, and delayed contrast enhanced MR for evaluation of scar tissue (Fig. 1-30).
The use of EDWT as a marker of viability is based on the finding that in the presence of extensive transmural infarction, significant wall thinning occurs (87).
Recent studies have shown that segments with EDWT less than 5.5 mm virtually never show recovery of function post-revascularization. However, segments with EDWT of 5.5 mm or more may or may not improve in function post-revascularization because they frequently contain an admixture of subendocardial scar tissue with residual viability in the epicardial layers. Overall, however, using EDWT to predict functional recovery has a good sensitivity, 94% to 100%, but low specificity, 19% to 53% (88, 89, 90).
Recent studies have shown that segments with EDWT less than 5.5 mm virtually never show recovery of function post-revascularization. However, segments with EDWT of 5.5 mm or more may or may not improve in function post-revascularization because they frequently contain an admixture of subendocardial scar tissue with residual viability in the epicardial layers. Overall, however, using EDWT to predict functional recovery has a good sensitivity, 94% to 100%, but low specificity, 19% to 53% (88, 89, 90).
In addition to EDWT, the presence of contractile reserve is frequently used to detect viable myocardium. This can be accomplished by the administration of low-dose dobutamine 5 to 10 μg/kg/min to assess for improvement of contraction in dysfunctional myocardium. An increase in systolic wall thickening greater than 2 mm during dobutamine infusion has been shown to be a reliable marker for post-revascularization improvement in function (90). Overall, dobutamine MR demonstrates high specificity with slightly lower sensitivity for assessment of contractile reserve, with a mean sensitivity of 73% (50% to 89%) and a mean specificity of 83% (70% to 95%) (83).
Hypoperfused regions on resting first pass perfusion studies have also been used to assess myocardial viability. As previously mentioned, areas with inadequate blood supply will often not enhance as normal myocardium. Dysfunctional regions that display hypoenhancement on resting first pass perfusion imaging showed high specificity (89%) but low sensitivity (19%) for predicting functional recovery after revascularization (91, 92, 93).
Myocardial contrast hyperenhancement of infarct regions, defined as increased signal intensity on delayed resting T1-weighted MR images acquired more than 5 minutes after intravenous administration of contrast, was first described more than 20 years ago. However, improvements in pulse sequence design have led to a nearly 500% increase in signal intensity between abnormal hyperenhanced regions of myocardium and normal myocardium (94). These regions of hyperenhancement show excellent anatomic agreement with the histologic extent of necrosis (95). The mechanism underlying the hyperenhancement depends on the age of the infarction. In acute infarcts, there is loss of sarcolemmal membrane integrity and rupture of myocyte membranes, which lead to increased tissue-level contrast concentration. In chronic infarcts, there is trapping of the contrast agent within the interstitial space that is increased between collagen fibers commonly seen in scar tissue, compared with densely packed myocytes in normal myocardium, as well as delayed washout of contrast due to decreased capillary density. The major advantage of MR over other imaging techniques is the superior spatial resolution that allows detection and differentiation of subendocardial infarction from transmural infarction and normal myocardium. Because delayed enhancement MR represents anatomic visualization of scar tissue, the accuracy of this technique for predicting functional recovery depends on the cutoff value used for extent and transmurality of the scarred segment. Using a cutoff value of 50% transmurality, this technique shows high sensitivity (91% to 99%) and low specificity (37% to 54%) for predicting post-revascularization improvement in function (83). The suboptimal specificity is related to the presence of segments with subendocardial infarct and epicardial viability that do not improve function, and more information regarding the constitution of the epicardial regions is needed to predict actual functional improvement with revascularization (83).
Special Considerations
Assessment of Stent Patency
With the growth of nonsurgical revascularization techniques, the increase in the number of patients with coronary artery disease who receive coronary artery stents has been enormous (96,97). Hence, early identification of in-stent stenosis is important in the management of these patients. MDCT has shown variable success for evaluation of in-stent stenosis, with steady improvements noted when using newer 64-slice systems offering improvement in spatial resolution and using dedicated reconstruction kernels (97, 98, 99, 100, 101, 102, 103, 104, 105). However, the variability of stent lumen visibility is still high, depending on the stent type, size, orientation, and surrounding tissue (Fig. 1-31). Sharp reconstruction kernels in addition to the routine medium kernels may provide improvement in visible lumen diameter as well as more realistic intraluminal attenuation values (96,97). Because of their metallic composition, currently manufactured stents cause susceptibility artifacts that often obscure the stent lumen in MR (106, 107, 108). However, MR-compatible stents based on copper alloy have been developed and are being tested in animal models (109,110).
Assessment of Bypass Grafts
Surgical revascularization of coronary artery disease is accomplished by coronary artery bypass grafting, in which a graft (arterial or venous) is used to bypass an occluded or stenosed coronary artery. In comparison with the native coronary arteries, reversed saphenous vein and internal mammary artery grafts are easier to visualize owing to the reduced overall motion, larger lumen, and less convoluted course. Familiarity with the common types of grafts used and placement can aid in both planning and interpretation of images. A simple classification scheme is shown in Table 1-4 and Figure 1-32. Venous conduits are generally wider and longer than their arterial counterparts but have reduced long-term patency.
With the MDCT technique, special considerations must be taken into account during data acquisition. Because most patients have an in situ mammary artery graft, image acquisition must cover the entire thorax to visualize the proximal anastomosis and origin of the internal mammary arteries.
Given the larger volume of coverage, adjustments in contrast dose and scan delay timing after contrast administration should be made to ensure adequate contrast enhancement of the bypass grafts and native coronary artery vessels during image acquisition. MDCT has been shown to have high sensitivity (97% to 100%) and specificity (98%) for diagnosing graft occlusion, although somewhat lower sensitivity (75% to 82%) and specificity (88% to 92%) for detecting significant stenoses (Fig. 1-33) (111,112).
Given the larger volume of coverage, adjustments in contrast dose and scan delay timing after contrast administration should be made to ensure adequate contrast enhancement of the bypass grafts and native coronary artery vessels during image acquisition. MDCT has been shown to have high sensitivity (97% to 100%) and specificity (98%) for diagnosing graft occlusion, although somewhat lower sensitivity (75% to 82%) and specificity (88% to 92%) for detecting significant stenoses (Fig. 1-33) (111,112).
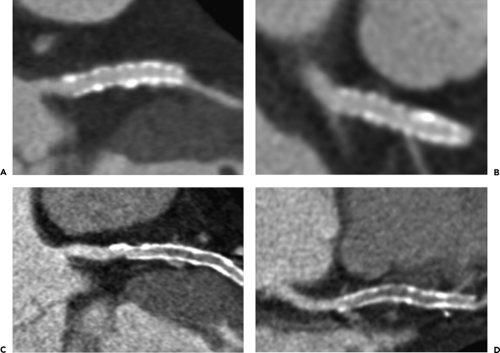 Figure 1-31 Oblique multiplanar reconstructed CT images demonstrating patent (A, B) and occluded (C, D) stents. |
Table 1-4 Bypass Graft Typesa | ||||||||||||
|---|---|---|---|---|---|---|---|---|---|---|---|---|
| ||||||||||||
Given a schematic knowledge of the origin and touchdown site of each graft in question, conventional free-breathing ECG gated 2D spin-echo and gradient-echo MR
sequences in the transverse plane have been used to reliably assess bypass graft patency with a sensitivity of 90% to 100% and specificity of 72% to 100% (113, 114, 115, 116). Patency is generally determined by visualization of a patent graft lumen in at least two contiguous transverse levels along its expected course (signal void for spin-echo techniques and bright signal for gradient-echo techniques). If a patent graft lumen is not visualized at any level, then the graft is considered occluded. Contrast-enhanced MR techniques and 3D noncontrast approaches show slight improvements in diagnostic accuracy (117, 118, 119, 120), and phase-velocity mapping or flow reserve assessment may be superior to graft imaging (121). However, limitations of MR bypass graft assessment include difficulties related to artifact due to implanted metallic objects such as hemostatic clips, ostial stainless steel graft markers, sternal wires, coexistent prosthetic valves with supporting struts or rings, and graft stents. Additionally, information on the ability to identify severely diseased but patent grafts is limited, although targeted 3D coronary MR angiography techniques appear to provide excellent results for identifying focal stenoses (122).
sequences in the transverse plane have been used to reliably assess bypass graft patency with a sensitivity of 90% to 100% and specificity of 72% to 100% (113, 114, 115, 116). Patency is generally determined by visualization of a patent graft lumen in at least two contiguous transverse levels along its expected course (signal void for spin-echo techniques and bright signal for gradient-echo techniques). If a patent graft lumen is not visualized at any level, then the graft is considered occluded. Contrast-enhanced MR techniques and 3D noncontrast approaches show slight improvements in diagnostic accuracy (117, 118, 119, 120), and phase-velocity mapping or flow reserve assessment may be superior to graft imaging (121). However, limitations of MR bypass graft assessment include difficulties related to artifact due to implanted metallic objects such as hemostatic clips, ostial stainless steel graft markers, sternal wires, coexistent prosthetic valves with supporting struts or rings, and graft stents. Additionally, information on the ability to identify severely diseased but patent grafts is limited, although targeted 3D coronary MR angiography techniques appear to provide excellent results for identifying focal stenoses (122).
Other Myocardial Disease
Hypertrophic Cardiomyopathy
Hypertrophic cardiomyopathy refers to the condition in which there is inappropriate myocardial hypertrophy in the absence of an obvious cause (e.g., aortic stenosis or hypertension). Histologically, the disease is characterized by disorganization and malalignment of the myofibrils (123). The disease is genetically transmitted in about half of the cases. The natural history is variable but is a cause of sudden death due to ventricular arrhythmias (124). The magnitude of LV wall thickness has been shown to correlate with the risk for sudden death (125,126).
Stay updated, free articles. Join our Telegram channel

Full access? Get Clinical Tree


