Diffuse Lung Disease
Despite the well-established role of chest radiography in accurately and inexpensively displaying a wide range of pulmonary parenchymal pathology, equally well established limitations have been documented (1, 2, 3). In one study of 458 patients with histologically confirmed infiltrative lung disease, 44, or nearly 10%, had normal prebiopsy chest radiographs (1). In a second study (2), nearly 16% of patients who had pathologic proof of interstitial lung disease had normal chest radiographs. When present, the radiographic abnormalities are frequently nonspecific (4, 5, 6), and considerable interobserver variation is found in the interpretation of the findings, even among expert readers (4). A number of studies have shown that CT, particularly high-resolution CT (HRCT), is superior to chest radiography in the detection of parenchymal abnormalities, is more accurate in the differential diagnosis, and is subject to considerably less interobserver variation in its interpretation (3,5, 6, 7).
Optimal assessment of diffuse lung disease on CT is obtained by minimizing volume averaging by using thin
collimation (0.5- to 2-mm thick sections) and by enhancing the contrast between adjacent structures by using a high spatial frequency reconstruction algorithm. The combination of thin-section and high-frequency reconstruction algorithm is known as high-resolution computed tomography (HRCT). HRCT provides a depiction of lung morphology comparable to that of gross (macroscopic) lung pathology. Since it was first described in 1982 (8), until recently, HRCT was typically obtained at 10- to 20-mm intervals through the chest. The advent of multidetector CT scanners in the late 1990s has allowed volumetric imaging of the entire lung by using high-resolution CT technique. Volumetric imaging allows detection of abnormalities that might have been missed between HRCT sections and high-resolution multiplanar and three-dimensional reconstructions. Advantages derived from volumetric imaging, however, must be weighed against added reconstruction and postprocessing times, as well as storage requirements for as many as several hundred additional images. Consideration must also be given to any potential added radiation dose, especially in young women and children.
collimation (0.5- to 2-mm thick sections) and by enhancing the contrast between adjacent structures by using a high spatial frequency reconstruction algorithm. The combination of thin-section and high-frequency reconstruction algorithm is known as high-resolution computed tomography (HRCT). HRCT provides a depiction of lung morphology comparable to that of gross (macroscopic) lung pathology. Since it was first described in 1982 (8), until recently, HRCT was typically obtained at 10- to 20-mm intervals through the chest. The advent of multidetector CT scanners in the late 1990s has allowed volumetric imaging of the entire lung by using high-resolution CT technique. Volumetric imaging allows detection of abnormalities that might have been missed between HRCT sections and high-resolution multiplanar and three-dimensional reconstructions. Advantages derived from volumetric imaging, however, must be weighed against added reconstruction and postprocessing times, as well as storage requirements for as many as several hundred additional images. Consideration must also be given to any potential added radiation dose, especially in young women and children.
In this chapter, we review the CT techniques that are appropriate for the evaluation of diffuse lung disease, the various patterns of abnormality seen on CT, and the role of CT in the assessment of these patients. The role of CT in the evaluation of focal lung disease was considered in Chapter 6.
General Principles and Methodology
The diagnostic efficacy of CT in the evaluation of diffuse lung disease is inextricably tied to scan technique. Accurate diagnosis requires that a variety of protocols that specifically reflect a wide range of clinical indications be established.
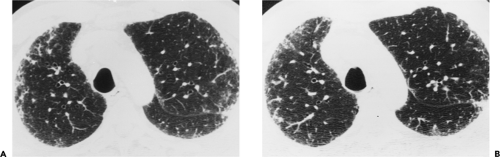 Figure 8-1 Low-dose high-resolution CT (HRCT). A: HRCT (1.5-mm collimation) performed at the level of the aortic arch by using 120-kV, 200-mA, and 2-second scan. Mild parenchymal abnormalities are present in the subpleural lung regions, consisting of irregular interfaces and small irregular lines. B: HRCT (1.5-mm collimation) obtained at the same level by using 120-kV, 40-mA, and 2-second scan shows the findings equally well. Increased noise is present posteriorly in the paraspinal region, but this does not affect the diagnostic quality of the image. The patient was a 71-year-old man with idiopathic pulmonary fibrosis. |
The essential elements of HRCT are acquisition of thin sections (0.5 to 2 mm) and use of a high–spatial frequency (edge-enhancing) reconstruction algorithm. Further im-provement in spatial resolution can be obtained with the use of targeted reconstructions with field of view (FOV) restricted to individual lungs (9). Routinely, images are acquired with the shortest possible scan time by using a 512 × 512 matrix, with milliamperage (mA) typically varying between 200 and 300, depending on the patient’s size. It should be noted that considerable dose reduction, to as low as 40 mAs, still allows acquisition of interpretable images of the lung parenchyma on HRCT (Fig. 8-1) (10). Although low-dose HRCT technique allows better assessment of lung parenchyma than the chest radiograph (7), it has been reported that mild ground-glass attenuation, emphysema, and fibrosis detectable on conventional-dose HRCT can be missed on low-dose HRCT (Fig. 8-2) (7,10,11). As the frequency with which these limitations occur clinically has not been definitively established, higher milliamperage settings are recommended in the initial assessment of most patients. However, reduced-milliamperage HRCT should be used whenever feasible in the evaluation of response to treatment or disease progression, especially in patients in whom radiation dose is a major concern. This has become an especially important issue as multiple follow-up CT studies are now increasingly used to monitor patients with diffuse lung disease.
Optimal technical parameters for individual images have been described (7,9, 10, 11, 12) but no general agreement exists as to what constitutes an acceptable high-resolution study. Individual reports differ strikingly in overall technique, especially in determining the number and levels of necessary scans and the indications for both prone and supine images as well as those obtained in expiration.
Two major alternative approaches are currently used in the assessment of patients with diffuse lung disease: HRCT performed at preselected levels and volumetric HRCT
through the chest. In the first approach, HRCT is performed at preselected levels chosen to maximize evaluation of the different lung zones. There is no consensus, however, about the number of HRCT scans required for an adequate assessment of the lung parenchyma. Different investigators have used HRCT scans at 1-cm, 2-cm, and even 4-cm intervals with the patient supine, prone, or both supine and prone (13, 14, 15). We consider scans obtained at 1-cm intervals, from the lung apices to the bases, to be the most appropriate scanning protocol for HRCT performed at preselected levels because it allows complete sampling of the lung and lung disease, regardless of its distribution. The main advantage of HRCT at preselected levels is to reduce radiation exposure and, in some cases, cost (16). The main disadvantages are that focal parenchymal abnormalities may be overlooked, the patchy distribution of many diffuse infiltrative lung diseases may not be appreciated, and small nodules may be missed between high-resolution sections (13, 14, 15, 16, 17). The second approach, possible since the advent of multidetector CT scanners, is to perform volumetric HRCT through the entire chest (18,19). This approach allows assessment of the entire lung parenchyma and therefore minimizes the risk of a falsely negative examination. Volumetric CT also allows multiplanar reconstructions (Fig. 8-3) and generation of maximum (MIPs) and minimum (MinIPs) intensity projection images. The latter
have the advantage of retaining high spatial resolution while preserving the anatomic cross-sectional orientation derived from thicker sections (Fig. 8-4). MIPs images have been shown to be particularly helpful in the detection of small nodules, and MinIPs images, in the detection of subtle emphysema (20,21). Although volumetric HRCT has been reported to result in a considerably greater radiation dose (21a), use of low-dose scanning coupled with dose-modulation techniques available on newer CT scanners can be used to minimize this problem. As a consequence, in our judgment, initial studies in patients referred for suspected diffuse lung disease should be performed with volumetric data acquisition. In distinction, follow-up examinations are best performed with a
dedicated high-resolution technique by using low-dose technique, whenever feasible, to minimize subsequent radiation exposure. An optimal approach to high-resolution imaging ultimately depends on the clinical situation to be evaluated.
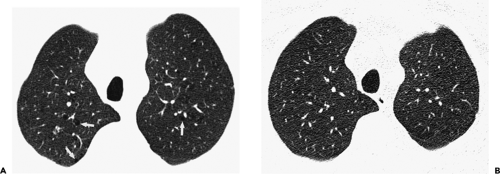 Figure 8-2 Low-dose high-resolution CT (HRCT) in emphysema. A: HRCT (1-mm collimation) performed above the level of the aortic arch by using 120 kV and 200 mA shows mild centrilobular emphysema (arrows). B: HRCT (1-mm collimation) obtained at the same level by using 120 kV and 40 mA shows considerable increase in image noise and no definite evidence of emphysema. |
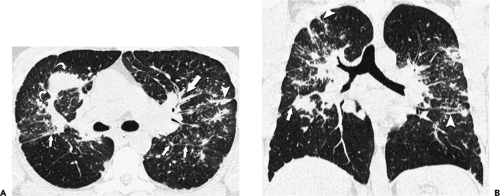 Figure 8-3 Cross-sectional and coronal images in a 49-year-old patient with sarcoidosis. A: A 1-mm high-resolution CT section through the upper lobes obtained on a multidetector CT scanner shows nodular thickening of the bronchi (large straight arrow), vessels (arrowhead), major interlobar fissures (small straight arrows), and upwardly displaced right minor fissure (curved arrows). B: Coronal reformation demonstrates the predominant distribution of the abnormalities in the middle and upper lung zones. It also shows nodular thickening of the interlobular septa (arrowheads) and interlobar fissure (arrow). |
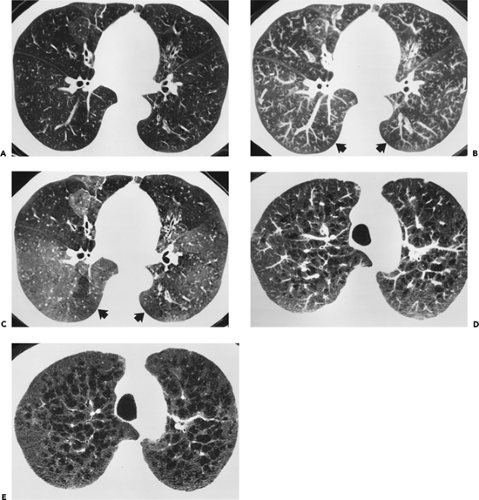 Figure 8-4 Diffuse infiltrative lung disease: evaluation with maximum (MIP) and minimum (MinIP) intensity projection images. A: A 1-mm high-resolution CT (HRCT) section through the lower lobes shows pattern of subtle mosaic attenuation with suggestion of focal air trapping within the middle lobe and lingula and the posterior segments of both lower lobes. No obvious nodules or tree-in-bud pattern identified. B, C: MIP and MinIP images, respectively, obtained by using five contiguous 1-mm sections centered at the same level as shown in A. On the MIP image, a pattern of diffuse nodules with a tree-in-bud configuration is apparent (curved arrows in B). Focal air trapping is slightly more apparent in the posterobasilar segments of the lower lobes (straight arrows in B). Note that whereas the nodules all but disappear on the MinIP image, mosaic attenuation is much more apparent (arrows in C). These findings are all consistent with infectious bronchiolitis with accompanying air trapping, identifiable even without acquiring scans in expiration. D, E: HRCT and corresponding MinIP image in a different patient than in A–C. Note that in this case, whereas diffuse emphysema is apparent on the HRCT image, visual assessment of the extent of emphysema is easier on the corresponding MinIP image. |
The risk of cancer from radiation is influenced by age, being greatest in children and young adults, particularly women, and decreasing considerably in patients older than 50 years (16). Therefore, in younger patients, it is recommended that HRCT scans be obtained by using 1-mm collimation at 1- or 2-cm intervals from the thoracic inlet to the diaphragm, prospectively reconstructed by using a high-spatial-frequency algorithm. In patients older than 50 years and in patients in whom focal lung disease or lung metastases are suspected, we routinely perform volumetric high-resolution CT through the chest by using 0.5 to 1 mm collimation.
Scans are routinely performed with the patient supine. In patients with known or suspected occupational exposure to asbestos, scans of the prone patient are often necessary to distinguish reversible gravity-dependent density and atelectasis from fixed structural abnormalities in dependent portions of the lung bases, where pulmonary fibrosis is most likely to occur (13,17). Although some investigators (6,12) obtain HRCT in the prone position only when dependent lung density is problematic, others (13) recommend prone scanning routinely. It should be noted that dependent density is a diagnostic dilemma only in patients with normal lungs or subtle parenchymal abnormalities. In patients with diffuse lung disease who have abnormalities visible on the chest radiograph, dependent density is seldom a diagnostic problem, and therefore prone scans are usually unnecessary (22).
As an adjunct to routine inspiratory images, expiratory HRCT scans have proved useful in the evaluation of patients with a variety of obstructive lung diseases (23, 24, 25). On expiratory scans, focal or diffuse air trapping may be diagnosed in patients with large or small airway obstruction or emphysema. In most lung regions of normal subjects, lung parenchyma increases uniformly in attenuation during expiration, but in the presence of air trapping, lung parenchyma remains lucent on expiration and shows little change in volume (Fig. 8-5). Some investigators obtain expiratory scans routinely in all patients who have HRCT, whereas others limit their use to patients with inspiratory scan abnormalities or suspected obstructive lung disease. Expiratory HRCT scans may be obtained during suspended respiration after forced exhalation (postexpiratory CT) or during forced exhalation (dynamic expiratory CT) (24,25). The expiratory scans may be obtained at selected levels, typically three to five, or through the entire lung using HRCT technique on multidetector CT scanners.
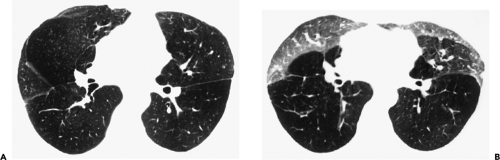 Figure 8-5 Air trapping on expiratory high-resolution CT (HRCT) in a patient with bronchiolitis obliterans. A: Inspiratory HRCT scan shows inhomogeneous appearance of the lungs with localized areas of slightly decreased attenuation and vascularity. B: Expiratory scan shows extensive bilateral air trapping throughout the lower lobes, middle lobe, and lingula. |
No predetermined “best” windows and levels exist for imaging the lung. Precise settings are often a matter of subjective preference. As a general guide, we recommend a window level of –600 to –700 HU and a window width of 1,000 to 1,500 HU for the assessment of the lung parenchyma. However, as illustrated in this chapter, a wide range of settings is used, depending on the particular nature of the pathology to be illustrated. Narrowing the window width enhances visual resolution. This may be particularly helpful when assessing focal increases and decreases in lung attenuation, as may be seen in patients with emphysema. Conversely, wide window widths are often more informative when the disease process occupies a large area and involves a wide range of tissue-density alterations, as may occur with complex pleural–parenchymal disease. In these cases, the panoramic view afforded by a wide window width improves visual comprehension (see Chapter 1 for a more detailed discussion). It should be emphasized that whenever possible, similar windows and levels should be used in evaluating follow-up CT studies to minimize the risk of inadvertently misdiagnosing disease progression and/or regression.
Normal Lung Anatomy
The lung is composed of anatomic units that demonstrate similar architecture at progressively smaller sizes, as described by fractal geometry; from large to small, these units are lungs, lobes, segments, subsegments, secondary lobules, and acini. At each level, these are organized around central or “core” supporting structures (airways and pulmonary arteries) and within peripheral or “shell” supporting structures (pleura and connective tissue septa).
The lobes are marginated to a variable degree by the interlobar fissures. In normal subjects, three lobes (upper, middle, and lower) are present on the right, and two (upper and lower) are present on the left. Lobes can be found on CT by identifying the interlobular fissures or the avascular plane that mark their positions, or when fissures are incomplete or poorly localized, by identifying bronchial branches. Lobar bronchi have a consistent branching pattern in the large majority of patients; lobar bronchial anomalies are rare. Pulmonary artery branching patterns are more variable, and therefore, less valuable in identifying individual pulmonary lobes.
Pulmonary segments are less well marginated than lobes and do not have easily definable boundaries. Individual segments are best localized on the basis of segmental bronchi and by noting the relatively consistent location of segments within lobes and in relation to lobar fissures (26, 27, 28). Arterial anatomy is less valuable in identifying segments, as arterial branching is somewhat more variable than bronchial branching (see Chapter 3). As with pulmonary segments, subsegments are best identified on the basis of bronchial anatomy. At a subsegmental level, lung is composed of secondary pulmonary lobules and acini, which are described in detail later.
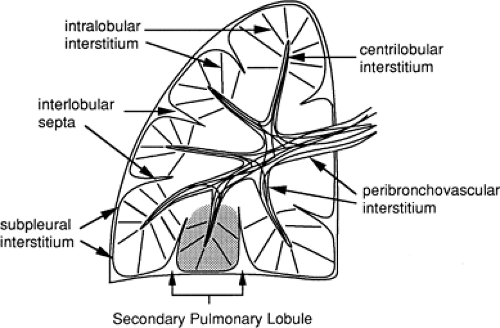 Figure 8-6 Components of the lung interstitium. Taken together, the peribronchovascular interstitium and centrilobular interstitium correspond to the “axial fiber system” described by Weibel (29). The subpleural interstitium and interlobular septa correspond to Weibel’s “peripheral fiber system.” The intralobular interstitium is roughly equivalent to the “septal fibers” described by Weibel. |
The Lung Interstitium
The lung is supported by a network of connective tissue fibers, termed the lung interstitium. The interstitium must be strong enough to maintain the patency of alveoli, airways, and vessels, but at the same time must be thin enough to allow adequate gas exchange between air in the alveolar spaces and blood in pulmonary capillaries. The interstitium is organized into three fiber systems, the peribronchovascular interstitium, the subpleural interstitium, and the intralobular interstitium (29). Together, these three form a continuous fiber skeleton that serves to support lung parenchyma between the hila centrally and the pleural surfaces peripherally (Fig. 8-6), and which, to a large extent, is replicated from the level of the lobes to the level of the secondary pulmonary lobules.
The peribronchovascular interstitium is a system of fibers that invests bronchi and pulmonary arteries and serves to support the “core” or medullary structures of the lung (Fig. 8-6). In the parahilar regions, the peribronchovascular interstitium forms a strong connective tissue sheath that surrounds large bronchi and arteries; it continues into the lung periphery, investing centrilobular arteries and bronchioles, and continues to the level of the alveolar ducts and sacs (29). The subpleural interstitium is located beneath the visceral pleura and envelops the lung in a fibrous sac from which connective tissue septa penetrate the lung parenchyma (Fig. 8-6). These septa include the interlobular septa, which are described in detail later. The intralobular interstitium is a network of thin fibers that forms a fine connective tissue mesh in the walls of alveoli, and thus bridges the gap between the peribronchovascular interstitium surrounding vessels and bronchi in the center of lobules, and the interlobular septa and subpleural interstitium in the lobular periphery (Fig. 8-6) (29). These fibers keep capillaries and alveoli open for functional gas exchange.
Bronchi and Pulmonary Vessels
Within the lung parenchyma, bronchi and pulmonary arteries are closely associated and branch in parallel. Each bronchus is positioned adjacent to a pulmonary artery of similar diameter, and this relation is maintained from the hila to the level of respiratory bronchioles in the lung periphery. As indicated earlier, bronchi and arteries are encased by a network of fibers, the peribronchovascular interstitium or bronchovascular sheath, which also ex-tends from the pulmonary hila into the peripheral lung. In addition to the artery and bronchus, this sheath contains amorphous collagen, lymphatics, and small lymph nodes, ranging in size from 1 mm in the lung periphery to 5 to 10 mm near the hila. It should be noted that lymphatics do not extend beyond the terminal bronchioles.
Because some lung diseases produce thickening of the peribronchovascular interstitium in the central or parahilar lung, in relation to large bronchi and pulmonary vessels (Fig. 8-3), it is important to be aware of the normal CT appearances of the parahilar bronchi and pulmonary vessels (Fig. 8-7). (Interested readers are referred to Chapter 3 for an in-depth discussion of normal bronchi.)
When imaged at an angle to their longitudinal axis, central pulmonary arteries normally appear as rounded or elliptical opacities on HRCT, accompanied by uniformly thin-walled bronchi of similar shape (30, 31, 32). When imaged along their axis, bronchi and vessels should appear roughly cylindrical, or show slight tapering as they branch, depending on the length of the segment that is visible; tapering of a vessel or bronchus is most easily seen when a long segment is visible.
The diameter of an artery and its neighboring bronchus should be approximately equal, although vessels may appear slightly larger than their accompanying bronchus, particularly in dependent lung regions. Although the presence of bronchi larger than their adjacent arteries is often assumed to indicate the presence of bronchial dilatation, or bronchiectasis, bronchi may appear larger than adjacent arteries in a significant number of normal subjects. This occurs most commonly when the pulmonary artery divides before the adjacent bronchus, in patients scanned at altitude, and when using low window levels (e.g., –450 HU rather than –700 HU) (24,33,34). Bronchi may also appear spuriously enlarged when high-resolution prone images are obtained through the lung bases in otherwise normal subjects. At least one bronchus with a diameter greater than the adjacent pulmonary artery has been reported in 7% of patients scanned at sea level and in 59% of normal subjects scanned at 1,600 m altitude (Denver) (24,34).
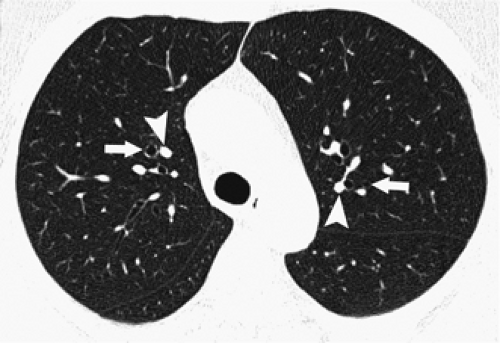 Figure 8-7 Normal appearances of large bronchi (arrows) and arteries (arrowheads). The diameters of vessels and their neighboring bronchi are approximately equal. The outer walls of bronchi and pulmonary vessels are smooth and sharply defined. Bronchi are not visible within the peripheral 2 cm of lung, although vessels are well seen in this region. |
The outer walls of visible pulmonary artery branches should form a smooth and sharply defined interface with the surrounding lung, whether they are seen in cross section or along their length. The walls of large bronchi, outlined by lung on one side and by air in the bronchial lumen on the other, normally appear to be smooth and of uniform thickness. Thickening of the peribronchial and perivascular interstitium can result in irregularity of the interface between arteries and bronchi and the adjacent lung (35,36).
Assessment of bronchial wall thickness on HRCT is quite subjective and is dependent on the window settings used (37,38). Also, because the apparent thickness of the bronchial wall represents not only the wall itself, but also the surrounding peribronchovascular interstitium, peribronchovascular interstitial thickening results in apparent bronchial wall thickening (so-called peribronchial cuffing) on HRCT.
The wall thickness of conducting bronchi and bronchioles is approximately proportional to their diameter, at least for bronchi distal to the segmental level. The normal bronchial wall thickness at the level of the segmental bronchi by using a window level of –700 HU and a window width of 1,500 HU is approximately 1 mm. (33). In general, the thickness of the wall of a bronchus or bronchiole less than 5 mm in diameter should be less than one tenth of its diameter (Table 8-1) (39); however, precise measurement of the wall thickness of small bronchi or bronchioles is difficult, as wall thickness approximates pixel size.
Bronchi and pulmonary arteries divide by dichotomous branching. Approximately 23 generations of airway branches are found, from the trachea to alveolar sacs, and 28 generations of pulmonary artery branches. Because a bronchus is usually recognized only when its walls are visualized, it is not possible to resolve airways with a wall thickness of less than 300 μm. This corresponds to bronchi of about 2 mm in diameter and not closer than 2 cm to the pleural surface, equivalent to between the seventh and ninth generation of airways (32,40).
Rarely, smaller airways approximately 1 mm in diameter can be recognized coursing perpendicularly within the plane of a very thin section by virtue of their lower density and their proximity to an adjacent pulmonary artery, even though their walls cannot be clearly seen.
Rarely, smaller airways approximately 1 mm in diameter can be recognized coursing perpendicularly within the plane of a very thin section by virtue of their lower density and their proximity to an adjacent pulmonary artery, even though their walls cannot be clearly seen.
Table 8-1 Relation of Airway Diameter to Wall Thickness | ||||||||||||||||||
|---|---|---|---|---|---|---|---|---|---|---|---|---|---|---|---|---|---|---|
|
Blood vessels with diameters of 300 μm can be visualized, corresponding to 16th-generation arteries at the level of the terminal and most proximal respiratory bronchioles. Because vascular structures typically can be seen to within a few millimeters of the pleural surfaces and can be followed to the level of the secondary pulmonary lobule, the arterial tree is a useful landmark for defining HRCT lung anatomy (32,40).
The pulmonary veins follow a course independent of the bronchial tree and lie between two pairs of bronchi and arteries. This position is maintained into the lung periphery, where veins are seen within the interlobular septa (Fig. 8-8).
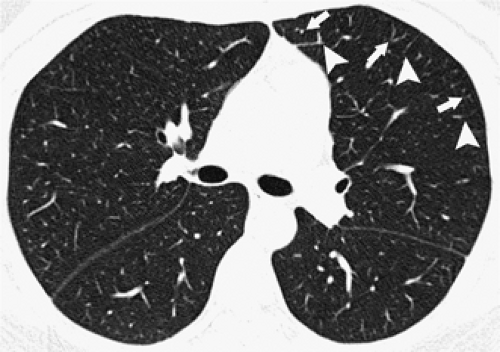 Figure 8-8 Normal peripheral pulmonary veins, arteries, and interlobular septa. High-resolution CT image demonstrates pulmonary veins coursing within interlobular septa (arrowheads) and centrilobular pulmonary arteries a few millimeters away from the interlobular septa and pleura (arrows). |
Secondary Pulmonary Lobules and Acini
The secondary pulmonary lobule, as defined by Miller (41), refers to the smallest unit of lung structure marginated by connective tissue septa (Figs. 8-9 and 8-10) (41). Secondary pulmonary lobules are irregularly polyhedral in shape and somewhat variable in size, measuring approximately 1 to 2.5 cm in diameter in most locations (42, 43, 44). In one study, the average diameter of pulmonary lobules measured in several adults ranged from 11 to 17 mm (44). Each secondary lobule is supplied by a small bronchiole and pulmonary artery and is variably marginated, in different lung regions, by connective-tissue interlobular septa that contain pulmonary vein and lymphatic branches (42). In this book, we use the terms “secondary pulmonary lobule,” “pulmonary lobule,” and “lobule” to refer to a secondary lobule as defined by Miller.
Secondary pulmonary lobules are made up of a limited number of pulmonary acini, usually a dozen or fewer, although the number of lobular acini can vary from 3 to 24 (43,45). A pulmonary acinus is defined as the portion of the lung parenchyma distal to a terminal bronchiole and supplied by a first-order respiratory bronchiole or bronchioles and comprising respiratory bronchioles, alveolar ducts, alveolar sacs, and alveoli (46). Because respiratory bronchioles are the largest airways that have alveoli in their walls, an acinus is the largest lung unit in which all airways participate in gas exchange. Acini are usually described as ranging from 6 to 10 mm in diameter (44,47).
High-Resolution Computed Tomography of the Secondary Lobule
An understanding of secondary lobular anatomy and the appearances of lobular structures are keys to the interpretation of HRCT. HRCT can show many features of the secondary pulmonary lobule in both normal and abnormal lungs, and many lung diseases, particularly interstitial diseases, produce some characteristic changes in lobular structures (43,48, 49, 50, 51).
Interlobular Septa
Anatomically, secondary lobules are marginated by connective tissue interlobular septa, which extend inward from the pleural surface. These septa are part of the subpleural interstitium, which extends over the surface of the lung beneath the visceral pleura (Fig. 8-6) (29). A rich lymphatic system, referred to as the superficial lymphatic network, drains the visceral pleura and courses within the interlobular septa in parallel with septal veins; these ultimately lead to lymphatics and nodes within the hila.
It should be emphasized that not all interlobular septa are equally well defined. The interlobular septa are thickest and most numerous in the apical, anterior, and lateral
aspects of the upper lobes, the anterior and lateral aspects of the middle lobe and lingula, the anterior and diaphragmatic surfaces of the lower lobes, and along the mediastinal pleural surfaces (52); thus secondary lobules are best defined in these regions. Septa measure about 100 μm (0.1 mm) in thickness in a subpleural location (32,40). Within the central lung, interlobular septa are thinner and less well defined than peripherally, and lobules are more difficult to identify in this location.
aspects of the upper lobes, the anterior and lateral aspects of the middle lobe and lingula, the anterior and diaphragmatic surfaces of the lower lobes, and along the mediastinal pleural surfaces (52); thus secondary lobules are best defined in these regions. Septa measure about 100 μm (0.1 mm) in thickness in a subpleural location (32,40). Within the central lung, interlobular septa are thinner and less well defined than peripherally, and lobules are more difficult to identify in this location.
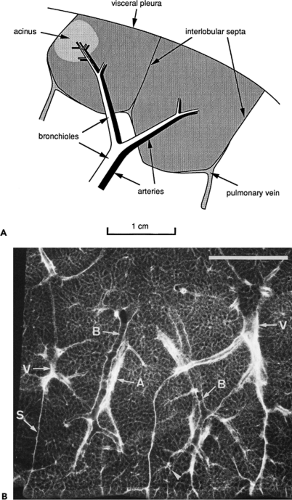 Figure 8-9 A: Anatomy of the secondary pulmonary lobule, as defined by Miller (4). Two adjacent lobules are shown in this diagram. B: Radiographic anatomy of the secondary pulmonary lobule. Radiograph of a 1-mm lung slice taken from the lower lobe. Two well-defined secondary pulmonary lobules are visible. Lobules are marginated by thin interlobular septa (S) containing pulmonary vein (V) branches. Bronchioles (B) and pulmonary arteries (A) are centrilobular. Bar = 1 cm. (Courtesy of Dr. Harumi Itoh, Kyoto University, Kyoto, Japan. From Itoh H, Murata K, Konishi J, et al. Diffuse lung disease: pathologic basis for the high-resolution computed tomography findings. J Thorac Imaging. 1993;8:176–188 , with permission.) |
Peripherally, interlobular septa measuring 100 μm or 0.1 mm in thickness are at the lower limit of HRCT resolution (40). On clinical scans in normal patients, a few septa are often visible in the lung periphery in normal subjects, but they tend to be inconspicuous; normal septa are most often seen anteriorly (Fig. 8-11), along the mediastinal pleural surfaces, or in the lower lobes or just above the diaphragm (13,35,53). When visible, they are usually seen extending to the pleural surface. In the central lung, septa are thinner than they are peripherally and are infrequently seen in normal lungs; often interlobular septa, which are clearly defined in this region, are abnormally thickened.
Occasionally, when interlobular septa are not clearly visible, their locations can be inferred by locating septal pulmonary vein branches, approximately 0.5 mm in
diameter. Veins can sometimes be seen as linear, arcuate, or branching structures or as a row or chain of dots, surrounding centrilobular arteries, and approximately 5 to 10 mm from them.
diameter. Veins can sometimes be seen as linear, arcuate, or branching structures or as a row or chain of dots, surrounding centrilobular arteries, and approximately 5 to 10 mm from them.
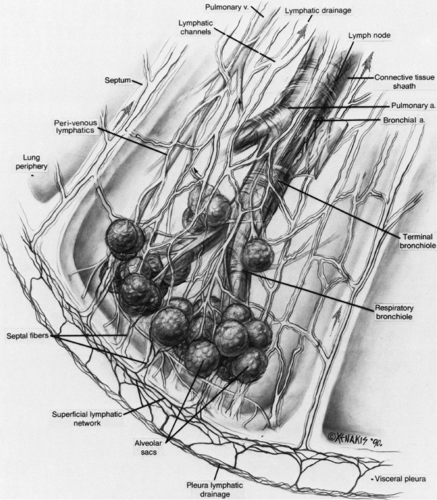 Figure 8-10 A secondary lobule according to Miller is represented. The centrilobular structures are composed of the terminal bronchiole and pulmonary artery, enclosed in a bronchovascular sheath. The bronchial artery runs in parallel to these structures within the connective tissue sheath. A deep lymphatic system located in close apposition to the core structures drains the interstitium. Note that lymphatics are not present around alveolar sacs. In the periphery of the lobule are the visceral pleura and septa, extending from the visceral pleura into the lung substance. Within these peripheral structures run the pulmonary veins and the superficial lymphatic network that drains the pleura via septal lymphatics that are perivenous in location. The functional units of the lung made up of collections of alveolar sacs are in effect suspended between the core structures and the shell structures via a network of interconnecting elastic fibers. This basic organization is self-replicated from the smallest to the largest functional lung unit. |
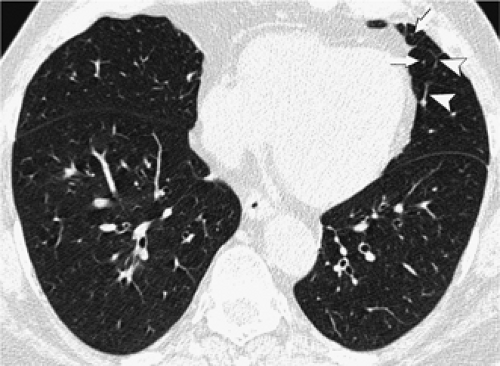 Figure 8-11 Normal interlobular septa and peripheral vessels. High-resolution CT image demonstrates normal interlobular septa (arrowheads) in the lingula. Veins can be seen coursing in the septa, whereas the centrilobular pulmonary arteries (arrows) are a few millimeters away from the septa and pleura. |
Centrilobular Region
The central portion of the lobule, referred to as the centrilobular region or lobular core (42), contains the pulmonary artery and bronchiolar branches that supply the lobule, as well as some supporting connective tissue (i.e., the peribronchovascular interstitium) (Fig. 8-12) (29,32,40). The branching of the lobular bronchiole and artery is irregularly dichotomous (54). In other words, when they divide, they divide into two branches that are usually of different sizes; one branch is nearly the same size as the one it arose from, and the other is smaller (Fig. 8-9B). Thus often a single dominant bronchiole and artery occur in the center of the lobule, and give off smaller branches at intervals along their length.
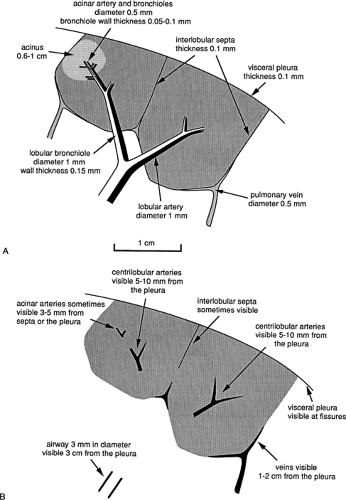 Figure 8-12 Dimensions of secondary lobular structures (A) and their visibility on high-resolution CT (B). |
The HRCT appearances and visibility of structures in the centrilobular region are determined primarily by their size (Figs. 8-9 and 8-12). Secondary lobules are supplied by arteries and bronchioles measuring approximately 1 mm in diameter, whereas intralobular terminal bronchioles and arteries measure about 0.7 mm in diameter, and acinar bronchioles and arteries range from 0.3 mm to 0.5 mm in diameter. Arteries of this size can be easily resolved by using HRCT technique (32,40).
On clinical scans, a linear, branching, or dotlike opacity frequently seen within the center of a lobule, or within a centimeter of the pleural surface, represents the intralobular artery branch or its divisions (Figs. 8-8 and 8-11) (55). The smallest arteries resolved extend to within 3 to 5 mm of the pleural surface or lobular margin and are as small as 0.2 mm in diameter (32,40,55). The visible centrilobular arteries are not seen to extend to the pleural surface in the absence of atelectasis. A similar branching structure, seen slightly farther from the pleural surface, can represent a pulmonary vein. Although vein branches can sometimes be seen in relation to interlobular septa, whereas artery branches are centrally located relative to surrounding septa, veins and arteries cannot always be distinguished. Fortunately, differentiation between these is not often necessary in clinical practice.
The thickness of the wall of an airway determines its visibility. For a 1-mm bronchiole supplying a secondary lobule, the thickness of its wall measures approximately 0.15 mm; this is at the lower limit of HRCT resolution. The wall of a terminal bronchiole measures only 0.1 mm in thickness, and that of an acinar bronchiole, only 0.05 mm, both of which are below the resolution of HRCT technique for a tubular structure. In one in vitro study, only bronchi having a diameter of 2 mm or more or having a wall thickness of more than 100 μm (0.1 mm) were visible by using HRCT (40); and resolution is certainly less than this on clinical scans. It is important to remember that on clinical HRCT, intralobular bronchioles are not normally visible, and bronchi or bronchioles are not normally seen within 1 cm of the pleural surface.
Lung Attenuation
Most of the lung, representing alveoli and their associated pulmonary capillary bed, supplied by small airways and branches of the pulmonary arteries and veins, appears featureless on HRCT, identifiable as homogeneous gray “background” density. The thickness of alveolar walls normally measures approximately 20 to 30 μm and is therefore an order of magnitude below the resolution of HRCT. On HRCT, lung parenchyma should be of greater opacity than air, but this difference may vary with window settings (see Chapter 1).
Generally speaking, lung opacity as seen on HRCT scans obtained at full inspiration appears relatively homogeneous. Measurements of lung attenuation in normal subjects can range from –700 to –900 HU, corresponding to lung densities of approximately 0.300 to 0.100 g/mL, respectively (56,57). However, an attenuation gradient is normally present, if measurements are made, with the most dependent lung regions being the densest, and the most nondependent lung regions being the least dense. This gradient is largely caused by regional differences in blood volume and gas volume that, in turn, are determined by gravity, mechanical stresses on the lung, and intrapleural pressures (57,58). Differences in attenuation between anterior and posterior lung have been measured in supine patients, and values generally range from 50 to 100 HU (56,57,59,60), although gradients of more than 200 HU have been reported (60). The anteroposterior attenuation gradient was found to be nearly linear and was present regardless of whether the subject was supine or prone (60).
Although most authors have reported that normal anteroposterior lung-attenuation gradients are linear, with attenuation increasing gradually from anterior to posterior lung, the lingula and superior segments of the lower lobes can appear relatively lucent in some normal subjects (61); focal lucency in these segments should be considered a normal finding. Although the reason for this is unclear, these slender segments may be less well ventilated than adjacent lung and therefore less well perfused, or some air trapping may be present.
Patterns of Abnormality on High-Resolution Computed Tomography
The diffuse parenchymal lung diseases include chronic and acute infiltrative lung diseases and emphysema. The definition of diffuse lung disease is somewhat arbitrary because these conditions often have a patchy or focal distribution. Findings that indicate the presence of pulmonary parenchymal abnormalities consistent with diffuse lung disease can be classified into four large categories based on their appearances. These are linear and reticular opacities; nodules and nodular opacities; increased lung opacity, including ground-glass opacity and airspace consolidation; and abnormalities associated with decreased lung opacity, including cystic lesions, emphysema, and airway abnormalities.
Linear and Reticular Opacities
Linear and reticular opacities result from thickening of the pulmonary interstitium by fluid, fibrosis, or infiltration by cells or other material. Linear and reticular opacities may be manifested by the interface sign, peribronchovascular interstitial thickening, interlobular septal thickening, parenchymal bands, subpleural interstitial thickening,
intralobular interstitial thickening, honeycombing, irregular linear opacities, and subpleural lines (Fig. 8-13).
intralobular interstitial thickening, honeycombing, irregular linear opacities, and subpleural lines (Fig. 8-13).
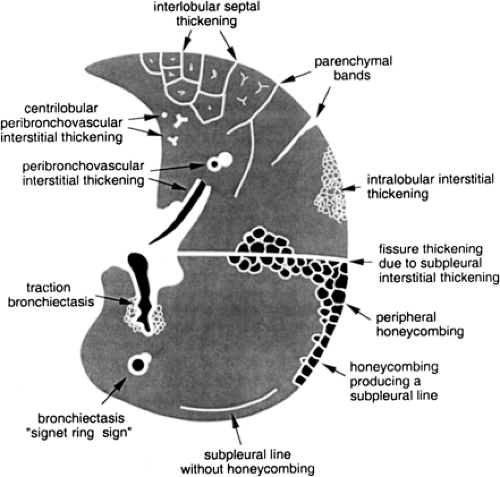 Figure 8-13 Linear and reticular opacities visible on HRCT. (From Webb WR, Müller NL, Naidich DP. High-resolution CT of the lung, 3rd ed. Philadelphia: Lippincott Williams & Wilkins; 2001 ; with permission.) |
The interface sign is characterized by the presence of irregular interfaces between the aerated lung and bronchi, vessels, and visceral pleura (Fig. 8-14) (36). It is a common and early finding of interstitial lung disease, being seen most frequently in patients with pulmonary fibrosis (36,62).
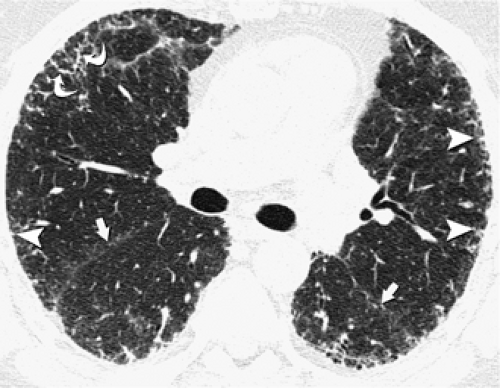 Figure 8-14 Irregular interface sign. High-resolution CT at the level of the bronchus intermedius demonstrates irregular interfaces between the lung parenchyma and the parietal pleura (arrowheads), interlobar fissures (straight arrows), and interlobular septa (curved arrows). The patient was a 53-year-old man with idiopathic pulmonary fibrosis. |
The bronchi and pulmonary arteries are surrounded by a connective tissue sheath, termed the peribronchovascular interstitium, which extends from the level of the pulmonary hila into the peripheral lung. Peribronchovascular interstitial thickening occurs in many diffuse lung diseases. The thickening can be smooth, nodular, or irregular. Smooth peribronchovascular interstitial thickening is most typical of patients with interstitial pulmonary edema (63) or lymphangitic spread of carcinoma (64,65). Nodular thickening of the peribronchovascular interstitium is particularly common in sarcoidosis and lymphangitic spread of carcinoma (Fig. 8-15) (64, 65, 66, 67). Irregular peribronchovascular interstitial thickening is most frequently seen in patients with peribronchovascular and adjacent lung fibrosis (62). In patients with pulmonary fibrosis and peribronchovascular interstitial thickening, often the dilatation of the bronchi is caused by traction by the surrounding fibrosis. This is referred to as traction bronchiectasis (Fig. 8-16) (68).
A characteristic finding in patients with interstitial lung disease is the presence of thickening of the interlobular septa. Normally only a few septa are seen. Thickened septa (septal lines) are readily recognized in the lung periphery as lines 1 to 2 cm in length, 0.5 to 2 cm apart, perpendicular to the pleura, and extending to the pleural surface (Fig. 8-17). In the central lung regions, thickened septa outlining one or more adjacent secondary pulmonary lobules can be seen as polygonal arcades (36,65). Thickening of the interlobular septa may be caused by edema, cellular
infiltration, or fibrosis. Septal thickening can be smooth, nodular, or irregular in contour (Table 8-2). Smooth septal thickening is seen most commonly in patients with pulmonary edema (63,69) or lymphatic spread of carcinoma (64,65); less common causes include
lymphoma (70,71), leukemia (72,73), Churg-Strauss syndrome (74,75), acute lung rejection (76), congenital lymphangiectasia (77), and Niemann-Pick disease (78). Smooth septal thickening may also be seen in association with ground-glass opacity, a pattern termed crazy-paving; this pattern is typical of alveolar proteinosis but has a long differential diagnosis, which is reviewed later (79, 80, 81, 82). Nodular septal thickening occurs most commonly in patients with lymphangitic carcinomatosis (Fig. 8-18) (64,83), Kaposi sarcoma (84), sarcoidosis (Fig. 8-3) (85,86), silicosis, and coalworkers’ pneumoconiosis (87,88). Less common causes include lymphoma (70,71), leukemia (72,73), lymphocytic interstitial pneumonia (LIP) (89), and amyloidosis (90,91). Irregular septal thickening is seen most commonly in patients with interstitial fibrosis, particularly idiopathic pulmonary fibrosis (IPF), asbestosis, and sarcoidosis (92,93), and is usually associated with other findings of fibrosis, such as intralobular linear opacities and architectural distortion (49,93,94).
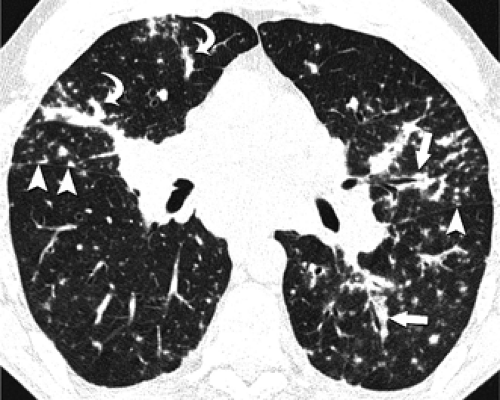 Figure 8-15 Peribronchial and perivascular interstitial thickening. High-resolution CT at the level of the right middle lobe demonstrates nodular peribronchial (straight arrows) and perivascular (curved arrows) thickening. Also noted are small nodules along the interlobar fissures (arrowheads) and costal pleura. The patient was a 28-year-old man with sarcoidosis. |
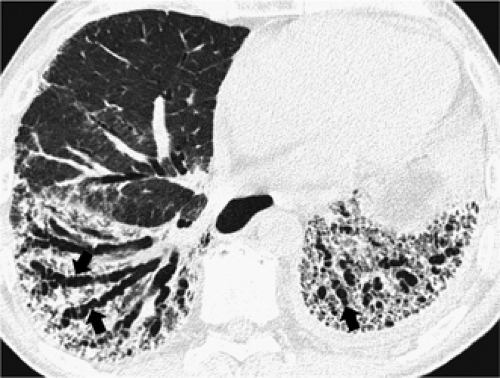 Figure 8-16 Traction bronchiectasis. High-resolution CT at the level of the lower lung zones shows extensive bilateral reticulation. The bronchi within the areas of reticulation are dilated and distorted and have a beaded appearance (arrows), characteristic of traction bronchiectasis. The patient was a 76-year-old man with idiopathic pulmonary fibrosis. |
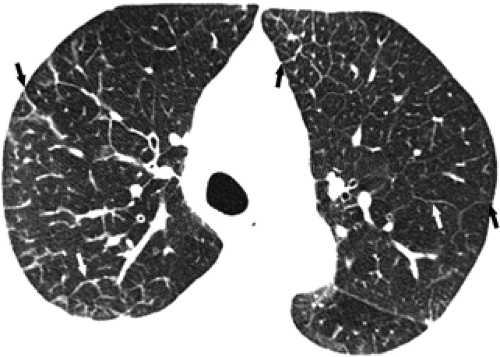 Figure 8-17 Interlobular septal thickening. High-resolution CT at the level of the upper lobes demonstrates smooth asymmetric bilateral interlobular septal thickening (arrows). The patient was a 69-year-old woman with interstitial pulmonary edema. |
Table 8-2 Differential Diagnosis of Interlobular Septal Thickening | ||||||||||||||||||||||||||||
|---|---|---|---|---|---|---|---|---|---|---|---|---|---|---|---|---|---|---|---|---|---|---|---|---|---|---|---|---|
|
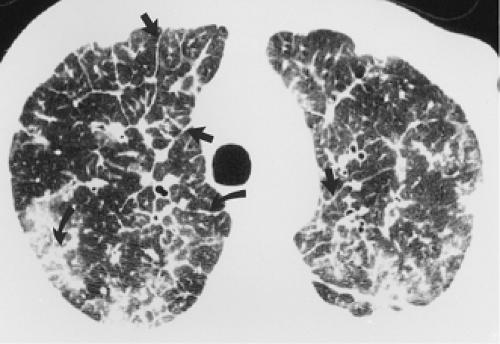 Figure 8-18 Interlobular septal thickening. High-resolution CT at the level of the aortic arch demonstrates smooth (straight arrows) and nodular (curved arrows) interlobular septal thickening. Also noted are subpleural nodules. The patient was a 72-year-old man with lymphangitic carcinomatosis caused by metastatic adenocarcinoma of the rectum. |
Intralobular linear opacities are caused by thickening of the interstitium within the secondary pulmonary lobule. They result in a fine reticular pattern, a mesh of small irregular lines separated by only a few millimeters (Fig. 8-19). Intralobular linear opacities are most commonly caused by fibrosis (Table 8-3). In IPF and interstitial fibrosis associated with collagen-vascular diseases, the intralobular linear opacities are characteristically most evident in the subpleural lung regions and in the lower lung zones (Fig. 8-20) (62,95, 96, 97). A similar pattern and distribution may be seen in asbestosis, although the diagnosis can usually be suggested by the presence of associated pleural thickening (13,94). Intralobular linear opacities are also frequently seen in patients with nonspecific interstitial pneumonia (NSIP) (97). NSIP can be idiopathic or be seen in association with a variety of conditions, particularly drug reactions and collagen-vascular diseases (97). In NSIP, the intralobular linear opacities tend to be mild and usually are seen in association with ground-glass opacities (98,99). In chronic hypersensitivity pneumonitis, the fibrosis is usually most severe in the mid lung zones and is more random in distribution rather than having a subpleural predominance (100), although in some cases, the findings may be similar to those of IPF (101). Although intralobular linear opacities usually indicate fibrosis, they may also occasionally be seen in the absence of fibrosis, having been described in patients with pulmonary hemorrhage, some pneumonias (e.g., that due to Pneumocystis jiroveci), lymphangitic carcinomatosis, and alveolar proteinosis (79,81). In these patients, traction bronchiectasis and other manifestations of fibrosis are absent.
 Figure 8-19 Intralobular linear opacities. High-resolution CT through the lower lung zones demonstrates linear opacities separated by only a few millimeters, causing a fine reticular pattern. Also noted is irregular interlobular septal thickening. The patient was a 58-year-old woman with idiopathic pulmonary fibrosis. |
Nodular Opacities
Nodules of 1 to 10 mm in diameter are seen in a number of acute and chronic infiltrative lung diseases. The differential diagnosis of multiple small nodular opacities is based on their appearance, whether well defined or poorly defined, their distribution, and the presence of associated findings. Three main types of distribution can be identified on HRCT: perilymphatic, centrilobular, and random.
 Figure 8-20 Intralobular linear opacities. High-resolution CT (1-mm collimation) demonstrates linear opacities separated by only a few millimeters (intralobular linear opacities) (arrows), causing a fine reticular pattern. The abnormalities involve mainly the subpleural lung regions and are most severe in the right lung. The patient was a 70-year-old man with idiopathic pulmonary fibrosis. |
Table 8-3 Differential Diagnosis of Intralobular Interstitial Thickening | ||||||||||||||||||
|---|---|---|---|---|---|---|---|---|---|---|---|---|---|---|---|---|---|---|
|
A perilymphatic distribution along the bronchovascular interstitium, interlobular septa, and subpleural lung regions is characteristically seen in patients with sarcoidosis (67), lymphangitic carcinomatosis (64), silicosis and coalworkers’ pneumoconiosis (Fig. 8-21) (Table 8-4) (87,88). In these conditions, the nodules tend to be well defined and usually measure 2 to 5 mm in diameter. Nodules in a perilymphatic distribution are frequently associated with nodular thickening of the bronchovascular bundles (Figs. 8-3 and 8-15). Another sign helpful in assessing the perilymphatic distribution is the presence of subpleural nodules in relation to the interlobar fissures, a characteristic finding in sarcoidosis, silicosis, and coalworkers’ pneumoconiosis (Fig. 8-22). The various diseases associated with a perilymphatic distribution of nodules can usually be distinguished on HRCT by the different patterns of involvement of the perilymphatic interstitium. In sarcoidosis, the nodules are usually most numerous along the perihilar bronchi and vessels and the major fissures (Fig. 8-3) (67,68,102). In patients with lymphangitic spread of tumor, when nodules are visible, they are most often visible within the thickened peribronchovascular interstitium and interlobular septa. In the majority of these patients, the main finding is septal thickening (Fig. 8-18); peribronchovascular and subpleural nodules are typically not as profuse as in patients with
sarcoidosis (103). Silicosis and coalworkers’ pneumoconiosis are associated with the presence of small, well-defined nodules, usually measuring from 2 to 5 mm in diameter, which predominantly appear centrilobular and subpleural in location on HRCT (87,88).
sarcoidosis (103). Silicosis and coalworkers’ pneumoconiosis are associated with the presence of small, well-defined nodules, usually measuring from 2 to 5 mm in diameter, which predominantly appear centrilobular and subpleural in location on HRCT (87,88).
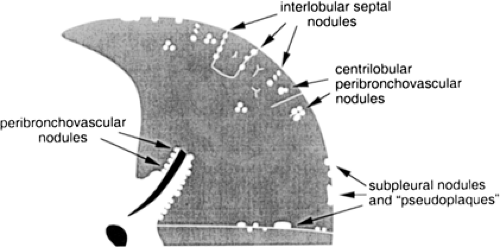 Figure 8-21 Appearance of small nodules with a perilymphatic distribution. Nodules predominate in relation to the perihilar peribronchovascular interstitium, centrilobular interstitium, interlobular septa, and subpleural regions. Conglomerate subpleural nodules can form pseudoplaques. (From Webb WR, Müller NL, Naidich DP. High-resolution CT of the lung, 3rd ed. Philadelphia: Lippincott Williams & Wilkins; 2001 , with permission.) |
Table 8-4 Differential Diagnosis of Perilymphatic Nodules | ||||||||||
|---|---|---|---|---|---|---|---|---|---|---|
|
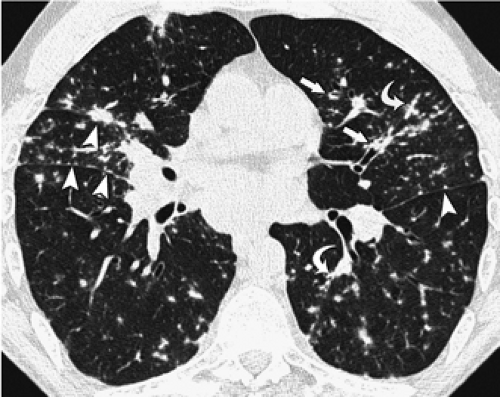 Figure 8-22 Small nodules in a perilymphatic distribution. High-resolution CT shows small nodules along the bronchi (straight arrows), vessels (curved arrows), and major and right minor interlobar fissures (arrowheads). Also noted are enlarged subcarinal and hilar lymph nodes. The patient was a 28-year-old man with sarcoidosis. |
Centrilobular nodules are characterized on HRCT by their location several millimeters away from the pleural surfaces, interlobar fissures, and interlobular septa and are further defined as appearing either poorly defined ground-glass in density, or having a distinct “tree-in-bud” configuration (Fig. 8-23). Predominantly poorly defined centrilobular ground-glass nodules are most often a manifestation of subacute or chronic cellular bronchiolitis and are typically seen in patients with subacute hypersensitivity pneumonitis (14,104), less commonly in patients with a variety of causes of bronchiolitis, including respiratory bronchiolitis (106,107), respiratory bronchiolitis–interstitial lung disease (RB-ILD) (107,108), and rarely, cryptogenic organizing pneumonia (COP) (also known as bronchiolitis obliterans with organizing pneumonia; BOOP) (Table 8-5) (Fig. 8-24) (110). In hypersensitivity pneumonitis, the nodules may be diffuse throughout the lungs or involve mainly the middle and lower lung zones, whereas in respiratory bronchiolitis and RB-ILD, the nodules usually involve mainly or exclusively the upper lobes.
In distinction to poorly defined ground-glass nodules is the presence of branching nodular or linear opacities resulting in a so-called tree-in-bud pattern (Figs. 8-25 and 8-26) (111,112). The tree-in-bud pattern is characteristic of acute cellular bronchiolitis and results from the presence
of dilated centrilobular bronchioles impacted with mucus, fluid, and/or pus, often in association with peri-bronchiolar inflammation. It is usually associated with infection of the small airways, the most common causes being infectious bronchiolitis, bronchopneumonia, and endobronchial spread of tuberculosis (43,105) or Mycobacterium avium-intracellulare infection (111,113,114). Typically focal in distribution, tree-in-bud opacities may also be diffusely distributed throughout the lungs, as typically occurs in patients with Asian panbronchiolitis (109). Although not typically characterized as an infectious disease, it is significant that in most patients with Asiatic panbronchiolitis, at least initially, a good response may be expected after antibiotic therapy (114a, 114b). Tree-in-bud opacities have been reported to occur distal to bronchiectasis of any cause (111,113), including in patients with allergic bronchopulmonary aspergillosis (113).
of dilated centrilobular bronchioles impacted with mucus, fluid, and/or pus, often in association with peri-bronchiolar inflammation. It is usually associated with infection of the small airways, the most common causes being infectious bronchiolitis, bronchopneumonia, and endobronchial spread of tuberculosis (43,105) or Mycobacterium avium-intracellulare infection (111,113,114). Typically focal in distribution, tree-in-bud opacities may also be diffusely distributed throughout the lungs, as typically occurs in patients with Asian panbronchiolitis (109). Although not typically characterized as an infectious disease, it is significant that in most patients with Asiatic panbronchiolitis, at least initially, a good response may be expected after antibiotic therapy (114a, 114b). Tree-in-bud opacities have been reported to occur distal to bronchiectasis of any cause (111,113), including in patients with allergic bronchopulmonary aspergillosis (113).
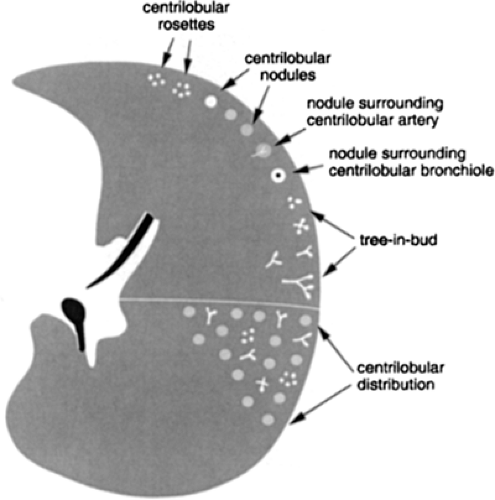 Figure 8-23 HRCT appearances of centrilobular nodules. Centrilobular nodules are usually separated from the interlobular septa and pleural surfaces by a distance of several millimeters; in the lung periphery, the nodules are usually centered 5 to 10 mm from the pleural surface. Centrilobular nodules may be associated with small pulmonary artery branches. Because of the similar size of secondary lobules, centrilobular nodules often appear to be evenly spaced. Although they are often ill defined, this is not always the case. Either a single centrilobular nodule or a centrilobular rosette of nodules may be seen. In occasional cases, the air-filled centrilobular bronchiole can be recognized as a rounded lucency within a centrilobular nodule. Tree-in-bud may be seen in patients with a centrilobular distribution, representing impaction of centrilobular bronchioles. (From Webb WR, Müller NL, Naidich DP. High-resolution CT of the lung, 3rd ed. Philadelphia: Lippincott Williams & Wilkins; 2001 , with permission.) |
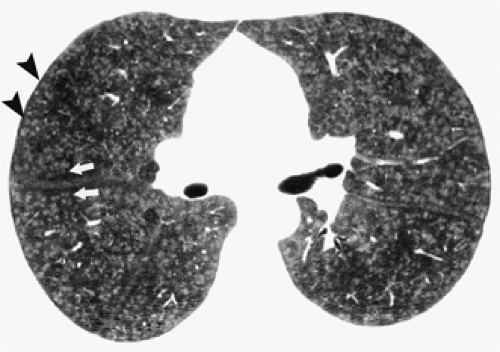 Figure 8-24 Centrilobular nodules in hypersensitivity pneumonitis. High-resolution CT (1-mm collimation) at the level of the bronchus intermedius demonstrates numerous poorly defined centrilobular nodules. Note that the nodules are a few millimeters away from the pleura (arrowheads), including interlobar fissures (arrows), a characteristic finding of centrilobular nodules. The patient was a 35-year-old man with subacute hypersensitivity pneumonitis (bird-breeder’s lung). |
Table 8-5 Differential Diagnosis of Centrilobular Nodules | ||||||||||||||||
|---|---|---|---|---|---|---|---|---|---|---|---|---|---|---|---|---|
|
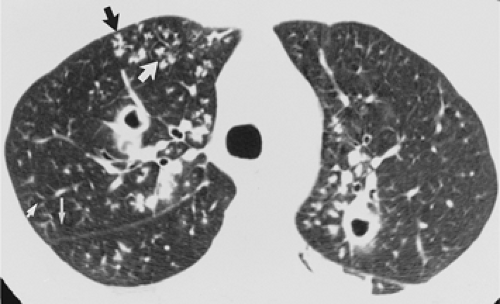 Figure 8-25 Tree-in-bud appearance in tuberculosis. High-resolution CT (1.5-mm collimation) through the upper lobes demonstrates bilateral cavities and sharply defined centrilobular nodules. The nodules and branching lines have an appearance that resembles a tree-in-bud (arrows). |
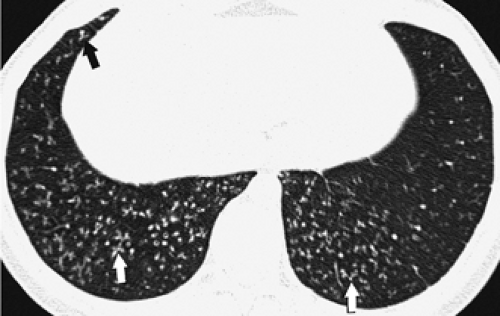 Figure 8-26 Tree-in-bud appearance in infectious bronchiolitis. High-resolution CT (1.0-mm collimation) at the level of the lung bases shows centrilobular branching nodular and linear opacities, resulting in a tree-in-bud appearance (arrows). The patient was a 20-year-old woman with recurrent respiratory infections. |
Small nodules in a random distribution in relation to structures of the lung and secondary lobule are seen most commonly in miliary tuberculosis (112,115) and miliary fungal infections (116) and less commonly in sarcoidosis (Fig. 8-27). Hematogenous miliary metastases have a random distribution regarding the lobular structures (Fig. 8-28) but tend to be most numerous in the lung periphery and at the lung bases (117). Randomly distributed nodules can be seen in relation to interlob-ular septa, small vessels, and pleural surfaces but do not have consistent or predominant distribution to any of these. Lung involvement tends to be bilateral and symmetric.
Distinction of perilymphatic, centrilobular, and random distribution of small nodules is most readily accomplished
by adhering to an easily followed diagnostic algorithm. First proposed by Gruden et al. (114), this approach first requires identifying whether pleural and/or perifissural nodules are present. If subpleural nodules are absent, the pattern is centrilobular. If numerous subpleural or fissural nodules are present, then the pattern is either perilymphatic or random. These two patterns are further distinguished by noting additional features regarding their anatomic distribution. Specifically, if nodules are patchy in distribution and demonstrate a distinct peribronchovascular (axial), interstitial, and/or interlobular septal predominance, then the nodules are perilymphatic. In distinction, if nodules are distributed in a diffuse and uniform manner, or predominantly involve the lung bases, the pattern is random, with nodules likely hematogenous in origin. A similar algorithmic approach allows further characterization of centrilobular nodules either as having a tree-in-bud configuration, indicative of acute cellular bronchiolitis, or as poorly defined centrilobular nodules, as frequently occurs in patients with subacute or chronic cellular bronchiolitis (117a).
by adhering to an easily followed diagnostic algorithm. First proposed by Gruden et al. (114), this approach first requires identifying whether pleural and/or perifissural nodules are present. If subpleural nodules are absent, the pattern is centrilobular. If numerous subpleural or fissural nodules are present, then the pattern is either perilymphatic or random. These two patterns are further distinguished by noting additional features regarding their anatomic distribution. Specifically, if nodules are patchy in distribution and demonstrate a distinct peribronchovascular (axial), interstitial, and/or interlobular septal predominance, then the nodules are perilymphatic. In distinction, if nodules are distributed in a diffuse and uniform manner, or predominantly involve the lung bases, the pattern is random, with nodules likely hematogenous in origin. A similar algorithmic approach allows further characterization of centrilobular nodules either as having a tree-in-bud configuration, indicative of acute cellular bronchiolitis, or as poorly defined centrilobular nodules, as frequently occurs in patients with subacute or chronic cellular bronchiolitis (117a).
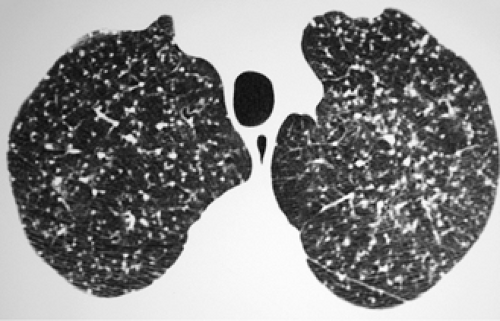 Figure 8-27 Miliary tuberculosis. High-resolution CT through the upper lobes shows numerous widely scattered nodules, without obvious relation to lobular anatomy. The patient was a 66-year-old woman with miliary tuberculosis. (Case courtesy of Dr. Isabela Silva, Salvador, Brazil.) |
 Figure 8-28 Miliary metastases. High-resolution CT through the upper lobes shows numerous widely scattered nodules, without obvious relation to lobular anatomy. Incidental note is made of mild emphysema. The patient was a 76-year-old man with miliary metastases from renal cell carcinoma. |
Nodules greater than 1 cm in diameter may result from conglomeration of smaller nodules or from progressive fibrosis, as may be seen in patients with silicosis (118), sarcoidosis (119,120), or talcosis (121,122). More commonly, larger nodules result from pulmonary metastases, septic emboli (123), or Wegener granulomatosis (124,125). Pulmonary metastases tend to have smooth margins and are most numerous in the subpleural regions of the lower lung zones. Septic emboli have a similar distribution. The nodules in Wegener granulomatosis may range from 2 mm to 7 cm in diameter, usually have irregular margins, and frequently cavitate (124).
In immunocompromised patients nodules larger than 1 cm in diameter may be caused by septic embolism (123), invasive aspergillosis, post-transplant lymphoproliferative disorders,
or lymphoma (126). Nodules caused by invasive pulmonary aspergillosis often have a characteristic halo of ground-glass attenuation surrounding the nodule (Fig. 8-29). This halo is caused by hemorrhage. Although the “halo sign” was first described in invasive aspergillosis, it may also be seen in other hemorrhagic nodules, including candidiasis, Wegener granulomatosis, metastatic angiosarcoma, and Kaposi sarcoma, as well as in nonhemorrhagic nodules such as bronchioloalveolar carcinoma and metastases from carcinoma of the colon (127,128). However, in the clinical context of a patient with hematologic malignancy and severe neutropenia, the “halo sign” is highly suggestive of angioinvasive aspergillosis (129). Post-transplant lymphoproliferative disorders and lymphomas seen in patients with acquired immunodeficiency syndrome (AIDS) often are first seen with pulmonary nodules, which may have smooth or irregular margins (126). In immunocompromised patients, lymphoma may often involve the lungs without associated hilar or mediastinal lymphadenopathy.
or lymphoma (126). Nodules caused by invasive pulmonary aspergillosis often have a characteristic halo of ground-glass attenuation surrounding the nodule (Fig. 8-29). This halo is caused by hemorrhage. Although the “halo sign” was first described in invasive aspergillosis, it may also be seen in other hemorrhagic nodules, including candidiasis, Wegener granulomatosis, metastatic angiosarcoma, and Kaposi sarcoma, as well as in nonhemorrhagic nodules such as bronchioloalveolar carcinoma and metastases from carcinoma of the colon (127,128). However, in the clinical context of a patient with hematologic malignancy and severe neutropenia, the “halo sign” is highly suggestive of angioinvasive aspergillosis (129). Post-transplant lymphoproliferative disorders and lymphomas seen in patients with acquired immunodeficiency syndrome (AIDS) often are first seen with pulmonary nodules, which may have smooth or irregular margins (126). In immunocompromised patients, lymphoma may often involve the lungs without associated hilar or mediastinal lymphadenopathy.
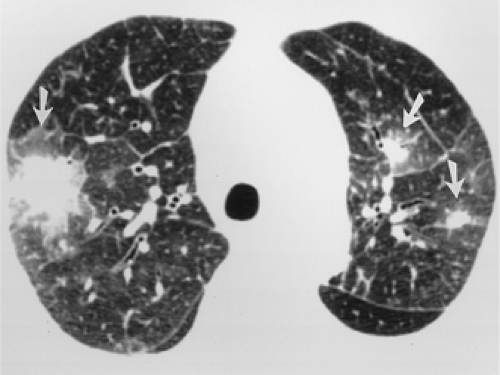 Figure 8-29 Nodules with halo in invasive aspergillosis. High-resolution CT (1-mm collimation) through the upper lung zones demonstrates nodules ranging from 5 to 25 mm in diameter. The nodules have irregular margins and are surrounded by a halo of ground-glass attenuation (arrows). The patient was a 77-year-old woman with leukemia and angioinvasive aspergillosis. |
Ground-Glass Opacity
Ground-glass opacity is characterized by the presence of hazy increased attenuation of the lung without obscuration of the underlying bronchial and vascular outlines (130). If the vessels are obscured, the term “consolidation” is used (131,132). Ground-glass opacity results from volume averaging of abnormalities below the resolution of CT and may be caused by interstitial thickening, air-space filling, or both (131). Although ground-glass opacity is a nonspecific finding, it is an important sign because it usually indicates the presence of active, potentially treatable disease (Fig. 8-30) (131,133). Furthermore, the differential diagnosis can be narrowed considerably by assessing the HRCT findings together with the clinical information (134).
The presence of ground-glass opacities as the predominant or only finding in patients with AIDS is highly suggestive of Pneumocystis jiroveci pneumonia (Fig. 8-31) (Table 8-6) (84,135,136). In the non-AIDS immunocompromised patient, ground-glass opacities are a less specific finding, being seen in patients with Pneumocystis jiroveci pneumonia, cytomegalovirus pneumonia, cytotoxic drug reaction, pulmonary edema, and pulmonary hemorrhage (Table 8-6) (137, 138, 139, 140).
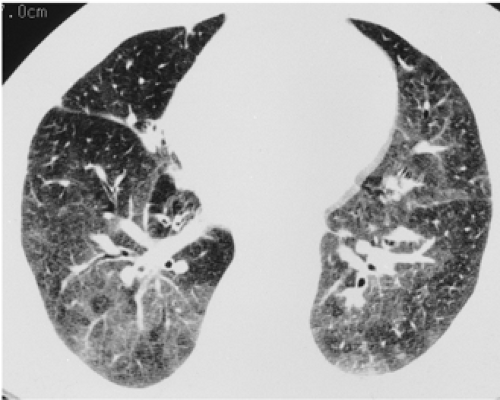 Figure 8-30 Ground-glass attenuation in desquamative interstitial pneumonia (DIP). High-resolution CT (1.5-mm collimation) through the lower lung zones demonstrates bilateral areas of ground-glass attenuation with relative sparing of the right middle lobe. Minimal, if any, evidence of fibrosis is seen. The patient was a 63-year-old woman with DIP. |
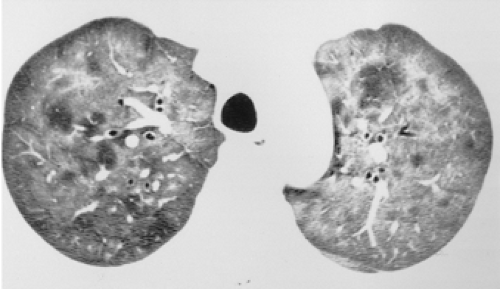 Figure 8-31 Ground-glass attenuation in Pneumocystis pneu-monia (PCP). High-resolution CT (1.5-mm collimation) shows extensive areas of ground-glass attenuation in the upper lobes. The patient was a 41-year-old man with acquired immunodeficiency syndrome (AIDS) and PCP. |
The main differential diagnosis in patients with chronic respiratory symptoms and exclusively ground-glass opacities includes hypersensitivity pneumonitis (15,141), NSIP (98,99,131,142), desquamative interstitial pneumonia (DIP) (143), and RB-ILD (107,108,134) (Fig. 8-30) (Table 8-6). Hypersensitivity pneumonitis is probably the most common cause of diffuse ground-glass opacities in normal hosts (134). NSIP may be idiopathic or associated with specific diseases, such as scleroderma or other collagen-vascular diseases, and in drug reactions (98,99,131,142). DIP and RB-ILD are uncommon, being seen almost exclusively in cigarette smokers. Other chronic diseases that commonly have ground-glass opacities but usually are associated with other findings include IPF (62,95, 96, 97, 98, 99), COP (131,144), sarcoidosis (120,145), LIP (89), chronic eosinophilic pneumonia (80), Churg-Strauss syndrome (75), lipoid pneumonia (146), bronchioloalveolar carcinoma (147), and alveolar proteinosis (148).
The differential diagnosis of ground-glass opacities in patients with chronic lung diseases is based on the distribution of the ground-glass opacities and, more important, on the presence of associated findings, such as reticulation or centrilobular nodules. In IPF, NSIP, and DIP, the ground-glass opacities tend to involve mainly the subpleural lung regions and the lung bases. In virtually all patients with IPF and in the majority with NSIP, ground-glass opacities are seen in association with intralobular linear opacities in a predominantly peripheral and basal distribution, architectural distortion, and traction bronchiectasis (Fig. 8-32). Ground-glass opacities in hypersensitivity pneumonitis may be diffuse or involve mainly the mid and lower lung zones and are frequently associated with poorly defined centrilobular nodules and areas of air trapping (15,149). Ground-glass opacities in sarcoidosis are almost always associated with other findings, including hilar and mediastinal lymphadenopathy and perilymphatic nodules.
Table 8-6 Differential Diagnosis of Ground-Glass Opacity | ||||||||||||||||||||||||||||||||||||||||||||||||||||||
|---|---|---|---|---|---|---|---|---|---|---|---|---|---|---|---|---|---|---|---|---|---|---|---|---|---|---|---|---|---|---|---|---|---|---|---|---|---|---|---|---|---|---|---|---|---|---|---|---|---|---|---|---|---|---|
|
Superimposition of interlobular septal thickening or intralobular lines on ground-glass opacities may result in a pattern known as crazy-paving (Fig. 8-33) (80,81). This pattern was first described in patients with pulmonary alveolar proteinosis (PAP) (81) and is quite typical of PAP, but may also be seen in patients with a variety of other diseases, including pulmonary edema (Fig. 8-34) (63), pulmonary hemorrhage (150), acute respiratory distress syndrome (ARDS) (80,151), acute interstitial pneumonia (AIP) (80), bacterial pneumonia (80), Pneumocystis pneumonia (151), acute eosinophilic pneumonia (152), Churg-Strauss syndrome (75), radiation pneumonitis (153), bronchioloalveolar carcinoma (147), and lipoid pneumonia (146). Clearly, the differential diagnosis of a crazy-paving pattern must be based on a consideration of clinical as well as HRCT findings and knowledge of whether symptoms are acute or chronic.
Consolidation
Parenchymal consolidation usually results from filling of the airspaces by fluid, protein, cells, or other material (43,131,154). Occasionally it may result from replacement of air in the alveoli by extensive interstitial disease, as may
be seen in patients with sarcoidosis, usual interstitial pneumonia (UIP), and NSIP (98,131). Essentially all conditions leading to areas of ground-glass attenuation, when severe enough, will cause consolidation, and both findings are frequently present in the same patient (144,155). Diffuse diseases commonly associated with consolidation include bacterial and fungal pneumonia, ARDS, AIP (155), COP (144), and eosinophilic pneumonia (Table 8-7) (156). AIP is essentially the idiopathic form of ARDS. It is uncommon and is classified as a subtype of idiopathic interstitial pneumonia (97). The clinical, histologic, and radiologic findings are those of ARDS (155,157) and consist of extensive bilateral areas of ground-glass attenuation and consolidation (Fig. 8-35). AIP is essentially a diagnosis of exclusion: ARDS in which no etiology is found. COP, also known as BOOP, most frequently is initially seen with bilateral areas of consolidation, which in approximately 60% to 80% of cases are peribronchial or subpleural in distribution (Fig. 8-36) (110,144,158). In approximately 60% of patients with BOOP, some of the areas of consolidation involve mainly the perilobular regions and may surround areas with ground-glass attenuation, resulting in a “reversed halo sign” (158,159).
be seen in patients with sarcoidosis, usual interstitial pneumonia (UIP), and NSIP (98,131). Essentially all conditions leading to areas of ground-glass attenuation, when severe enough, will cause consolidation, and both findings are frequently present in the same patient (144,155). Diffuse diseases commonly associated with consolidation include bacterial and fungal pneumonia, ARDS, AIP (155), COP (144), and eosinophilic pneumonia (Table 8-7) (156). AIP is essentially the idiopathic form of ARDS. It is uncommon and is classified as a subtype of idiopathic interstitial pneumonia (97). The clinical, histologic, and radiologic findings are those of ARDS (155,157) and consist of extensive bilateral areas of ground-glass attenuation and consolidation (Fig. 8-35). AIP is essentially a diagnosis of exclusion: ARDS in which no etiology is found. COP, also known as BOOP, most frequently is initially seen with bilateral areas of consolidation, which in approximately 60% to 80% of cases are peribronchial or subpleural in distribution (Fig. 8-36) (110,144,158). In approximately 60% of patients with BOOP, some of the areas of consolidation involve mainly the perilobular regions and may surround areas with ground-glass attenuation, resulting in a “reversed halo sign” (158,159).
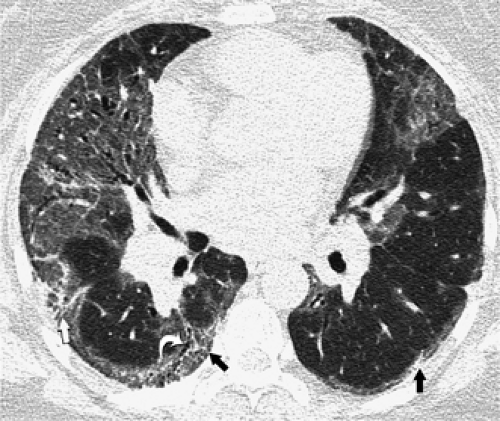 Figure 8-32 Ground-glass opacities and mild reticulation in nonspecific interstitial pneumonia (NSIP). High-resolution CT image shows asymmetric bilateral ground-glass opacities. Also noted are mild subpleural reticulation (straight arrows) and traction bronchiectasis (curved arrow). The patient was a 44-year-old woman with NSIP. |
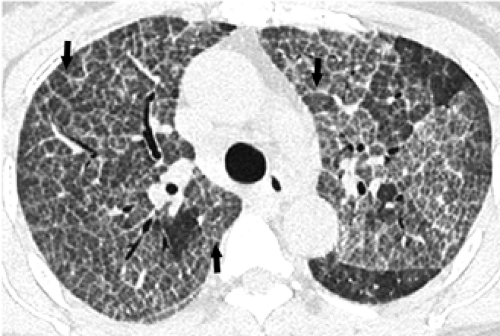 Figure 8-33 Crazy-paving pattern in alveolar proteinosis. High-resolution CT in a patient with alveolar proteinosis shows extensive bilateral ground-glass opacities with superimposed septal lines (arrows), resulting in a “crazy-paving” pattern. (Case courtesy of Dr. Paul Bresser, Amsterdam, The Netherlands.) |
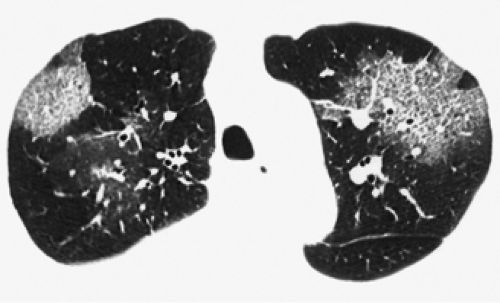 Figure 8-34 Crazy-paving pattern in pulmonary edema. High-resolution CT (1-mm collimation) shows bilateral patchy ground-glass opacities with superimposed septal lines and fine intralobular lines in the upper lobes (crazy-paving pattern). Also noted is a small right pleural effusion. The patient was a 67-year-old man with pulmonary edema secondary to left-sided heart failure. |
In the majority of patients with consolidation, the findings are readily apparent on the radiograph, and CT adds little additional information. However, because the distribution of the consolidation is better appreciated on CT, it sometimes can be helpful in the differential diagnosis.
For example, in up to 50% of patients with chronic eosinophilic pneumonia, the peripheral consolidation (“reverse pulmonary edema pattern”) may not be apparent on the radiograph but can be clearly seen on CT (160). CT can also demonstrate localized collections of fat in patients with patchy or diffuse consolidation caused by lipoid pneumonia (161). It may also be helpful in patients with suspected amiodarone lung by demonstrating the characteristic increased attenuation caused by accumulation of this iodinated agent within the lung parenchyma (Fig. 8-37) (162,162a). It is also helpful in the diagnosis of metastatic pulmonary calcification (163).
For example, in up to 50% of patients with chronic eosinophilic pneumonia, the peripheral consolidation (“reverse pulmonary edema pattern”) may not be apparent on the radiograph but can be clearly seen on CT (160). CT can also demonstrate localized collections of fat in patients with patchy or diffuse consolidation caused by lipoid pneumonia (161). It may also be helpful in patients with suspected amiodarone lung by demonstrating the characteristic increased attenuation caused by accumulation of this iodinated agent within the lung parenchyma (Fig. 8-37) (162,162a). It is also helpful in the diagnosis of metastatic pulmonary calcification (163).
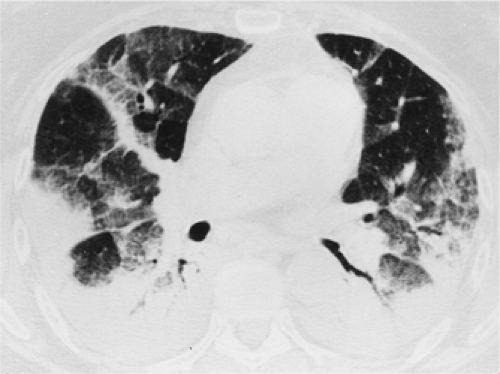 Figure 8-35 Consolidation in acute interstitial pneumonia (AIP). High-resolution CT (1.5-mm collimation) demonstrates bilateral consolidation involving mainly the dependent regions of the lower lobes. Patchy areas of ground-glass attenuation are seen anteriorly. The patient was an 83-year-old woman with AIP. |
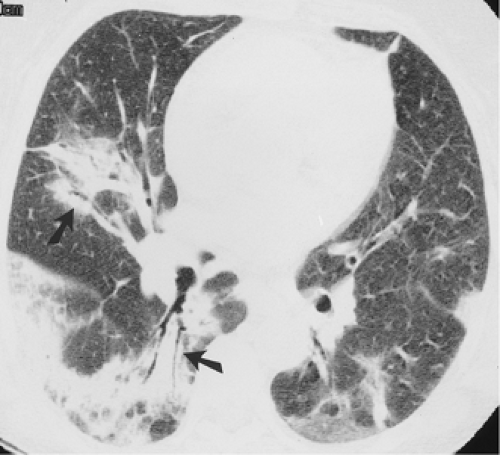 Figure 8-36 Consolidation in cryptogenic organizing pneumonia (idiopathic bronchiolitis obliterans with organizing pneumonia). High-resolution CT (1-mm collimation) demonstrates asymmetric bilateral consolidation. The consolidation is predominantly peribronchial (arrows) and subpleural in distribution. The patient was an 81-year-old woman with cryptogenic organizing pneumonia. |
Table 8-7 Differential Diagnosis of Consolidation | |||||||||||||||||||||||||||||||||||||||||||||
|---|---|---|---|---|---|---|---|---|---|---|---|---|---|---|---|---|---|---|---|---|---|---|---|---|---|---|---|---|---|---|---|---|---|---|---|---|---|---|---|---|---|---|---|---|---|
|
Decreased Attenuation
Decreased lung attenuation may result from lung destruction, as seen in cystic lung disease and emphysema, or from decreased blood flow caused by pulmonary vascular or airway abnormalities. Cysts are rounded air-containing spaces surrounded by well-defined walls. They are commonly seen in IPF (93,95), interstitial fibrosis associated with rheumatoid arthritis (93,164), asbestosis (13,93), and chronic hypersensitivity pneumonitis (Table 8-8) (93,101).
In patients with pulmonary fibrosis, cystic spaces represent honeycombing and are usually associated with architectural distortion and traction bronchiectasis. Honeycomb cysts typically occur in several layers and have clearly definable walls 1 to 3 mm in thickness (Fig. 8-38). The honeycombing in patients with IPF and asbestosis usually is most severe in the subpleural lung regions and in the lung bases. The honeycombing in chronic hypersensitivity pneumonitis is also most marked in the subpleural lung regions but tends to be most severe in the mid lung zones, with relative sparing of the lung bases (93,100). Honeycombing is seen in 10% to 30% of patients with NSIP but tends to be less extensive than in IPF and typically associated with extensive ground-glass opacities and fine intralobular lines (98,99,164a).
In patients with pulmonary fibrosis, cystic spaces represent honeycombing and are usually associated with architectural distortion and traction bronchiectasis. Honeycomb cysts typically occur in several layers and have clearly definable walls 1 to 3 mm in thickness (Fig. 8-38). The honeycombing in patients with IPF and asbestosis usually is most severe in the subpleural lung regions and in the lung bases. The honeycombing in chronic hypersensitivity pneumonitis is also most marked in the subpleural lung regions but tends to be most severe in the mid lung zones, with relative sparing of the lung bases (93,100). Honeycombing is seen in 10% to 30% of patients with NSIP but tends to be less extensive than in IPF and typically associated with extensive ground-glass opacities and fine intralobular lines (98,99,164a).
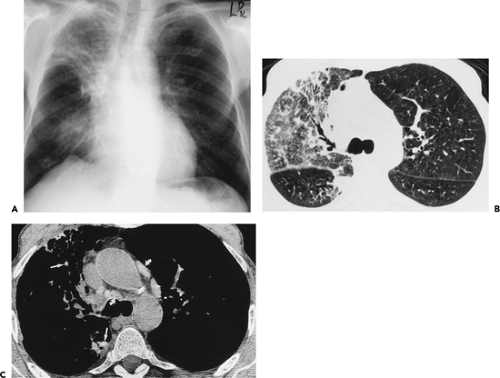 Figure 8-37 Amiodarone lung. A: Chest radiograph demonstrates areas of parenchymal consolidation in the right upper, middle, and lower lobes. Also noted are irregular linear opacities in the right and left upper lobes. B: High-resolution CT (1.5-mm collimation) demonstrates extensive areas of ground-glass attenuation in the right upper lobe and focal areas of consolidation in the right upper and lower lobes, as well as a few irregular linear opacities. C: Mediastinal windows demonstrate focal areas of increased attenuation in the right upper and lower lobes (straight arrows), as well as increased attenuation of the mediastinal lymph nodes (curved arrows). Increased attenuation was also present in the thyroid, heart, and liver (not shown). The patient was a 61-year-old man with amiodarone lung. |
Cystic airspaces are a characteristic finding of lymphangioleiomyomatosis (Fig. 8-39) (165,166). In lymphangio-leiomyomatosis, the cysts are seen throughout the lungs without any zonal predominance. Furthermore, the cysts in patients with lymphangioleiomyomatosis are not related to fibrosis and therefore are surrounded by relatively normal
lung parenchyma (165,166). Cystic spaces similar to those seen in lymphangioleiomyomatosis can also be seen in patients with Langerhans cell histiocytosis (167, 168, 169). The cysts in Langerhans histiocytosis characteristically involve the upper two thirds of the lungs, with relative sparing of the lung bases, often have bizarre shapes, and are commonly associated with nodules. Single or multiple cysts are also seen superimposed on ground-glass opacities in approximately 60% of patients with LIP (89), 10% of patients with subacute hypersensitivity pneumonitis (170), and 30% of patients with Pneumocystis jiroveci pneumonia (171).
lung parenchyma (165,166). Cystic spaces similar to those seen in lymphangioleiomyomatosis can also be seen in patients with Langerhans cell histiocytosis (167, 168, 169). The cysts in Langerhans histiocytosis characteristically involve the upper two thirds of the lungs, with relative sparing of the lung bases, often have bizarre shapes, and are commonly associated with nodules. Single or multiple cysts are also seen superimposed on ground-glass opacities in approximately 60% of patients with LIP (89), 10% of patients with subacute hypersensitivity pneumonitis (170), and 30% of patients with Pneumocystis jiroveci pneumonia (171).
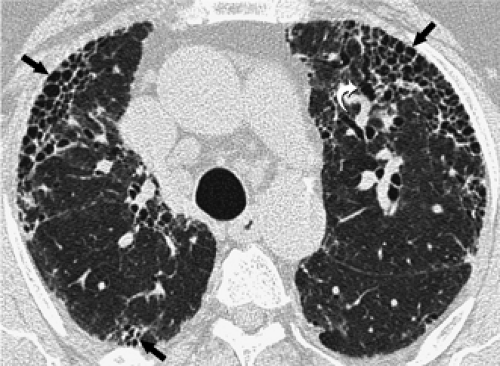 Figure 8-38 Cystic airspaces in idiopathic pulmonary fibrosis (IPF). High-resolution CT (1.5-mm collimation) through the lower lung zones demonstrates numerous cysts (straight arrows) involving mainly the subpleural lung regions. The cysts range from a few millimeters to 1 cm in diameter. Note traction bronchiectasis (curved arrow). The patient was an 81-year-old man with honeycomb lung related to IPF. |
Table 8-8 Differential Diagnosis of Cystic Lung Disease | ||||||||||||||||||||
|---|---|---|---|---|---|---|---|---|---|---|---|---|---|---|---|---|---|---|---|---|
|
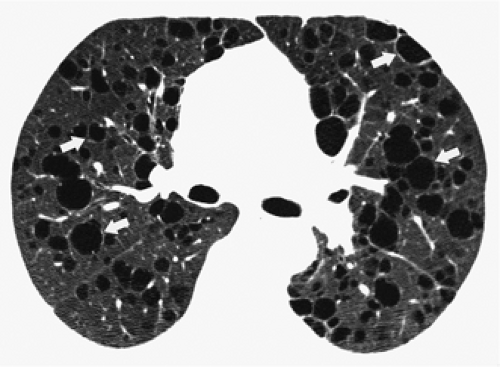 Figure 8-39 Cystic airspaces in lymphangioleiomyomatosis. High-resolution CT (1-mm collimation) shows numerous cysts randomly distributed throughout both lungs. The cysts have thin walls (arrows). The patient was a 59-year-old woman with lymphangioleiomyomatosis. |
Emphysema is defined as a permanent, abnormal enlargement of airspaces distal to the terminal bronchiole and accompanied by the destruction of the walls of the involved airspaces (130). Emphysema is characterized by the presence of areas of abnormally low attenuation without definable walls (172,173). It should be noted, however, that when emphysema involves the entire secondary lobule, the interlobular septa may give the appearance of thin (≤1 mm) walls. Thin walls are also seen with bullae, which are defined as sharply demarcated areas of emphysema measuring 1 cm or more in diameter and possessing a wall of less than 1 mm in thickness (174). Bullae may therefore resemble lung cysts, although the distinction can usually be readily made because bullae are almost always associated with extensive emphysema. Three main forms of emphysema are recognized: centrilobular, typically associated with cigarette smoking; panacinar, typically associated with α1-antitrypsin deficiency; and paraseptal emphysema.
Centrilobular emphysema can be diagnosed by the presence of small lucencies near the center of the secondary lobule (Fig. 8-40) (175). It is usually most severe in the upper lobes. Panacinar (panlobular) emphysema involves mainly the lower lobes and is characterized by the presence of diffuse areas of low attenuation with little intervening normal lung (Fig. 8-41) (176). Paraseptal (distal
acinar) emphysema is characterized by areas of low atten-uation in the subpleural lung regions and adjacent to vessels and interlobular septa (173).
acinar) emphysema is characterized by areas of low atten-uation in the subpleural lung regions and adjacent to vessels and interlobular septa (173).
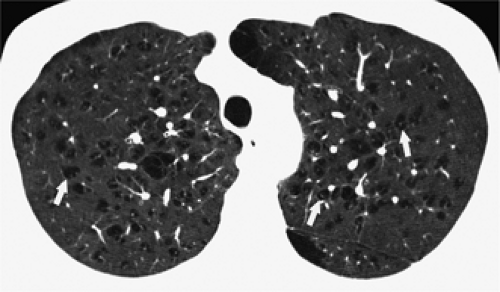 Figure 8-40 Centrilobular emphysema. High-resolution CT (1.5-mm collimation) demonstrates focal areas of decreased attenuation with no definable walls. Note that in several areas, small centrilobular vessels can be seen within the areas of decreased attenuation (arrows). The patient was a 50-year-old smoker with centrilobular emphysema. |
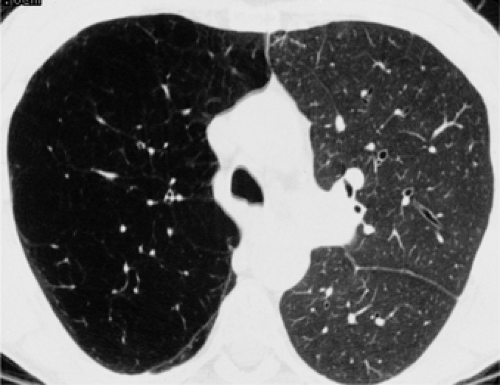 Figure 8-41 Panacinar emphysema. High-resolution CT (1-mm collimation) demonstrates panacinar emphysema in the native right lung and a normal transplanted left lung. Note the characteristic simplification of the lung parenchyma in panacinar emphysema as compared with the normal architecture in the transplanted lung. |
Decreased attenuation may also be caused by decreased perfusion secondary to airway or vascular obstruction (177). Airway obstruction results in decreased ventilation and focal air trapping; areas of poorly ventilated lung are poorly perfused because of reflex vasoconstriction or because of a permanent reduction in the pulmonary capillary bed. Common causes include bronchiolitis obliterans (obliterative bronchiolitis) and other diseases associated with small airways obstruction, such as cystic fibrosis, bronchiectasis of any cause, and asthma (74,178,179). Decreased attenuation can also occur in association with pulmonary vascular obstruction such as that caused by chronic pulmonary thromboembolism (180,181). The areas of decreased attenuation can be of varying sizes and sometimes appear to correspond to lobules, segments, lobes, or an entire lung (182,183). Redistribution of blood flow away from the areas of vascular obstruction leads to increased attenuation in areas of normal lung parenchyma. This combination of areas with decreased attenuation and areas with increased attenuation is known as mosaic perfusion (184).
In some patients, it may be difficult to determine whether a mosaic pattern of lung attenuation is caused by flow redistribution to areas of normal lung or whether it is caused by patchy areas of ground-glass attenuation resulting from infiltrative lung disease (177,185). This distinction, however, can usually be readily made by close attention to the size of the pulmonary vessels and assessment of presence of air trapping on expiratory CT. In patients with a patchy infiltrative process resulting in mosaic attenuation, the number and caliber of vessels are not appreciably different between normal and abnormal regions of lung (Figs. 8-31 and 8-32) (69). A mosaic pattern of lung attenuation caused by pulmonary vascular disease, such as pulmonary arterial hypertension and chronic pulmonary thromboembolism, is associated with a decrease in the number and size of vessels in the areas of low attenuation compared with areas with increased attenuation that have an increase in the number and size of vessels caused by flow redistribution (Fig. 8-42) (69). A similar pattern is seen in patients with flow redistribution caused by primary small airway disease (Fig. 8-43) (69,185). Distinction between mosaic attenuation caused by small airway disease and vascular disease requires careful analysis of associated findings, such as enlargement of central
pulmonary arteries, often seen in patients with chronic thromboembolic pulmonary hypertension, and bronchial dilatation, often seen in patients with small airway disease (177). The distinction can also be facilitated by performing CT at suspended full expiration. In patients with airway disease, the lucent areas show little change in volume and attenuation at end-expiration because of air trapping (185,186). In patients with primary vascular disease, because usually no air trapping is present, the attenuation in both the oligemic and hyperemic lung tends to increase to a similar degree at end-expiration. It should be noted, however, that in some cases, the distinction may not be possible based only on the HRCT findings (177).
pulmonary arteries, often seen in patients with chronic thromboembolic pulmonary hypertension, and bronchial dilatation, often seen in patients with small airway disease (177). The distinction can also be facilitated by performing CT at suspended full expiration. In patients with airway disease, the lucent areas show little change in volume and attenuation at end-expiration because of air trapping (185,186). In patients with primary vascular disease, because usually no air trapping is present, the attenuation in both the oligemic and hyperemic lung tends to increase to a similar degree at end-expiration. It should be noted, however, that in some cases, the distinction may not be possible based only on the HRCT findings (177).
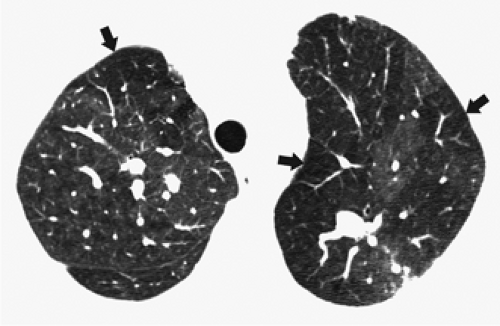 Figure 8-42 Mosaic perfusion. High-resolution CT demonstrates a pattern of mosaic perfusion with focal areas of decreased attenuation and small vessels (arrows), as well as areas with increased attenuation associated with increased size and number of vessels. The patient was a 52-year-old woman with mosaic perfusion caused by chronic pulmonary thromboembolism. |
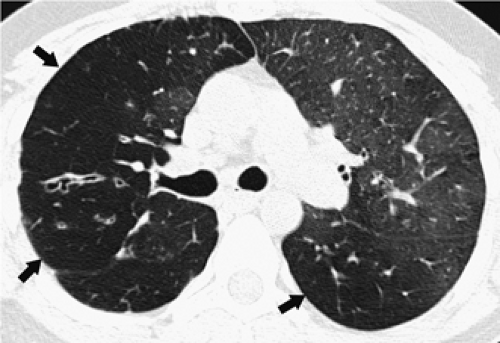 Figure 8-43 Mosaic perfusion. High-resolution CT (1-mm collimation) shows extensive areas of decreased attenuation and vascularity (arrows) in the right lung and left lower lobe and increased attenuation and increased size and number of blood vessels in the left upper lobe, characteristic of mosaic perfusion. This patient was a 20-year-old woman with bronchiolitis obliterans secondary to bone marrow transplantation. |
Chronic Infiltrative Lung Disease
Many chronic diseases may cause diffuse infiltration of the lungs. Although they are often referred to as chronic interstitial diseases, the majority involve both the interstitium and the airspaces. Therefore the term chronic infiltrative lung disease (CILD) is preferable (50,187). Although more than 200 different CILDs are known, approximately 20 conditions account for the vast majority of cases (187, 188, 189). Various classifications of CILDs have been suggested. These have been based on etiology, pathogenesis, or pathologic findings (97,190). From the radiologic point of view, however, it is reasonable to classify the various diseases based on the predominant pattern of abnormality on HRCT (Table 8-9).
Table 8-9 Classification of Most Common Chronic Infiltrative Lung Diseases Based on Predominant Pattern of Abnormality on High-Resolution Computed Tomography | ||
|---|---|---|
|
Diseases Characterized Primarily by Linear and Reticular Opacities
Usual Interstitial Pneumonia and Idiopathic Pulmonary Fibrosis
UIP is the most common and most important of the idiopathic interstitial pneumonias. The idiopathic interstitial pneumonias are a heterogeneous group of interstitial inflammatory and fibrosing lesions that occur without any known cause. The American Thoracic Society and European Respiratory Society multidisciplinary consensus statement in 2002 classified the idiopathic interstitial pneumonias into seven distinct clinicopathologic entities in order of decreasing frequency: usual interstitial pneumonia (UIP), nonspecific interstitial pneumonia (NSIP), cryptogenic
organizing pneumonia (COP; also known as idiopathic bronchiolitis obliterans organizing pneumonia, BOOP), acute interstitial pneumonia (AIP), respiratory bronchiolitis-associated interstitial lung disease (RB-ILD), desquamative interstitial pneumonia (DIP), and lymphoid interstitial pneumonia (LIP) (97). A predominantly reticular pattern is seen in virtually all patients with UIP and in some patients with fibrotic NSIP. The predominant pattern in the majority of patients with cellular NSIP is ground-glass; in COP, it is consolidation; in AIP, it is consolidation or ground-glass; in RB-ILD, it is centrilobular nodular or ground-glass; in DIP, it is ground-glass; and in LIP, it is ground-glass or small nodular pattern (97,107,191). These various entities are discussed under their respective most frequent predominant pattern of presentation. The main role of HRCT is to distinguish patients with typical findings of UIP/IPF from those with the less specific findings seen in the other idiopathic interstitial pneumonias (97).
organizing pneumonia (COP; also known as idiopathic bronchiolitis obliterans organizing pneumonia, BOOP), acute interstitial pneumonia (AIP), respiratory bronchiolitis-associated interstitial lung disease (RB-ILD), desquamative interstitial pneumonia (DIP), and lymphoid interstitial pneumonia (LIP) (97). A predominantly reticular pattern is seen in virtually all patients with UIP and in some patients with fibrotic NSIP. The predominant pattern in the majority of patients with cellular NSIP is ground-glass; in COP, it is consolidation; in AIP, it is consolidation or ground-glass; in RB-ILD, it is centrilobular nodular or ground-glass; in DIP, it is ground-glass; and in LIP, it is ground-glass or small nodular pattern (97,107,191). These various entities are discussed under their respective most frequent predominant pattern of presentation. The main role of HRCT is to distinguish patients with typical findings of UIP/IPF from those with the less specific findings seen in the other idiopathic interstitial pneumonias (97).
UIP is a pathologic entity characterized by a het-erogeneous appearance with alternating areas of normal lung, interstitial inflammation, scattered fibroblastic foci, fibrosis, and honeycombing, involving mainly the subpleural parenchyma and the lung bases (97). UIP is a nonspecific reaction pattern that is usually idiopathic but that may also be seen in collagen-vascular diseases, particularly rheumatoid arthritis, asbestosis, and drug reaction (97). IPF is defined as a chronic fibrosing interstitial pneumonia of unknown cause limited to the lungs and associated with a histologic pattern of UIP (97,192). The diagnosis of IPF therefore is limited to patients with a histologic pattern of UIP in whom no underlying cause is found.
IPF occurs most commonly in patients older than 50 years and is slightly more common in men (97,192). The onset of disease is typically insidious, with gradual onset of dry cough and progressive dyspnea (97,192). These symptoms typically are present for more than 6 months before presentation (97,192). Physical examination shows finger clubbing in 25% to 50% of cases, and chest auscultation reveals Velcro-type fine end-inspiratory crackles most prevalent at the lung bases. The clinical course is invariably one of gradual deterioration. Clinical or radiologic improvement is rare. The median length of survival from time of diagnosis varies between 2.5 and 3.5 years (97,192).
The predominant abnormality on HRCT consists of symmetric bilateral intralobular linear opacities, resulting in a fine reticular pattern involving mainly the subpleural lung regions and lung bases (Table 8-10; Fig. 8-44) (95, 96, 97). The intralobular linear opacities correspond histologically to thin irregular areas of fibrosis (50,95). Also noted are irregular interfaces between the lung and pulmonary vessels, bronchi, and pleural surfaces (36,62). Fibrosis results in dilatation and tortuosity of bronchi and bronchioles, findings referred to as traction bronchiectasis and bronchiolectasis (Fig. 8-45) (68,145). The majority of patients also have honeycombing (50,95,192a). Honeycombing, like the irregular linear pattern, is most severe in the subpleural lung regions and in the lung bases (50,95). Honeycomb cysts usually range from 2 to 20 mm in diameter (32,95). They typically appear to share walls on HRCT and usually occur in several layers in the subpleural lung (Fig. 8-46).
Table 8-10 High-Resolution Computed Tomography Findings in Idiopathic Pulmonary Fibrosis | |
|---|---|
|
In the appropriate clinical setting, the presence of a bilateral, predominantly subpleural and basal reticular pattern associated with traction bronchiectasis and bronchiolectasis or honeycombing in the absence of small nodules, consolidation, or extensive ground-glass opacities allows confident diagnosis of IPF on HRCT, precluding the need for surgical lung biopsy (96,97,192a). In a prospective multicenter study, the positive predictive value of HRCT in diagnosing IPF by using these criteria was 96% (96). In the same study, these characteristic findings were present in 50% of patients. In the remaining patients, the pattern was less characteristic, or the distribution not predominantly subpleural and basal. Although in this prospective study, none of the patients with IPF had normal HRCT findings, the abnormalities in early IPF can be very mild (Fig. 8-47).
A common finding seen in patients with IPF is the presence of ground-glass opacity (95,193). In the majority of patients, the extent of ground-glass opacity is less than the extent of reticulation. However, approximately one third of patients with IPF have an equivalent extent of reticulation and ground-glass opacity, and 10% have predominant ground-glass opacity (99). In these patients, the findings can resemble those of other interstitial lung diseases, particularly NSIP and HP (Figs. 8-48 and 8-49) (194). Ground-glass opacity may indicate the presence of active inflammation and potentially treatable disease or the presence of fibrosis below the resolution of HRCT (131,145). Ground-glass opacity should be considered to represent a potentially reversible process only when no associated HRCT findings of fibrosis are noted. Findings of fibrosis in association with ground-glass opacity, thus suggesting an irreversible process, include intralobular interstitial thickening, honeycombing, and traction bronchiectasis and
bronchiolectasis (Fig. 8-50) (145). Patients who have predominantly ground-glass opacity on HRCT are more likely to respond to treatment than are patients who have predominantly reticulation (133,195). It should be emphasized, however, that most patients who have IPF present with predominant reticulation and have progressive disease and a poor prognosis. Areas of ground-glass opacity frequently can be seen to progress to fibrosis and honeycombing (Fig. 8-51) (196,197). An additional unusual manifestation of IPF is the presence of punctuate
calcifications typically identifiable in the lung bases peripherally, representing focal ossification.
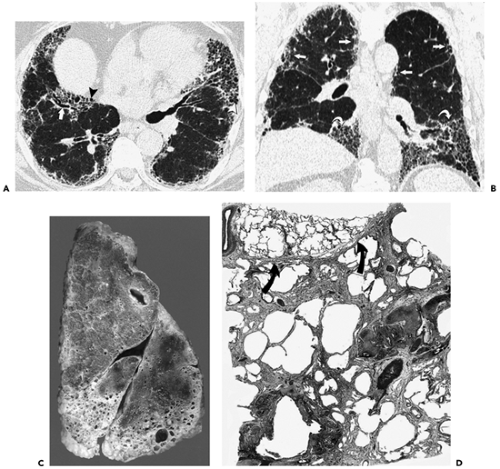 Figure 8-44 Idiopathic pulmonary fibrosis. See Color Figure 8-44C,D. A: High-resolution CT at the level of the lower lung zones demonstrates linear opacities separated by only a few millimeters, causing a fine reticular pattern. Also noted are traction bronchiectasis (arrow) and honeycombing (arrowheads). The abnormalities involve mainly the subpleural lung regions and are most severe in the middle lobe and lingula. B: Coronal reformation demonstrates that the abnormalities involve mainly the subpleural regions (straight arrows) and the lower lung zones (curved arrows). The patient was a 70-year-old man with idiopathic pulmonary fibrosis. C: Sagittal slice of the right lung from a different patient shows severe fibrosis and honeycombing in the basal aspects of the lower and middle lobes. Less marked disease can be seen in the subpleural region of the anterior portion of the upper lobe and the posterior portion of the lower lobe. D: Low-magnification photomicrograph of lung from another patient shows characteristic spatial heterogeneity of idiopathic pulmonary fibrosis. Severe fibrosis and early honeycomb change are present in one lobule and virtually normal lung in the adjacent one. Arrows indicate interlobular septum. (C and D from Müller NL, Fraser RS, Lee KS, et al. Diseases of the lung: radiologic and pathologic correlations. Philadelphia: Lippincott Williams & Wilkins; 2003 , with permission.) |
 Figure 8-45 Idiopathic pulmonary fibrosis with traction bronchiectasis. High-resolution CT at the level of the lower lung zones shows extensive reticulation throughout the left lower lobe with considerable associated volume loss. The bronchi within the areas of reticulation are dilated and distorted and have a beaded appearance (arrows), a finding characteristic of traction bronchiectasis. Mild subpleural reticulation is seen in the right lung. The patient was a 76-year-old man with idiopathic pulmonary fibrosis. |
The clinical course of IPF is typically one of gradual deterioration over several months or years, with progression of parenchymal abnormalities on serial HRCT scans. In a small percentage of patients, acute exacerbation of IPF develops, a condition characterized by marked exacerbation of dyspnea and a decrease in arterial oxygen tension (PaO2) of more than 10 mm Hg within 1 month, in the absence of infection or heart failure (198,199). Histologically, these patients have diffuse alveolar damage superimposed on the interstitial fibrosis or, less commonly, extensive active fibroblastic foci (198,200). Acute
exacerbation is characterized on HRCT by the rapid development of multifocal bilateral areas of ground-glass opacity, consolidation, or both, superimposed on a background of interstitial fibrosis (Fig. 8-52) (198,201,201a). In this setting, the presence of extensive areas of ground-glass correlates with a poor prognosis (198,201a)
exacerbation is characterized on HRCT by the rapid development of multifocal bilateral areas of ground-glass opacity, consolidation, or both, superimposed on a background of interstitial fibrosis (Fig. 8-52) (198,201,201a). In this setting, the presence of extensive areas of ground-glass correlates with a poor prognosis (198,201a)
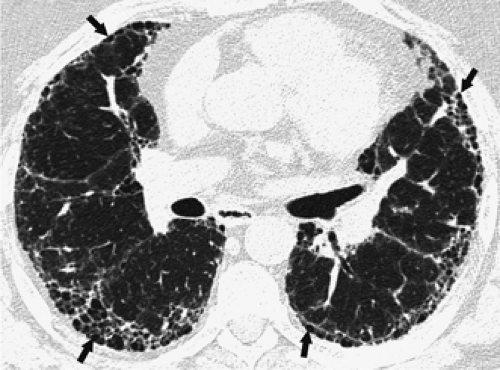 Figure 8-46 Honeycombing in idiopathic pulmonary fibrosis. High-resolution CT shows small honeycomb cysts (arrows) in the subpleural regions of both lungs. The honeycomb cysts range from a few millimeters to approximately 1 cm in diameter and have thin walls. The patient was a 63-year-old man with idiopathic pulmonary fibrosis. |
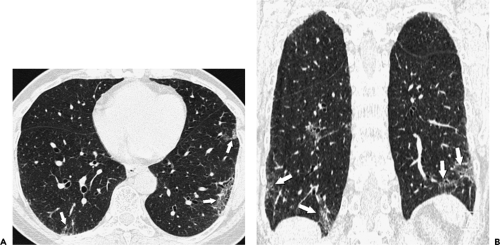 Figure 8-47 Early idiopathic pulmonary fibrosis. A: High-resolution CT (1-mm collimation) obtained on a multidetector CT shows small foci of ground-glass attenuation and mild reticulation (arrows) in the subpleural lung regions. B: Coronal reformation demonstrates that the abnormalities (arrows) involve almost exclusively the lower lobes. The patient was a 60-year-old woman with idiopathic pulmonary fibrosis. |
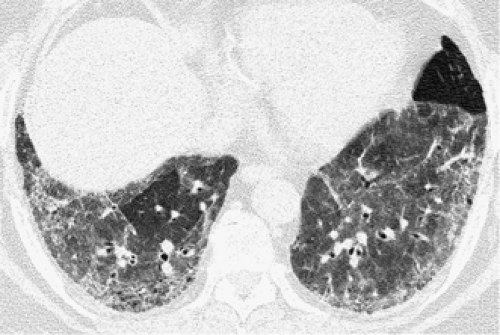 Figure 8-48 Idiopathic pulmonary fibrosis with predominantly ground-glass opacities. High-resolution CT (1.3-mm collimation) shows extensive ground-glass opacities throughout the lower lobes. Mild fine reticulation is present in the subpleural lung regions. The patient was a 57-year-old man with idiopathic pulmonary fibrosis. |
Consolidation and nodules are uncommon in IPF and should suggest the presence of complications such as superimposed infection or pulmonary carcinoma. Risk of lung cancer is increased in patients who have IPF and can appear as a nodule, as a focal area of consolidation, or as hilar or mediastinal lymphadenopathy (202,203). Patients with IPF are also at increased risk for tuberculosis, which may appear as a solitary nodule, multiple nodules, or focal areas of consolidation (204).
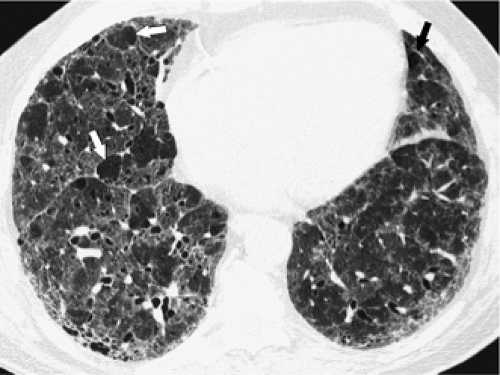 Figure 8-49 Idiopathic pulmonary fibrosis with predominately ground-glass opacities. High-resolution CT (1-mm collimation) shows extensive bilateral ground-glass opacities throughout the lower lobes. Localized lobular areas of normal or decreased attenuation (arrows) are present, a finding commonly seen in hypersensitivity pneumonitis. Mild reticulation is seen in the subpleural lung regions. No evidence of hypersensitivity pneumonitis was identified at surgical biopsy or clinical and laboratory evaluation. The patient was a 67-year-old man with idiopathic pulmonary fibrosis. |
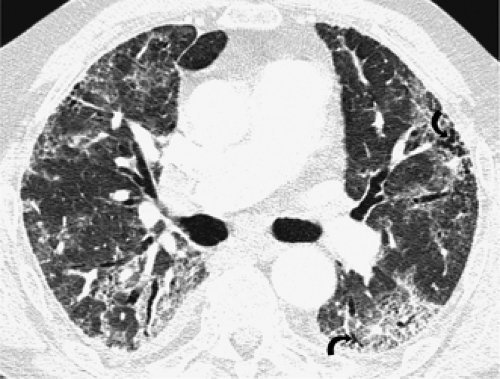 Figure 8-50 Ground-glass opacities due to fibrosis. High-resolution CT shows bilateral ground-glass opacities. Note superimposed fine reticular pattern and traction bronchiectasis (arrows), indicating the presence of fibrosis. The patient was a 62-year-old man with idiopathic pulmonary fibrosis. |
Enlarged mediastinal lymph nodes are present in 70% to 90% of patients with IPF (205,206). They usually measure between 10 and 15 mm in short axis diameter and involve only one or two nodal stations (206). The prevalence of enlarged nodes correlates with the extent of parenchymal abnormalities on HRCT (207). In the majority of patients, the enlarged nodes become normal in size after administration of corticosteroids (208).
Asbestosis
Asbestosis is defined as interstitial fibrosis caused by inhalation of asbestos fibers (209). The severity and rate of progression of asbestosis correlate with exposure level (190,209). It characteristically occurs 15 to 20 years after exposure, with disease progressing even after exposure has ceased. Initially, asbestosis affects respiratory bronchioles with development of peribronchiolar fibrosis (94,210,211). As the fibrosis progresses, it involves the alveolar walls throughout the lobule and, eventually, the interlobular septa. Honeycombing can be seen in advanced cases. The fibrosis tends to be patchy and is usually most severe in the subpleural regions of the lower lobes and posterior lungs (211). The fibrosis histologically resembles UIP, the two main differences being the presence of asbestos bodies and a paucity of fibroblastic foci in asbestosis (190).
As pathologic evaluation is not usually obtained in individual cases, assessing pulmonary parenchymal fibrosis has necessitated the development of a constellation of
clinical, functional, and radiographic findings to establish the diagnosis of asbestosis in vivo. The diagnosis can be inferred when a reliable history of nontrivial exposure to asbestos is known along with a combination of (a) restrictive lung disease on pulmonary function testing as well as a diffusion abnormality; (b) the presence of rales at auscultation; and (c) abnormal chest radiograph, defined as an International Labour Office (ILO) profusion (severity) score of 1/1 or greater (212). It has been suggested that among these, the findings on the chest radiograph are the most important (212).
clinical, functional, and radiographic findings to establish the diagnosis of asbestosis in vivo. The diagnosis can be inferred when a reliable history of nontrivial exposure to asbestos is known along with a combination of (a) restrictive lung disease on pulmonary function testing as well as a diffusion abnormality; (b) the presence of rales at auscultation; and (c) abnormal chest radiograph, defined as an International Labour Office (ILO) profusion (severity) score of 1/1 or greater (212). It has been suggested that among these, the findings on the chest radiograph are the most important (212).
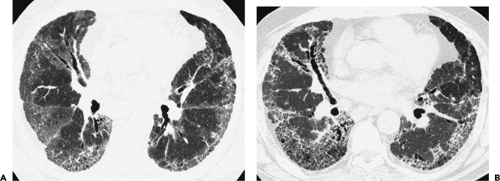 Figure 8-51 Progression of ground-glass opacities to reticulation. A: High-resolution CT (1.3-mm collimation) shows bilateral ground-glass opacities. Mild reticulation is present mainly in the subpleural regions. B: High-resolution CT at the same level 2 years later shows replacement of ground-glass opacities by reticulation, indicating progression to fibrosis. Clinically the patient had deteriorated, with development of more severe dyspnea and restrictive lung function. The patient was a 57-year-old woman with idiopathic pulmonary fibrosis. |
Unfortunately, there are limitations to the value of radiographic interpretation in defining a population with asbestos-induced abnormalities (Fig. 8-53). In a review of 200 admission chest radiographs interpreted according to the ILO classification of diffuse lung disease, 22 (11%) patients without occupational exposure had abnormalities that otherwise might have been interpreted as indicative of significant dust exposure (213). Additionally, radiographic–pathologic correlative studies have shown that interstitial fibrosis may be present despite normal-appearing chest radiographs in up to 20% of patients (214, 215, 216). Added to these difficulties are significant problems with interobserver variability, specifically in the interpretation of opacities of mild profusion (217).
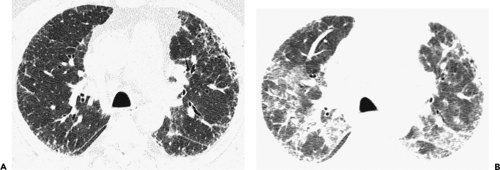 Figure 8-52 Acute exacerbation of idiopathic pulmonary fibrosis (IPF). A: High-resolution CT (1-mm collimation) at the level of the upper lobes shows bilateral reticular pattern in the subpleural regions. The patient had mild symptoms. B: High-resolution CT at the same level 7 months later, when the patient had sudden worsening of symptoms and severe hypoxemia, shows extensive bilateral ground-glass opacities and small areas of consolidation. Surgical biopsy demonstrated diffuse alveolar damage superimposed on usual interstitial pneumonia, a characteristic finding of acute exacerbation of IPF. The patient was a 64-year-old woman with idiopathic pulmonary fibrosis. |
Several studies have shown that HRCT is more sensitive than the radiograph in the detection of asbestosis (53,218,219). In one study of 169 asbestos-exposed
individuals with normal or near normal chest radiographic findings (ILO score, 0/0 or 0/1), 57 (34%) had findings suggestive of asbestosis on HRCT (219). HRCT can also be valuable for eliminating the diagnosis of asbestosis in patients who have chest radiographic findings that suggest this disease, but who have some other abnormality. Approximately 20% of patients suspected of having interstitial disease on the basis of plain radiographs have been shown by HRCT to have emphysema, prominent vessels, pleural disease, or bronchiectasis as the cause of their abnormal plain film findings (220). Based on the evidence in the literature, a statement of the American Thoracic Society in 2004 on the diagnosis of asbestosis and other benign asbestos-related diseases emphasized that HRCT plays an important role “when radiographic findings are equivocal, when diminished pulmonary function is identified in association with otherwise normal plain chest radiographic findings, and when extensive overlying pleural abnormalities do not allow a clear interpretation of the parenchymal markings” (209).
individuals with normal or near normal chest radiographic findings (ILO score, 0/0 or 0/1), 57 (34%) had findings suggestive of asbestosis on HRCT (219). HRCT can also be valuable for eliminating the diagnosis of asbestosis in patients who have chest radiographic findings that suggest this disease, but who have some other abnormality. Approximately 20% of patients suspected of having interstitial disease on the basis of plain radiographs have been shown by HRCT to have emphysema, prominent vessels, pleural disease, or bronchiectasis as the cause of their abnormal plain film findings (220). Based on the evidence in the literature, a statement of the American Thoracic Society in 2004 on the diagnosis of asbestosis and other benign asbestos-related diseases emphasized that HRCT plays an important role “when radiographic findings are equivocal, when diminished pulmonary function is identified in association with otherwise normal plain chest radiographic findings, and when extensive overlying pleural abnormalities do not allow a clear interpretation of the parenchymal markings” (209).
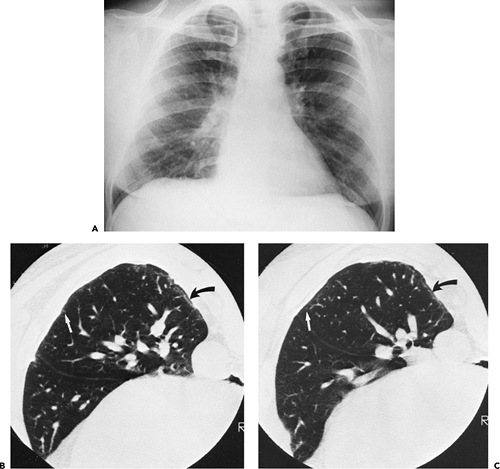 Figure 8-53 Asbestosis. A: Posteroanterior radiograph shows minimal nodularity of the right hemidiaphragm. The lungs appear normal. B, C: Sequential 1.5-mm target reconstructed sections through the right lower lobe obtained with the patient in a prone position show subtle parenchymal changes consistent with asbestosis. In addition to pleural plaques, intralobular lines and dots (straight arrows in B and C) are identifiable. These result in a prominent subpleural curvilinear line posteromedially (curved arrows in B and C). |
In many cases, the fibrosis in asbestosis is mild and limited to the dependent regions of the lower lung zones. It may be difficult, if not impossible, to distinguish mild fibrosis in these areas from normal increase in attenuation and atelectasis in the dependent lung. Therefore, it is recommended that in patients being assessed for asbestosis, HRCT scans be obtained in both supine and prone positions (13,221). Although in most cases the scans should be obtained at 10- or 20-mm intervals, a limited technique consisting of four or five equally spaced scans obtained from the level of the tracheal carina to the diaphragm has been shown to have good sensitivity in the detection of asbestosis and may be appropriate for screening (222). Accurate depiction of asbestosis and asbestos-related pleural disease has also been shown by using low-dose technique (60 to 100 mAs) with automatic dose modulation and continuous spiral CT through the chest performed on a multidetector scanner (223). The main advantage of using continuous multidetector CT scanning is that it allows concurrent search for malignant asbestos-related processes of the lungs and pleura in these high-risk individuals (223).
Asbestosis can usually be readily recognized on HRCT by the presence of fibrosis associated with pleural plaques or diffuse pleural thickening (Table 8-11). The earliest pulmonary abnormalities on HRCT in patients with asbestos exposure consist of subpleural nodules or dotlike opacities 1 mm or less in diameter (224). The nodules are situated a few millimeters away from the pleura and occasionally appear as fine branching structures (Fig. 8-54) (224). The subpleural nodules reflect the presence of centrilobular, peribronchiolar fibrosis (94,224). Although peribronchiolar fibrosis is the earliest parenchymal finding seen in patients with asbestos exposure, it is not considered asbestosis. The 2004 statement of the American Thoracic Society defines asbestosis specifically as interstitial fibrosis caused by the deposition of asbestos fibers in the lung (209). It does not consider lesions of the membranous bronchioles to be asbestosis. The mildest form of asbestosis histologically consists of involvement of the alveolated walls of respiratory bronchioles and the alveolar ducts (209). Confluence of nodules leads to pleura-based nodular irregularities and subpleural curvilinear lines (Figs. 8-54 and 8-55) (224). As the fibrosis progresses, extending from the peribronchiolar region to involve the alveolar walls, intralobular lines and irregular thickening of the interlobular septa are seen on HRCT (Figs. 8-56 and 8-57) (224).
These findings reflect the presence of interstitial fibrosis (i.e., asbestosis). With further progression of fibrosis, architectural distortion, traction bronchiectasis, and eventually honeycombing are seen (Fig. 8-58) (93,225). Pathologically and on HRCT, the findings are most severe in the subpleural lung regions of the lower lung zones (Fig. 8-57) (190,209). Other common findings in asbestosis include curvilinear subpleural lines and parenchymal bands. In patients with asbestosis, curvilinear subpleural lines may be caused by early peribronchiolar fibrosis combined with collapse of alveoli caused by fibrosis (224), fine honeycombing (226), or atelectasis (Fig. 8-55) (220). They are, however, a nonspecific finding, being seen in the dependent lung regions in up to 20% of subjects without history of exposure to asbestos (53,227). Parenchymal bands are linear densities 2 to 5 cm in length coursing through the lungs and usually attaching to the pleura (Fig. 8-59) (53,94). Parenchymal bands may be caused by thickened septa marginating several secondary lobules, fibrosis along the bronchovascular sheaths, coarse scars, or areas of atelectasis (94,227). Although parenchymal bands are common in asbestosis, being seen in 60% to 80% of patients (13,228), they are not specific, being present in 10% to 20% of patients with various lung diseases not related to asbestos (227,228).
These findings reflect the presence of interstitial fibrosis (i.e., asbestosis). With further progression of fibrosis, architectural distortion, traction bronchiectasis, and eventually honeycombing are seen (Fig. 8-58) (93,225). Pathologically and on HRCT, the findings are most severe in the subpleural lung regions of the lower lung zones (Fig. 8-57) (190,209). Other common findings in asbestosis include curvilinear subpleural lines and parenchymal bands. In patients with asbestosis, curvilinear subpleural lines may be caused by early peribronchiolar fibrosis combined with collapse of alveoli caused by fibrosis (224), fine honeycombing (226), or atelectasis (Fig. 8-55) (220). They are, however, a nonspecific finding, being seen in the dependent lung regions in up to 20% of subjects without history of exposure to asbestos (53,227). Parenchymal bands are linear densities 2 to 5 cm in length coursing through the lungs and usually attaching to the pleura (Fig. 8-59) (53,94). Parenchymal bands may be caused by thickened septa marginating several secondary lobules, fibrosis along the bronchovascular sheaths, coarse scars, or areas of atelectasis (94,227). Although parenchymal bands are common in asbestosis, being seen in 60% to 80% of patients (13,228), they are not specific, being present in 10% to 20% of patients with various lung diseases not related to asbestos (227,228).
Table 8-11 High-Resolution Computed Tomography Findings in Asbestosis | |
|---|---|
|
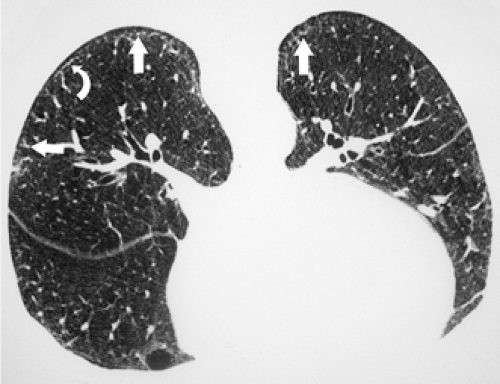 Figure 8-54 Early parenchymal abnormalities in an asbestos-exposed individual. High-resolution CT (1.5-mm collimation) performed with the patient prone shows subpleural dotlike and branching opacities (straight arrows). Confluence of dotlike opacities results in subpleural curvilinear opacity (curved arrow). These findings represent the earliest parenchymal abnormality in individuals with asbestos exposure and reflect the presence of peribronchiolar fibrosis. Peribronchiolar fibrosis in patients with asbestos exposure is not by itself sufficient for a diagnosis of asbestosis. The patient was a 56-year-old man with history of asbestos exposure. (Case courtesy of Dr. Jorge Kavakama, Säo Paulo, Brazil.) |
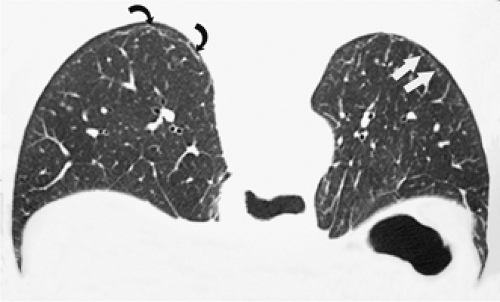 Figure 8-55 Subpleural curvilinear lines in an asbestos-exposed individual. High-resolution CT (1.5-mm collimation) performed with the patient prone shows curvilinear lines (curved arrows) and dotlike opacities (straight arrows). The patient was a 68-year-old man with a history of asbestos exposure. (Case courtesy of Dr. Jorge Kavakama, Säo Paulo, Brazil.) |
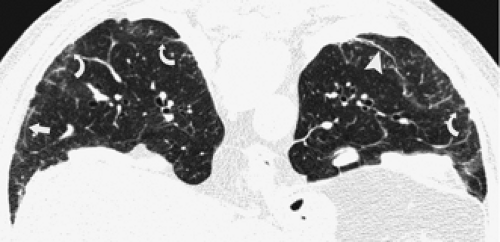 Figure 8-56 Asbestosis. High-resolution CT (1.5-mm collimation) performed with the patient prone shows subpleural line (straight arrow), parenchymal band (arrowhead), nondependent ground-glass opacities, and a few irregular linear opacities (curved arrows). These findings are consistent with asbestosis. Also noted are bilateral diaphragmatic pleural plaques. The patient was a 71-year-old man with asbestosis. |
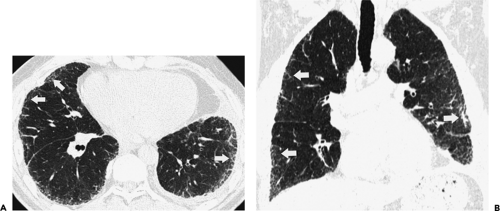 Figure 8-57 Asbestosis. A: High-resolution CT (1-mm collimation) performed on a multidetector CT scanner shows irregular linear opacities (arrows) in the subpleural lung regions. B: Coronal reformation demonstrates predominant distribution of the irregular linear opacities in the subpleural regions and lower lung zones. Also noted is diffuse left pleural thickening. The patient was a 76-year-old man with asbestosis. |
The HRCT findings of asbestosis resemble those of IPF. The main differences are the more-marked basal and subpleural distribution of disease in asbestosis (229) and the greater prevalence of subpleural dotlike or branching opacities, parenchymal bands, and subpleural lines and lower prevalence of honeycombing and traction bronchiolectasis in asbestosis (92). Ground-glass opacities are relatively uncommon in patients with asbestosis and when present usually are not extensive (228). They correlate with the presence of mild alveolar wall fibrosis or edema (94).
The diagnosis of asbestosis on HRCT is based on clinical history of exposure, findings indicative of bilateral pulmonary fibrosis and bilateral pleural plaques or diffuse pleural thickening. The specificity of the diagnosis increases with the number of parenchymal abnormalities present on HRCT (225). In a study correlating HRCT and histopathologic findings, in 25 patients with asbestosis and 5 without, the HRCT findings in patients with confirmed asbestosis consisted of interstitial lines (84%), parenchymal bands (76%), architectural distortion of secondary pulmonary lobules (56%), subpleural lines (44%), and honeycombing (32%) (225). The likelihood of asbestosis being present histopathologically increased
from 60% in patients with one of these abnormalities on HRCT, 80% in patients with two, and 100% in patients with three or more abnormalities. However, the sensitivity decreased from 88% for a diagnosis based on the presence of only one of the five abnormalities, to 78% for two abnormalities, and 56% for three abnormalities (225). The extent of parenchymal abnormalities on HRCT correlates with the severity of functional impairment (230).
from 60% in patients with one of these abnormalities on HRCT, 80% in patients with two, and 100% in patients with three or more abnormalities. However, the sensitivity decreased from 88% for a diagnosis based on the presence of only one of the five abnormalities, to 78% for two abnormalities, and 56% for three abnormalities (225). The extent of parenchymal abnormalities on HRCT correlates with the severity of functional impairment (230).
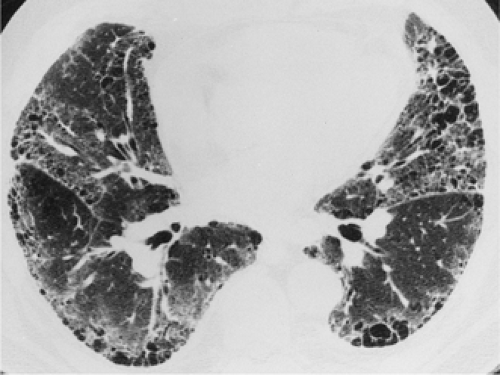 Figure 8-58 Asbestosis with honeycombing. High-resolution CT in a 59-year-old patient with advanced asbestosis demonstrates extensive bilateral honeycombing involving mainly the subpleural lung regions. |
Lymphangitic Carcinomatosis
Pulmonary lymphangitic carcinomatosis refers to the spread of tumor within pulmonary lymphatics. It usually results from a hematogenous spread to lung, with subsequent interstitial and lymphatic invasion, but can also occur because of direct lymphatic spread of tumor from mediastinal and hilar lymph nodes (231,232). It is most commonly secondary to adenocarcinoma arising from the breast, lung, gastrointestinal tract, or prostate, or less commonly from an unknown primary (231).
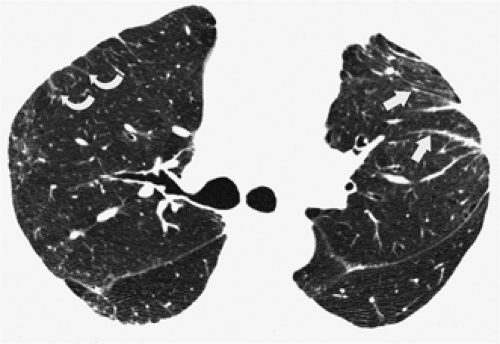 Figure 8-59 Parenchymal bands. High-resolution CT (1-mm collimation) shows left upper lobe parenchymal bands (straight arrows) coursing toward the pleura. Note associated volume loss with forward displacement of the left major fissure. Irregular linear opacities and irregular septal thickening (curved arrows) are present in the right upper lobe. The patient was a 65-year-old man with asbestosis. |
The characteristic abnormalities consist of thickening of the interlobular septa and thickening of the peribronchovascular and subpleural interstitium with preservation of normal lung architecture (Fig. 8-60) (64,65,233). The thickened interlobular septa are most commonly identified as lines 1 to 2 cm in length contacting the pleural surface or as polygonal arcades in the more central lung regions (36,64,65). The thickened septa may be smooth or have a beaded or nodular appearance caused by tumor growth along the lymphatics (Fig. 8-61) (64,65,233). Similarly, the thickening of the peribronchovascular interstitium may be smooth or nodular (Fig. 8-62) (64). Thickening of the interstitium along the centrilobular artery is frequently seen in the areas with interlobular septal thickening, resulting in a prominent centrilobular dot. Smooth or nodular thickening of the subpleural interstitium is also frequently present, being particularly well seen in the region of the interlobar fissures. Discrete small nodules may also be present (36,83). A distinctive feature of lymphangitic carcinomatosis is the preservation of normal lobular architecture, allowing easy distinction from pulmonary fibrosis. Although lymphangitic carcinomatosis is most commonly bilateral and diffuse, it may occasionally be focal or unilateral in distribution (Fig. 8-63) (64,65).
Stay updated, free articles. Join our Telegram channel

Full access? Get Clinical Tree


