Aorta, Arch Vessels, and Great Veins
Over the past decade, rapid changes in imaging technology have revolutionized our ability to study the great vessels of the thorax. Parallel developments in multidetector computed tomography (MDCT), magnetic resonance (MR), and transesophageal echocardiography (TEE) now present referring clinicians with a wide range of options for evaluating diseases of the aorta and great vessels.
All of these techniques provide excellent diagnostic accuracy for a wide range of thoracic aortic diseases (1, 2). Because TEE is widely available, can be performed in the intensive care unit or the operating room, and is extremely versatile in the appropriate hands, it has emerged as a valuable tool for evaluating the thoracic aorta in the acute setting (1, 3, 4). In addition to being indispensable for evaluating the aortic valve, the introduction of multiplane probes has extended the utility of TEE in the diagnosis of protruding aortic atheromas of the thoracic aorta, a newly recognized etiology for stroke and peripheral embolization.
Because many elderly patients with acquired thoracic aortic disease have concomitant coronary artery disease
and 16- or 64-slice MDCT can simultaneously evaluate both the thoracic aorta and the coronary arteries in a single breath-hold, it has become the standard examination for evaluation of patients with acute aortic disease. It is easy to perform, relatively noninvasive, and less operator dependent than TEE. MDCT also offers a range of reconstruction and display options. Most important, unlike TEE, MDCT allows simultaneous evaluation of the entire thorax, markedly extending the range of potential diagnoses, especially in patients with nonspecific symptoms only indirectly suggestive of cardiovascular disease.
and 16- or 64-slice MDCT can simultaneously evaluate both the thoracic aorta and the coronary arteries in a single breath-hold, it has become the standard examination for evaluation of patients with acute aortic disease. It is easy to perform, relatively noninvasive, and less operator dependent than TEE. MDCT also offers a range of reconstruction and display options. Most important, unlike TEE, MDCT allows simultaneous evaluation of the entire thorax, markedly extending the range of potential diagnoses, especially in patients with nonspecific symptoms only indirectly suggestive of cardiovascular disease.
Although rarely performed in the acute setting, MR and MR angiography (MRA) have also emerged as versatile tools for the evaluation of both congenital and acquired diseases of the thoracic aorta. This is a result of the rapid technologic advances in both hardware and pulse sequences as well as the use of contrast agents that shorten the T1 relaxation rate of blood (5). This evolution is now reflected in many institutions where MRA has replaced diagnostic thoracic aortography in stable patients with nontraumatic thoracic aortic disease.
Given this wide range of potential choices, the purpose of this chapter is to focus on a review of disease entities affecting the aorta and great vessels, with special emphasis placed on the advantages and limitations of CT and MR in clinical practice. In this regard, recent advances in therapeutic techniques that have equally revolutionized our approaches to these disorders are also discussed.
Imaging Techniques
Computed Tomography Angiography
Optimization of image quality for multidetector CT angiography (CTA) requires careful attention to methods of data acquisition (6, 7, 8, 9). The ability to acquire data volumetrically has resulted in a wide variety of potential scan protocols for axial imaging. Variables that need to be selected include collimation, pitch, breath-hold period, field of view (FOV), reconstruction interval (or index), rate and volume of intravenous contrast administration, reconstruction algorithm, and radiation dose.
To date, numerous articles have addressed the issue of optimal data acquisition protocols (6, 7, 8, 9). Unfortunately, no single set of optimal scan parameters currently suffices for all intrathoracic CTA applications. CTA techniques often reflect a combination of personal or institutional preferences coupled with individual manufacturer capabilities. Nonetheless, general guidelines can be derived from review of the literature.
Scan Parameters
In practice, it is necessary to compromise between use of the thinnest possible collimation, smallest reconstruction interval, and largest available pitch. In our experience this is most usefully accomplished by obtaining 1- to 2.5-mm sections with scans obtained in a cephalocaudad direction during a single breath-hold period using a pitch of 1 to 2. The introduction of subsecond (0.4 second) scanners makes acquisition of thinner sections throughout the entire thorax more practicable, increasing the scan volume while maintaining the same collimation and pitch. The routine use of ultra thin (<1 mm) sections should be limited to evaluation of the coronary arteries because of image processing time, storage requirements, and, most importantly, image review time. It may be anticipated that with further technologic improvements, routine studies may result in literally thousands of images; routine electrocardiographic (ECG)–gated aortic studies reconstructed at multiple phases are already 1 to 2,000 images. Clearly, selection of optimal scan parameters will continue to necessitate compromise with the exigencies of image storage, display, and interpretation. The benefit of the faster scanners (64 detectors) is that the entire thorax can be evaluated in as little as 5 seconds, whereby even the sickest patients may be able to suspend respiration.
Contrast Administration
Iodine Concentration, Flow Rate, and Volume
Optimal contrast administration is critical to the successful performance of CTA (10–18). Considerations include volume, route and rate of injection, iodine concentration and osmolality, use of a saline flush, timing of scan acquisition, and methods to diminish scan artifacts related to contrast administration.
Although adequate vascular opacification can be obtained with as little as 50 mL of 300 mg I/mL contrast media followed by a saline flush (10), most investigators use a considerably higher volume of contrast for CT angiographic applications. Typically, 75 to 100 mL of nonionic contrast material (averaging 300 mg I/mL) is injected through an antecubital vein using an 18- to 20-gauge catheter, at rates varying between 4 and 5 mL/second, with images obtained following a test bolus of contrast or an automated triggering approach. A right arm approach is preferred to minimize streak artifact across the aortic arch and proximal vessels and to eliminate the possibility of contrast obstruction as the left innominate vein crosses the sternum. Nonionic contrast agents are used to minimize the effects of nausea and vomiting as well as complications arising from extravasations caused by the rapid infusion of ionic contrast agents. Patients with renal insufficiency can be studied with a reduced dose (50 mL) of a low-osmolar agent or with gadolinium diethylenetriaminepenta-acetic acid (DTPA).
The use of injectable saline solution via a power injector as a means to deliver contrast material is widely employed in coronary CTA to clear the right ventricle of residual contrast, allowing better visualization of the right coronary
artery. Before the advent of dual-head power injectors, Hopper et al. (18) first loaded 75 mL of 60% nonionic contrast medium into a power injector in a vertical position, followed by 50 mL of normal saline solution loaded so as to lie on top of the denser nonionic contrast material. Meant to decrease the volume and cost of nonionic contrast material utilization, while using the saline to clear the syringe and intravenous catheter of contrast material following the injection, this approach has the added benefit of significantly decreasing the number of streak artifacts from adjacent venous structures. Newer power injectors contain multiple ports to provide an automated saline flush following the bolus of iodinated contrast with freely selectable flow rates.
artery. Before the advent of dual-head power injectors, Hopper et al. (18) first loaded 75 mL of 60% nonionic contrast medium into a power injector in a vertical position, followed by 50 mL of normal saline solution loaded so as to lie on top of the denser nonionic contrast material. Meant to decrease the volume and cost of nonionic contrast material utilization, while using the saline to clear the syringe and intravenous catheter of contrast material following the injection, this approach has the added benefit of significantly decreasing the number of streak artifacts from adjacent venous structures. Newer power injectors contain multiple ports to provide an automated saline flush following the bolus of iodinated contrast with freely selectable flow rates.
Scan Delay
In addition to considerations of flow rates and volume, it is also essential to optimize scan delay to ensure adequate opacification of targeted vessels. Although a 20- to 30-second scan delay most often is sufficient to ensure adequate opacification of the thoracic aorta, large variations between patients will be encountered. As reported by Van Hoe et al. (19), in their evaluation of scan delay times in spiral CTA using a test bolus injection, the time to peak attenuation within the aorta varied between 11 and 32 seconds (mean 20, standard deviation 6.1 seconds). This problem is easily resolved by administering 20 mL of contrast media injected at the same rate as the planned injection, with images obtained at the same preselected level (usually the middle ascending aorta or arch) using 80 to 90 mAs. As discussed in Chapter 3, a similar approach may be used to optimize evaluation of the pulmonary arteries. Alternatively, it is now possible to obtain equivalent data using automated scan acquisitions to monitor vascular opacification without the use of a test dose [C.A.R.E bolus (Siemens) or Smartprep (GE Medical Systems, Milwaukee, WI)]. Although administration of a test dose of contrast does have the theoretical deleterious effect of increasing the background attenuation of abdominal organs, rendering visualization of small vessels more difficult with CTA, this consideration is of much less concern within the thorax. An advantage of using a test dose (timing bolus) over an automated triggering technique is the ability to test the integrity of the intravenous line without having to give the entire bolus of contrast. Furthermore, it is not uncommon for an oncologic patient to have an occlusion of a great vein, resulting in collateral pathways of contrast to the aorta with subsequent suboptimal aortic enhancement that may preclude accurate triggering.
Electrocardiographic Triggering
The use of retrospective ECG triggering or “gating” is pivotal in coronary CTA (8, 9), but its routine use for thoracic aortic CT is unclear. Image quality, especially at the aortic root, is clearly superior to ungated aortic MDCT. Potential disadvantages of routine use of ECG triggering include longer examination times (lead set-up), longer breath-holds to cover the same anatomic region (except for the 64-slice machine, in which it is negligible), two- to threefold increase in radiation dose, and the reconstruction of at least a thousand more images. The benefits include simultaneous evaluation of the coronary arteries in patients with aortic dissection and aneurysms and the ability to evaluate synthetic valve function in patients who have undergone prosthetic valve replacement or composite graft placement. A recent study compared ECG gated with nongated MDCT in the emergency department setting in patients referred for traumatic thoracic injury or acute aortic dissection (20). The motion artifacts of the thoracic aorta and the supra-aortic vessels were significantly reduced in the ECG-gated data acquisition compared with the nongated technique, but image quality of the lung parenchyma, the spine, and the ribs was inferior in the ECG-gated data. This did not, however, compromise the detection rate of traumatic lesions and fractures, and overall examination time did not differ between the two groups (20). The authors of this text advocate ECG gating in patients with known dissections or aneurysms of the ascending aorta and in patients who are being evaluated for the postoperative ascending aorta. If the prevalence of acute aortic disease is less than 1% to 2% in the patients sent for MDCT of the thoracic aorta, the additional radiation dose is difficult to justify. However, a recently published study from Massachusetts General Hospital of ungated MDCT showed 18% of cases referred for acute aortic disease had positive findings (21). Under these circumstances of relatively high true positive cases, ECG gating should be considered essential. Similarly, patients referred for the “triple rule out” to exclude pulmonary embolic disease, acute aortic disease, and coronary artery occlusive disease also require ECG gating.
Magnetic Resonance
It cannot be overemphasized that optimal use of MR requires meticulous attention to technique. Considerable emphasis is placed on the many fine points of scan technique that must be mastered to ensure diagnostic accuracy. Once mastered, it should be apparent that MR represents an extraordinarily powerful tool for the evaluation of cardiovascular disease, especially in the nonacute setting.
The advantages of MR for evaluation of the aorta include (a) nonreliance on the use of iodinated contrast agents to image blood vessels, (b) the ability to image in multiple planes, (c) a lack of ionizing radiation, (d) the ability to evaluate valvular competency and to quantify flow and determine pressure gradients across stenotic regions, and (e) the long safety record of the use of gadolinium chelates as contrast agents (22). Limitations of MR compared with CT include (a) decreased spatial resolution; (b) restriction
in the numbers of patients eligible to be scanned owing to the presence of various life-support systems and monitoring devices, such as pacemakers or ventilators; and (c) cost and availability. Until recently, severe arrhythmias that precluded accurate ECG gating were a significant detriment to the widespread use of aortic MR; however, new pulse sequences can reliably image patients with cardiac arrhythmias in almost any situation (real time imaging). The relative insensitivity to calcification can be viewed as favorable when evaluating patients with severe calcification that would render CTA very difficult to postprocess. However, the inability to detect displaced intimal calcifications in aortic intramural hematoma (IMH) is a major limitation, as is the inability to detect a “porcelain aorta,” one so heavily calcified that it would preclude safe cross clamping for either proximal or distal control (Fig. 2-1).
in the numbers of patients eligible to be scanned owing to the presence of various life-support systems and monitoring devices, such as pacemakers or ventilators; and (c) cost and availability. Until recently, severe arrhythmias that precluded accurate ECG gating were a significant detriment to the widespread use of aortic MR; however, new pulse sequences can reliably image patients with cardiac arrhythmias in almost any situation (real time imaging). The relative insensitivity to calcification can be viewed as favorable when evaluating patients with severe calcification that would render CTA very difficult to postprocess. However, the inability to detect displaced intimal calcifications in aortic intramural hematoma (IMH) is a major limitation, as is the inability to detect a “porcelain aorta,” one so heavily calcified that it would preclude safe cross clamping for either proximal or distal control (Fig. 2-1).
Magnetic Resonance Techniques
Contemporary MR imaging of the thoracic aorta usually includes multiplanar ECG-triggered spin-echo (SE) “black blood” imaging supplemented with a “bright blood” MRA technique. Whereas SE MR imaging of the thoracic aorta is an effective diagnostic tool in evaluating a wide range of anatomic and pathologic conditions (23, 24, 25), images may be degraded by pulsatility and flow artifacts, and this technique cannot accurately evaluate aortic arch vessel disease. In addition, because acquisition times are determined by heart rate, patients with bradycardia have long acquisition times and patients with abnormal cardiac rhythms often have poor ECG triggering, resulting in suboptimal or even nondiagnostic examinations. Newer black blood techniques using a double inversion pulse can image the thoracic aorta in a single breath-hold with excellent image quality (26). Recently, real-time bright blood cine imaging has been implemented by the major vendors [balanced steady-state free precession (SSFP) imaging, True FISP (fast imaging with steady-state precession) and FIESTA (fast imaging employing steady-state acquisition)], providing excellent image quality of the aorta and great vessels without the need for ECG triggering or breath holding (Fig. 2-2) (27).
 Figure 2-1 Limitations of aortic MR; reduced sensitivity to the presence of calcium. A: Oblique sagittal maximum intensity projection image from breath-hold, gadolinium-enhanced three-dimensional MR angiogram (TR/TE/FA 3/1.6/50 degrees) performed with 20 mL of gadolinium in conjunction with a phased-array coil and a timing examination demonstrates severe atherosclerotic arch vessel disease, including occlusion of the left common carotid artery and severe stenosis at the origin of the innominate (large arrow) and subclavian (small arrow) arteries. B: Axial multidetector computed tomography (MDCT) shows a heavily calcified (porcelain) aorta that could not safely be clamped for direct aortic revascularization requiring a combination of stenting and extra-anatomic bypass. |
MR angiographic techniques used in evaluating the thoracic aorta and arch vessels include these cine techniques and gadolinium-enhanced three-dimensional (3D) MRA. These bright blood techniques can differentiate slow flow from thrombus, demonstrate branch vessel disease, and supply additional physiologic information that complements SE MR imaging. Perhaps most important, these images resemble conventional angiograms and therefore are easier for referring clinicians to interpret.
Before the advent of gadolinium-enhanced MRA, time of flight (TOF) techniques were widely used. However,
this approach requires ECG gating and breath holding to maximize flow-related enhancement, minimize saturation effects, and eliminate respiratory misregistration. When performed in the oblique sagittal [left anterior oblique (LAO) equivalent] plane, this technique may be limited by low spatial resolution, in-plane saturation effects, and TOF signal loss in areas of turbulent flow or stasis. Nevertheless, when combined with SE MR imaging, very high diagnostic accuracy rates have been achieved for a wide range of congenital and acquired thoracic aortic diseases (28).
this approach requires ECG gating and breath holding to maximize flow-related enhancement, minimize saturation effects, and eliminate respiratory misregistration. When performed in the oblique sagittal [left anterior oblique (LAO) equivalent] plane, this technique may be limited by low spatial resolution, in-plane saturation effects, and TOF signal loss in areas of turbulent flow or stasis. Nevertheless, when combined with SE MR imaging, very high diagnostic accuracy rates have been achieved for a wide range of congenital and acquired thoracic aortic diseases (28).
 Figure 2-2 Rapid diagnosis of Stanford type A aortic dissection without electrocardiographic (ECG) gating using a balanced steady-state free precession (SSFP) technique [True FISP (fast imaging with steady-state precession)] in a single breath-hold. Coronal (A) and sagittal (B) True FISP MR images show both true (T) and false (F) lumen in this Stanford type A aortic dissection. Note that the true lumen (T) is contiguous with the aortic outflow tract and the false (F) lumen on the right side of the ascending aorta demonstrates thrombus formation (arrow). |
Gadolinium-enhanced 3D MRA depends on infusion of paramagnetic contrast agents, which results in a decreased T1 relaxation of blood (29). Using this approach, anatomic images of blood vessels are generated and distinguished from background tissues based solely on T1 relaxation rates. This contrast mechanism minimizes saturation effects and allows for rapid in-plane imaging of large anatomic segments. The intravascular signal enhancement of gadolinium chelates allows the use of 3D Fourier-transform imaging with intrinsically high spatial resolution and high signal-to-noise ratio (30). This technique results in excellent aortic enhancement irrespective of the patient’s cardiac output or hemodynamic status.
Early studies using a slow infusion of 0.2 to 0.3 mmol/kg gadolinium during a 2- to 4-minute acquisition demonstrated high sensitivity and specificity for both congenital and acquired thoracic aortic disease (29, 31). However, images are often degraded by respiratory artifacts that result in considerable image blurring, especially of the arch vessels (Fig. 2-3) and the aortic root (31). In a small percentage of cases, image quality of non–breath-hold gadolinium-enhanced 3D MRA is so poor that the examination is entirely nondiagnostic. Significant enhancement of the brachiocephalic veins is almost always present and may result in obscuration of the aortic arch vessels on maximum intensity projection (MIP) images. In addition, because of the long acquisition times this technique provides no physiologic information regarding flow dynamics; this precludes the differentiation between true and false lumen in aortic dissection based on preferential enhancement. The advantage of the long acquisition time is the uniform, excellent aortic enhancement, which is virtually always achieved.
Optimization and Timing of Gadolinium-Enhanced Three-Dimensional Magnetic Resonance Angiography
With high-performance gradient systems now increasingly available, the TR and TE can be shortened such that an entire 3D acquisition can be obtained in a single breath-hold (32). It is well established that there is only a small temporal window between peak brachiocephalic arterial enhancement and jugular venous enhancement (33, 34). Rapid acquisition times may allow for a “pure” arterial study without confounding venous enhancement, and breath holding eliminates most of the artifacts seen with the longer, non–breath-hold strategies. Optimized thoracic aortic studies should demonstrate excellent arterial enhancement, minimal or no venous enhancement, and sufficient spatial resolution to resolve vessels as small as the vertebral arteries (Fig. 2-3). In addition, optimized timing, with phased array or multichannel coils suitable for parallel imaging, allows for a reduction in the dose of contrast used without compromising image quality or signal-to-noise (34) (Fig. 2-4).
However, with shorter acquisition times, new constraints regarding coordination of data acquisition with timing of the contrast injection have become apparent. Peak arterial enhancement should coincide with the acquisition of low spatial frequency lines of k-space for optimal contrast between the aortic lumen and background tissues. However, it may be difficult to predict a given patient’s circulation time. Earls et al. (35), using a 1-mL test bolus of gadolinium administered at 2 mL/second, demonstrated that the time to peak arterial enhancement (circulation time from injection site to peak aortic enhancement) can vary from 10 to 60 seconds. By using a timing examination in conjunction with a MR-compatible power injector, all patients had diagnostic quality thoracic aortograms with only 20 mL of gadolinium administered. Many centers use a timing examination because it can be performed with any MR machine (i.e., it is not a vendor-specific product) and requires no additional capital purchase. More importantly, it can test the integrity of the intravenous line prior to the administration of the entire bolus and can provide pertinent physiologic information concerning the vessels of interest (36) and overall cardiac function (37).
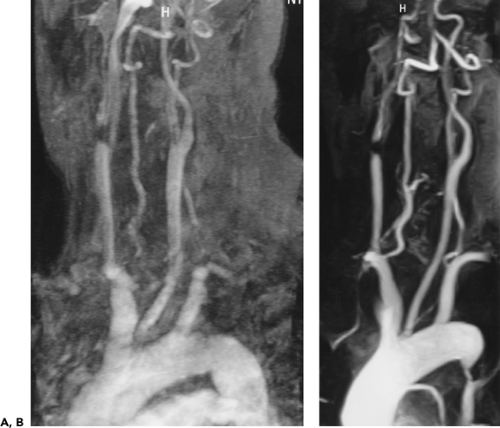 Figure 2-3 The effects of breath holding on image quality of gadolinium-enhanced three-dimensional (3D) MR angiography of the aortic arch vessels. A: Oblique sagittal maximum intensity projection (MIP) image from non–breath-hold gadolinium-enhanced 3D MR angiogram (TR/TE/FA 21/6/30 degrees) performed in the body coil, during slow infusion of 40 mL of contrast over the first 90 seconds of a 2-minute acquisition, demonstrates blurring and ghosting artifacts, resulting in poor image quality and a nondiagnostic examination. B: Oblique sagittal MIP image from breath-hold, gadolinium-enhanced 3D MR angiogram (TR/TE/FA 5/2/50 degrees) performed with 20 mL of gadolinium in conjunction with a phased-array coil and a timing examination demonstrates vastly improved image quality and normal aortic arch vessels. |
Other, more sophisticated methods of optimizing first pass contrast-enhanced MRA have been recently described. A novel technique developed at the Mayo Clinic uses fluoroscopic or real time triggering (38). Following the bolus injection of contrast, multiple two-dimensional (2D) gradient-recalled echo (GRE) images are acquired with a temporal resolution of approximately 1 frame per second. When the leading edge of the contrast bolus is
visually detected, breath-holding instructions are given and the 3D acquisition is performed. Another approach developed by Foo et al. (39) uses an automated sequence that detects the arrival of gadolinium with subsequent triggering of the 3D acquisition. The latter technique uses an SE sequence with a large voxel placed over the vessel of interest. The arrival of the gadolinium bolus is detected and triggers a 3D GRE sequence with centric phase-encoding. Therefore, the important low spatial frequency lines of k-space (which determine image contrast) are acquired at the beginning of the acquisition, coinciding with peak arterial enhancement.
visually detected, breath-holding instructions are given and the 3D acquisition is performed. Another approach developed by Foo et al. (39) uses an automated sequence that detects the arrival of gadolinium with subsequent triggering of the 3D acquisition. The latter technique uses an SE sequence with a large voxel placed over the vessel of interest. The arrival of the gadolinium bolus is detected and triggers a 3D GRE sequence with centric phase-encoding. Therefore, the important low spatial frequency lines of k-space (which determine image contrast) are acquired at the beginning of the acquisition, coinciding with peak arterial enhancement.
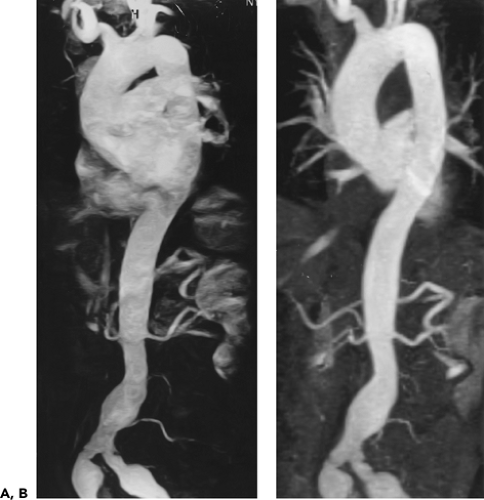 Figure 2-4 Total body aortography: comparison of maximum intensity projection images from non–breath-hold, gadolinium-enhanced three-dimensional (3D) MR angiography with standard gradient strength (TR/TE/ Flip angle = 21/6/30 degrees) obtained during slow infusion of 30 mL of gadolinium (A) with breath-hold gadolinium-enhanced 3D MR angiography with high-performance gradient strength (TR/TE/Flip angle = 5/2/30–50 degrees) and bolus administration of 15 mL of gadolinium with a timing examination (B). The latter demonstrates less confounding venous enhancement and no central pulmonary arterial enhancement, both of which degrade (A). |
Alternatively, a time-resolved approach can be used, which eliminates the need for these techniques by acquiring an entire 3D dataset with sufficient temporal resolution (every 2 to 5 seconds) (40, 41, 42) and excellent spatial resolution. This ensures that at least one frame of the dataset will demonstrate a selective arterial study of the vessel of interest. Even greater temporal resolution can be achieved with a time-resolved 2D technique (43) but at the expense of decreased spatial resolution. With stronger gradient systems, and parallel imaging techniques coupled with novel pulse sequences that allow sharing of certain lines of k-space (TRICKS or TREAT), time-resolved MR imaging will become the standard way to optimize contrast-enhanced MRA.
Technical Aspects of Gadolinium-Enhanced Three-Dimensional Magnetic Resonance Angiography
Coil Selection
Gadolinium-enhanced 3D MRA examinations are usually performed on a 1.5 or 3 T system with a high performance gradient system that allows a TR of less than 4 ms and a TE of less than 1.5 ms. A 4-, 8-, or 16-channel multiarray torso coil is preferable, as it provides an advantage over the body coil by virtue of increased signal-to-noise and provides for higher spatial resolution or faster imaging using parallel imaging techniques. This benefit, however, is proportional to the patient’s body habitus; the increase in signal-to-noise is substantial in thin patients but may be less in obese patients. There are distinct disadvantages in using the multiarray coil that do not apply to the body coil. The FOV is limited in the craniocaudad dimension, which may result in the need for a second angiogram to evaluate the infrarenal aorta in patients with aortic dissection and diffuse aneurysmal disease. However, recent technology allows for coil coupling to image as many anatomic segments as one desires during the same breath-hold. For example, a 16-channel neurovascular coil can be linked to a multichannel torso
coil, allowing imaging of the thoracic aorta to the circle of Willis with a single injection. The bright signal of the subcutaneous fat may also obscure vessels of interest on MIP images, especially if a strong rectangular FOV is used. However, use of subtraction algorithms can minimize this problem if there is good coregistration between the precontrast and gadolinium-enhanced acquisitions. In addition, portions of the aorta closest to the coil often have more signal than segments deeper in the chest, making the MIP images difficult to window appropriately (Fig. 2-5). This can also be minimized with the use of a postprocessing filter function. Finally, in some patients (especially children), the weight of the anterior component of the coil is uncomfortable and may potentiate claustrophobia. For these reasons, some centers still use the body coil when evaluating the thoracoabdominal aorta (Fig. 2-4). However, the body coil is clearly suboptimal when evaluating small vessels, such as the vertebral arteries, because the small FOV needed to resolve these vessels (25 cm) results in poor signal-to-noise. This is compounded by the fact that the very short echo time intrinsic to these 3D sequences (1 to 2 ms) necessitates the use of high bandwidths. This in turn also results in a signal-to-noise penalty.
coil, allowing imaging of the thoracic aorta to the circle of Willis with a single injection. The bright signal of the subcutaneous fat may also obscure vessels of interest on MIP images, especially if a strong rectangular FOV is used. However, use of subtraction algorithms can minimize this problem if there is good coregistration between the precontrast and gadolinium-enhanced acquisitions. In addition, portions of the aorta closest to the coil often have more signal than segments deeper in the chest, making the MIP images difficult to window appropriately (Fig. 2-5). This can also be minimized with the use of a postprocessing filter function. Finally, in some patients (especially children), the weight of the anterior component of the coil is uncomfortable and may potentiate claustrophobia. For these reasons, some centers still use the body coil when evaluating the thoracoabdominal aorta (Fig. 2-4). However, the body coil is clearly suboptimal when evaluating small vessels, such as the vertebral arteries, because the small FOV needed to resolve these vessels (25 cm) results in poor signal-to-noise. This is compounded by the fact that the very short echo time intrinsic to these 3D sequences (1 to 2 ms) necessitates the use of high bandwidths. This in turn also results in a signal-to-noise penalty.
When studying infants or neonates, the head or knee coil can be used, and spine coils may be used for young children and adolescents with thin body habitus. Larger children and adolescents can be studied in either the multiarray coil or the body coil.
Patient Positioning
Regardless of the coil selected, the patient’s arms are positioned at the sides, and the right antecubital fossa is catheterized so that contrast draining the injection site is not present in the left brachiocephalic vein (which could obscure arch vessels on MIP images). Another pertinent reason not to inject from the left side is that some patients with thin body habitus may have physiologic compression of the left innominate vein against the sternum, resulting in restriction of flow past the lesion with filling via collateral vessels (44). In a study by Lee et al. (44) 9.1% of 475 carotid MRA studies were poorly enhanced because of left arm injections. Compression of the left brachiocephalic vein between the sternum and aorta was confirmed in four cases by venography, CT, and MRI.
Although some authors advocate placing the patients’ arms over their heads (to minimize aliasing artifacts), this should not be performed for arch studies, as this position may cause compression of the subclavian artery and vein against the first rib. This compression can be significant in normal patients (without pathologic thoracic outlet syndrome) and can lead to a false-positive diagnosis of occlusive disease in the subclavian arteries as well as susceptibility artifacts from concentrated gadolinium in the axillary vein draining the injection site (Fig. 2-6). For this reason, when specifically evaluating the subclavian, axillary, or brachial arteries, the injection should be administered in the side contralateral to the expected pathology so that concentrated gadolinium in the draining vein will not result in artifactual signal loss from susceptibility artifacts. In addition, the use of a large-volume saline flush (20 mL) will help minimize these artifacts. If bilateral disease is anticipated, there are two options: (a) place the intravenous site in a lower extremity or (b) dilute the gadolinium to a 33% solution of normal saline, increase the flow rate to 3 to 4 mL/second, and use the shortest possible echo time the scanner will allow (45). One important point in differentiating real from artifactual stenosis is the absence of collateral vessels seen in pseudolesions.
 Figure 2-5 Oblique sagittal maximum intensity projection image from breath-hold gadolinium-enhanced three-dimensional MR angiogram demonstrates two pseudoaneurysms arising from the ascending aorta. These appear to have higher signal than the descending aorta because of their proximity to the anterior elements of the phased-array coil. |
Scan Parameters
Given the wide range of variables currently available for performing MRA, we recommend a 3D GRE sequence using the following parameters: [2–4/1–2/30–50 (TR/TE/flip angle)], matrix of 256 × 512 with frequency encoding superiorly to inferiorly, a 4/8 to 7/8 rectangular FOV with a maximum dimension of 25 to 45 cm (dedicated arch vessel studies require a smaller FOV than thoracic aorta examinations). A coronal or oblique sagittal/left anterior oblique equivalent slab is used (thickness 9 to 12 cm), 60 to 100 partitions,
effective interpolated section thickness of 1 to 2 mm, 1 acquisition (acquisition time of 5 to 20 seconds). Saturation pulses and gradient moment nulling are not used. Partial Fourier and parallel imaging can be used to decrease acquisition time, as can TRICKS or TREAT.
effective interpolated section thickness of 1 to 2 mm, 1 acquisition (acquisition time of 5 to 20 seconds). Saturation pulses and gradient moment nulling are not used. Partial Fourier and parallel imaging can be used to decrease acquisition time, as can TRICKS or TREAT.
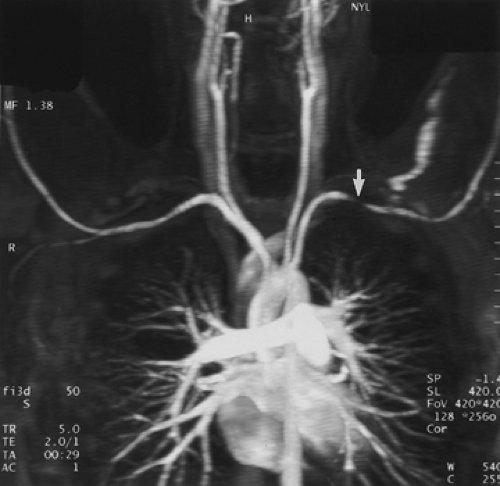 Figure 2-6 Artifactual stenosis of the subclavian artery, caused by T2 shortening effects from concentrated gadolinium, secondary to transient venous obstruction from abducted arms (arms over the head position). Coronal maximum intensity projection image from breath-hold gadolinium-enhanced three-dimensional MR angiogram demonstrates artifactual stenosis of the left subclavian artery (arrow). This results from compression of the axillary vein draining the injection site because of abduction of the arms. A second acquisition, after an additional saline flush, failed to demonstrate an abnormality. Of note is that some patients, those without thoracic outlet compression, can occlude their subclavian vessels with arm abduction. (From reference 34, with permission.) |
It is important to position the slab from axial images at multiple levels to avoid excluding portions of extremely ectatic aortas. An unenhanced acquisition is initially performed to ensure that the vessels of interest are included in the imaging volume, to optimize the rectangular FOV that can be used without aliasing artifacts, to determine the patient’s ability to suspend respiration, and for use as a mask for subsequent image subtraction. This subtraction technique is helpful in eliminating the bright, subcutaneous fat, which may degrade the quality of MIP images (46).
Timing Examination
To precisely match peak arterial enhancement to the acquisition of the central lines of k-space, a timing examination can be performed to measure circulation time to the region of interest (antecubital vein to aortic arch). This technique employs a 1-mL bolus of Gd-DTPA followed by 20 mL of saline, both infused at 2 to 3 mL/second while 1-cm axial magnetization-prepared GRE images (TR/TE/FA/inversion time = 11 ms/4.2 ms/15 degrees/300 ms/), one every 2 seconds for 60 seconds, are obtained (46). If a dark blood GRE pulse sequence is not available, one can use an ordinary GRE pulse sequence performed in the sagittal plane. Under these circumstances, because of in-plane saturation effects, a test bolus of gadolinium will result in transient aortic enhancement significantly greater than the precontrast image.
The time to peak arterial enhancement is determined by selecting the slice with the greatest qualitative enhancement. This is less cumbersome than drawing region-of-interest cursors over the desired vessel.
Using the circulation time, an imaging delay between the start of the infusion of contrast and the start of the 3D acquisition is calculated with the following equation (32):
Imaging delay = circulation time – (infusion time/2) – (imaging time/2)
This delay time is optimized for sequential phase-encoding pulse sequences, whereby the important low spatial frequency lines that determine image contrast (center of k-space) are sampled in the center of the sequence acquisition. When using centric or elliptical centric phase-encoding MRA pulse sequences, these important lines are acquired at the beginning of the acquisition, and the formula may need to be adjusted by adding an extra imaging delay of 2 to 4 seconds.
Once the imaging delay time is calculated, the identical 3D gradient-echo sequence is repeated with injection of 20 to 30 mL of gadolinium at 2 to 3 mL/second with an MR-compatible power injector followed by a 20-mL saline flush; an inadequate flush may result in artifactual signal loss from concentrated gadolinium, as previously described (Fig. 2-6). The examination is performed at end-inspiration, as most patients find this more comfortable than breath holding at end-expiration, although the latter usually provides for better subtraction imaging with less misregistration. A second acquisition is performed either immediately after the first or after a 10- to 15-second respite during which patients can catch their breath. The purpose of this second acquisition is to better opacify the false lumen in patients with communicating dissection and as a “bail-out” if the first acquisition is suboptimal from acquiring data too early.
Following gadolinium-enhanced 3D MRA breath-hold T1-weighted 3D axial gradient-echo images can be acquired through the chest to evaluate for extraluminal disease and as a general anatomic survey (47). These images are easy to interpret, as they are very similar in appearance to contrast-enhanced CT and can readily detect pulmonary nodules as small as 1 cm as well as mediastinal lymphadenopathy (48). In active vasculitis and arteritis, these delayed 3D axial MR images provide the best contrast to demonstrate mural enhancement, often seen in early disease prior to the development of stenotic lesions.
Black Blood Imaging
Prior to gadolinium-enhanced MRA, axial and either oblique sagittal or coronal ECG-triggered black blood T1-weighted SE images were acquired through the chest. This technique provides excellent anatomic images and is extremely useful to evaluate for mural pathology, such as IMH and the presence of pleural or pericardial effusions. Although it is not always possible to achieve high-quality black blood luminal images because of poor ECG triggering or flow artifacts, the use of longer echo times (<15 ms) and specialized dephasing gradients may be helpful. Some authors believe that aortic diameter is more reproducibly measured using black blood techniques, because of the excellent contrast between the aortic wall and the adjacent lung, unless the aorta is extremely tortuous. In this situation, true short axis aortic measurements can be achieved with reformatted images from the gadolinium-enhanced 3D dataset. Although many centers still routinely perform ECG-triggered T1-weighted SE MR for black blood imaging, some institutions have replaced this time consuming technique with dark blood half-Fourier single shot turbo spin-echo (HASTE) imaging (26, 49). This technique is insensitive to patient motion, can provide excellent image quality even with poor ECG gating, does not require breath holding, and takes less than 1 minute to acquire 20 images. Dark blood images are obtained by using two separate inversion pulses (double IR) so the signal from incoming blood is nulled. Because of the limited signal-to-noise inherent in single shot imaging, a phased-array coil must be used. Contrast is also different with this technique and reflects the echo time of the pulse sequence used.
Alternatively, an ECG-triggered double-inversion, single-slice breath-hold technique can be used for higher spatial resolution techniques, such as detailed evaluation of thoracic aortic atheromas (50). By applying an additional inversion pulse, a triple IR pulse sequence can be obtained with fat suppression. It is important to point out that this fat suppression technique is based on inversion time and is not specific for fat. For example, a bronchogenic cyst with the same T1 of fat will also lose signal on a triple IR pulse sequence.
ECG-triggered turbo SE T2-weighted or turbo short T1 inversion recovery (STIR) images have a limited role in the evaluation of aortic disease with the exception of patients suspected of having graft infections or aortitis. In the latter clinical setting, high signal intensity within the aortic wall may correlate with disease activity.
Contrast-enhanced MRA provides excellent anatomic images but cannot quantify flow or pressure gradients. Under these circumstances, cine phase-contrast MR with velocity encoding can supply additional information, including measurement of pressure gradients across stenotic valves and areas of aortic narrowing (coarctation) (51, 52). These sequences can also be used to differentiate the true from false lumen in aortic dissection and to determine if flow in the false lumen is antegrade or retrograde.
Techniques of Reconstruction
CTA (and MRA) can be performed using either multiplanar reformations (MPRs) or 3D renderings (Fig. 2-7) (53, 54, 55, 56, 57, 58, 59, 60, 61, 62, 63, 64).
Multiplanar Reformations
MPRs are one-voxel-thick 2D “tomographic” sections interpolated along an arbitrary plane or curved surface. These have the considerable advantage of computational efficiency, requiring only a few seconds to reconstruct, as well as the advantage of instantaneous window width and level manipulation. Offsetting any potential decrease in spatial resolution caused by partial volume averaging, it is possible to interactively obtain a series of single oblique reconstructions derived from corresponding transverse images, allowing individual vessels to be displayed to best advantage along their nearest long axes. Unfortunately, MPRs may be susceptible to stair-step artifacts, limiting their interpretation. This effect may be overcome to some degree by decreasing the reconstruction interval.
Three-Dimensional Rendering
Under this heading are included a number of different techniques, all of which have in common the use of an entire volume (or preselected subvolume) of scan data to generate 2D images that convey 3D spatial information. Three broad categories may be identified: multiplanar volume reconstructions (MPVRs), including MIPs; shaded surface displays (SSDs); and volumetric rendering. Of these, the latter two may be adapted to allow both external and internal rendering of vessels.
Multiplanar Volume Reconstructions
MPVRs are a variant of MPRs that allow a user to obtain 2D representations from a 3D volume (or slab) at any angle using average, ray sum, MIP, or even minimum intensity projections (MINIPs). Familiar as a common method for visualizing both MRA and CTA data, MPVRs may be obtained in any direction, including the axial plane, thereby simulating true cross-sectional images (57). Of these, the most commonly used for imaging vessels are MIPs (58). MIPs are derived by projecting onto an imaging plane the brightest voxel encountered in a ray through the scan volume. The result is a 2D image in which blood vessels are typically highlighted (Fig. 2-7A). Alternatively, voxel values along individual rays may be either averaged or summed; averaged images mimic the appearance of routine MPRs, whereas summed vessels appear translucent. MIPs encode variations in voxel attenuation or intensity, allowing differentiation between calcium and thrombus; they are not threshold dependent. As a result,
they also may be of value by depicting differences in flow rates, as, for example, occurs in aortic dissection or even within single vessels as a result of antegrade flow. However, unlike other volume rendering techniques, those derived using MPVRs have no depth cues. As a consequence, MIPs are best suited for displaying anatomy in which superimposition of structures is minimized. This limitation may be overcome in part by multiple projections viewed in a cine mode as well as volume editing, restricting MIPs to only a few transaxial images—so-called thin slab MIPs—to remove unwanted overlying structures. Nonetheless, MIP images, as all other MPVRs, are best interpreted in conjunction with the original axial source images (58). The MIP algorithm is usually most effective when the objects of interest are bright and there is little gradation in the image. High signal intensity from sources other than vessels can interfere with visualization; however, this can be mitigated on MR imaging by using image subtraction. MIPs are simple and quick to perform, but they retain only approximately 10% of the data from the original image.
they also may be of value by depicting differences in flow rates, as, for example, occurs in aortic dissection or even within single vessels as a result of antegrade flow. However, unlike other volume rendering techniques, those derived using MPVRs have no depth cues. As a consequence, MIPs are best suited for displaying anatomy in which superimposition of structures is minimized. This limitation may be overcome in part by multiple projections viewed in a cine mode as well as volume editing, restricting MIPs to only a few transaxial images—so-called thin slab MIPs—to remove unwanted overlying structures. Nonetheless, MIP images, as all other MPVRs, are best interpreted in conjunction with the original axial source images (58). The MIP algorithm is usually most effective when the objects of interest are bright and there is little gradation in the image. High signal intensity from sources other than vessels can interfere with visualization; however, this can be mitigated on MR imaging by using image subtraction. MIPs are simple and quick to perform, but they retain only approximately 10% of the data from the original image.
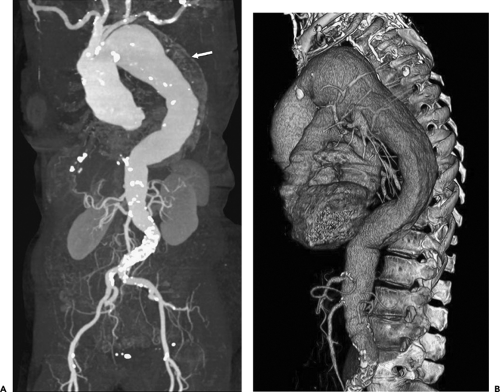 Figure 2-7 Diffuse thoracic aneurysm: reconstruction options. See Color Figure 2-7B. A: Maximum intensity projection image depicts full extent of the aneurysm’s enhanced lumen but fails to show the low-attenuation thrombus (arrow) as well as osseous structures. B: Volumetric rendered image retains the full range of tissue densities represented within the volume scanned, allowing a greater range of three-dimensional images, resulting in improved anatomic orientation. (Courtesy of Dominik Fleischmann, Stanford University, Stanford, California.) |
Shaded Surface Displays and Volumetric Rendering
Included in this category are external and internal image renderings. External rendering allows visualization of structures from an external vantage point using a simulated external light source. This can be accomplished using either surface thresholding or volume rendering techniques. In the former, a single threshold is selected and used to generate surfaces at the boundaries of structures, effectively discarding all other data within the scan volume. The result is often exquisite depictions of the relationships between anatomic structures, including vascular branches. Unfortunately, despite the striking visual
appearance of these images, external rendering techniques may require time-consuming editing to create appropriate subvolumes for analysis using either manual trace or connectivity-based editing techniques. In addition, the use of a single threshold makes shaded surface techniques susceptible both to noise and to artifacts related to partial volume averaging; this can result in surface discontinuities or holes, jagged edges, and floating pixels. More important, focal areas of high density, in particular, vascular calcifications and metallic stents, may be completely obscured. It cannot be overemphasized that surface rendering techniques reflect voxel boundaries, not true tissue interfaces.
appearance of these images, external rendering techniques may require time-consuming editing to create appropriate subvolumes for analysis using either manual trace or connectivity-based editing techniques. In addition, the use of a single threshold makes shaded surface techniques susceptible both to noise and to artifacts related to partial volume averaging; this can result in surface discontinuities or holes, jagged edges, and floating pixels. More important, focal areas of high density, in particular, vascular calcifications and metallic stents, may be completely obscured. It cannot be overemphasized that surface rendering techniques reflect voxel boundaries, not true tissue interfaces.
In distinction to SSDs, volume rendering uses linear or continuous scaling techniques in which every voxel within the original dataset is assigned a proportional value based on the full range of tissue densities represented (59). By use of a transfer function, Hounsfield numbers may then be mapped to brightness, color, and opacity (60). This approach results in fewer artifacts and allows a greater range of possible 3D images (including the ability to create transparent tissue planes, allowing anatomic structures to be viewed at various depths, as well as stereoscopic imaging). Most important, volumetric rendering allows depiction of vascular calcifications and thrombus and provides improved visualization of small vessel anatomy (Fig. 2-7B). Although previously limited by the need for extensive, time-consuming image processing, 3D CT now can be performed using real-time interactive volume rendering (60, 61).
Similar to external rendering, internal renderings can be performed using either volumetric rendering or 3D surface shaded reconstructions to simulate the endoluminal appearance of vessels—so-called virtual angioscopy (62). Internal rendering allows visualization of the internal structures of organs from a point source at a finite distance, simulating human perspective ostensibly as seen through an endoscope. Images are viewed through the tip of a cone with either a narrow (15 degree) or wide (60 degree) FOV (63). A flight path of sequential images can also be constructed and navigated either sequentially or in a cine loop, further simulating endoscopy.
Although 3D shaded-surface reconstructions are relatively fast, they are limited by their greater susceptibility to noise and partial volume averaging. Volumetric rendering has the advantage of allowing perivascular tissues to be seen through vessel walls, allowing more precise anatomic localization, although shaded surface reconstructions also allow precise localization of perivascular structures by means of simultaneous annotated displays of corresponding axial, coronal, and sagittal images oriented to conform to any given plane identified from the endoluminal display (62, 63).
With respect to clinical studies comparing MDCT rendering techniques for thoracic vascular imaging, Lee et al. (56) compared the accuracies of axial, multiplanar, and 3D volume-rendered images in the diagnosis of thoracic aortic anomalies in 14 pediatric patients and young adults. All images were reviewed by three radiologists for position of the aortic arch, coarctation, vascular compression of the airway, collateral vessel formation, and aortopulmonary shunts (patent ductus arteriosus). Average accuracies were greater than or equal to 96% for diagnoses of aortic position and airway narrowing on all image types. For the diagnosis of coarctation, average was 73% for axial, 100% for multiplanar, and 100% for 3D volume-rendered images. For the diagnosis of patent ductus arteriosus, average sensitivities were 78% for axial, 94% for multiplanar, and 89% for 3D volume-rendered images. They concluded that axial, multiplanar, and 3D volume-rendered images serve equally well as methods for assessing the side of the aorta to diagnose anomalies. For evaluation of coarctation and patent ductus arteriosus, multiplanar and 3D volume-rendered images perform slightly better than axial images.
Magnetic Resonance Image Analysis
Similar to CT, multiple display options and postprocessing techniques can be used to evaluate the gadolinium-enhanced acquisition and, ultimately, to present the imaging information to the referring clinician in a user friendly fashion. To maximize diagnostic accuracy and minimize interpretation error, the source data, MPR, and MIP images should be evaluated on an interactive console. Because the MIP algorithm includes only the voxels with the greatest signal intensity within a given ray tracing, structures of lower signal intensity, such as thrombus or intimal flap, may be excluded. Therefore, evaluation of the source data with pertinent reformations is mandatory for diagnosis of branch vessel involvement in aortic dissection and for detection and accurate measurement of aneurysmal disease. Furthermore, MIP images interpreted in isolation may be unreliable in estimating vessel caliber and can overestimate the degree of stenosis in a given vessel. In addition, diminutive vessels may not be readily identified on MIP images but are easily seen on source data (Fig. 2-8). When overlapping vessels (usually veins) obscure the artery of interest, a restricted or subvolume MIP can often eliminate the obscuring vessel. Multiplanar reformations are invaluable in demonstrating abnormalities of small vessels, such as vertebral artery ostial lesions, and in detecting aortic arch atheromas. Other postprocessing capabilities include SSD algorithms, volume rendering, and virtual endoscopic renderings (63, 64). However, it is unclear whether these time-consuming techniques provide any incremental diagnostic yield when compared with evaluation with just the MIP and MPR images (65). For evaluating the renal arteries, Mallouhi et al. (54) demonstrated that the volume-rendered renal MRA enabled more accurate detection and quantification of renal artery stenosis than did MIP, with significantly improved vascular delineation. In a similar study with 28 patients referred for renal
MRA, volume-rendered and MPR images were both better than MIP images for evaluating stenosis when compared with digital subtraction angiography (55).
MRA, volume-rendered and MPR images were both better than MIP images for evaluating stenosis when compared with digital subtraction angiography (55).
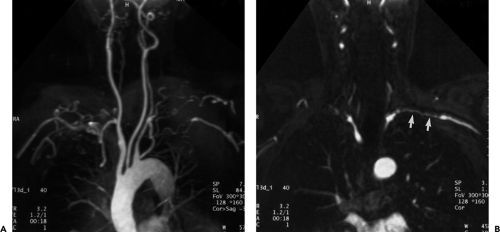 Figure 2-8 Artifactual occlusion on maximum intensity projection (MIP) image—a pitfall in rendering a diagnosis based only on MIP image without evaluation of source data. A: Coronal MIP image from breath-hold gadolinium-enhanced three-dimensional MR angiogram in a patient with giant cell arteritis demonstrates apparent chronic, bilateral subclavian artery occlusions with extensive collateral vessels in the shoulder region. Note the direct origin of the left vertebral artery from the aortic arch. B: Source image from same acquisition shows a patent but severely stenotic left subclavian artery (arrows). (From reference 34, with permission.) |
Normal Anatomy
Regional anatomy of the mediastinal great vessels and their relationships to each other and other mediastinal structures are discussed in Chapter 4. In this section, the appearances of specific vascular structures are reviewed.
The Aorta and Its Branches
The appearance of the aorta is characteristic, although it can vary somewhat in size and shape in different individuals (66). The thoracic aorta is usually considered to consist of an ascending segment, a transverse segment or arch, and a descending segment (Fig. 2-9).
The proximal portion of the ascending aorta is termed the aortic root; it consists of the aortic valve, annulus, and the sinuses of Valsalva. The right and left coronary arteries arise from the right and left sinuses of Valsalva; the posterior sinus is unassociated with a coronary artery and is referred to as the noncoronary sinus. The aortic root is surrounded by cardiac structures, with the right atrium to its right, the right ventricle and pulmonary outflow tract anterior to it, and the left atrium posterior. The aortic valve and sinuses of Valsalva are often seen on contrast-enhanced CT scans and always seen on ECG-gated examinations. Above the aortic root, the ascending aorta continues for a distance of 4 to 5 cm. This segment of the aorta is well demonstrated on CT.
The aortic arch begins at the innominate artery and consists of two segments. The proximal part of the arch is the longest and gives rise to the innominate, left carotid, and left subclavian arteries, although variations in the branching pattern of these vessels and their divisions are
common. The distal part of the arch, between the origin of the left subclavian artery and the ligamentum arteriosum, is known as the aortic isthmus; it is relatively short, measuring 1 to 2 cm in length, and its lumen may be a few millimeters narrower in adults than the aorta immediately distal to the ligamentum. Slight narrowing of the isthmus is most common in young children.
common. The distal part of the arch, between the origin of the left subclavian artery and the ligamentum arteriosum, is known as the aortic isthmus; it is relatively short, measuring 1 to 2 cm in length, and its lumen may be a few millimeters narrower in adults than the aorta immediately distal to the ligamentum. Slight narrowing of the isthmus is most common in young children.
 Figure 2-9 Anatomy of the thoracic aorta and significant landmarks. The ascending aorta extends from the aortic valve to the origin of the innominate artery. Its proximal portion, in relation to the aortic valve and sinuses of Valsalva, is termed the aortic root. The aortic arch begins at the innominate artery and ends at the ligamentum arteriosum. Its most distal part, which is often slightly narrowed, is termed the aortic isthmus. The descending aorta begins at the ligamentum. Its proximal portion may appear slightly dilated and has been termed the aortic “spindle.” |
Distal to the ligamentum arteriosum is the descending thoracic aorta. The most proximal portion of the descending aorta may appear slightly dilated, a finding that is more common in children than adults. This dilated segment of the proximal descending aorta has been termed the “aortic spindle” because of its fusiform shape (Fig. 2-9) (67); a more focal dilatation of the anterior aorta at this level may be caused by a “ductus diverticulum.” The largest branches of the descending aorta are the intercostal and bronchial arteries.
Usually, narrowing of the aortic lumen in the region of the aortic isthmus is not visible on transverse images; however, this finding may be seen on oblique sagittal CT reformations or MR imaging. It is important to keep in mind that the aortic arch also varies in appearance, depending on its curvature and orientation relative to the scan plane. Scans traversing different parts of the arch along its length can result in a false representation of aortic arch diameter. When scans are centered through the lower portion of the arch, it may appear constricted in its mid or posterior portions. Also, although the diameter of the aortic arch decreases gradually from anterior to posterior, the arch may appear elliptical on scans through the top of the arch.
Normal Aortic Diameter
The thoracic aorta tapers progressively from its origin and consequently varies in diameter at different levels, with the ascending aorta and anterior arch being about 1 cm larger than the posterior arch and descending aorta; in unusual cases, the descending aorta appears larger than the ascending aorta.
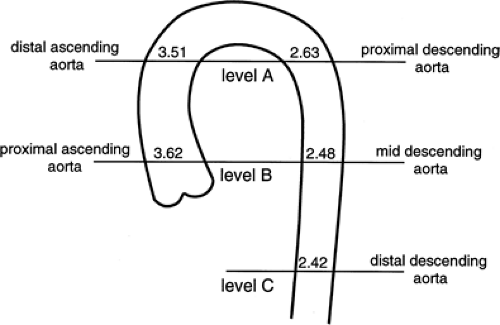 Figure 2-10 Mean values for aortic diameter measured using CT in 100 normal subjects of varying age. At each level, the range of values seen in normal persons was approximately 1 cm more or less than the mean. (From Aronberg DJ, Glazer HS, Madsen K, Sagel SS. Normal thoracic aortic diameters by computed tomography. J Comput Assist Tomogr. 1984;8:247–250 , with permission.) |
The ascending and descending portions of the aorta appear rounded, and in these locations, the diameter of the aorta can be accurately determined. As measured in more than 100 normal subjects (68) the average diameter of the proximal ascending aorta is 3.6 cm (range 2.4 to 4.7 cm), the ascending aorta just below the arch is 3.51 cm (range 2.2 to 4.6 cm), the proximal descending aorta is 2.63 cm (range 1.6 to 3.7 cm), the middle descending aorta is 2.48 cm (range 1.6 to 3.7 cm), and the distal descending aorta is 2.42 cm (range 1.4 to 3.3 cm) (Fig. 2-10). Aortic diameters have also been shown to increase with age, correlate with vertebral size, and be larger in men then women (Table 2-1).
It is important to recognize that the aorta can vary considerably in its diameter in different patients, as indicated by the ranges of values listed previously. However, in an individual patient, the aorta should taper in a consistent fashion along its length. Any significant deviation from this should arouse suspicion of an aneurysm.
In children, the aortic diameters at these same levels have been shown to correlate closely with age and increase in a linear fashion with growth (Fig. 2-11) (69). In every case, the diameter of the ascending aorta was greater than that of the descending aorta at the same level.
The wall of the aorta measures several millimeters in thickness in normal subjects but increases with age. On unopacified CT scans, the aortic wall usually appears with the same attenuation as blood in the aortic lumen and cannot be distinguished from it. However, in some anemic patients, the wall may appear slightly denser than aortic blood on unopacified scans; focal or concentric increased density of the aortic wall associated with thickening can also be seen in patients with IMH (70) and arteritis (71). In the presence of atherosclerosis and aortic plaques, focal areas of wall thickening may appear lower in attenuation than adjacent aortic wall and aortic blood because of their lipid content (72); these plaques are often irregular in attenuation. On contrast-opacified scans, the aortic wall may sometimes be seen as lower in attenuation than blood in the aortic lumen.
Table 2-1 Average Aorta Diameter at Different Levels, by Age and Sex | ||||||||||||||||||||||||||||||||||||||||||||||||||||||||
|---|---|---|---|---|---|---|---|---|---|---|---|---|---|---|---|---|---|---|---|---|---|---|---|---|---|---|---|---|---|---|---|---|---|---|---|---|---|---|---|---|---|---|---|---|---|---|---|---|---|---|---|---|---|---|---|---|
| ||||||||||||||||||||||||||||||||||||||||||||||||||||||||
Aortic Branching
The three great arterial branches of the aorta arise sequentially and are often seen at different levels. The innominate artery arises as the first branch of the arch and is usually seen more caudally than the other branches. It is located near the midline of the trachea or slightly to the right of midline in most normal patients and is in close proximity to the anterior tracheal wall (Fig. 2-12). The innominate artery is usually the largest aortic branch, as it gives rise to the right subclavian, common carotid, and vertebral arteries. The left common carotid artery arises next and at a more cephalad level. It lies to the left and slightly posterolateral to the innominate artery; generally it has the smallest diameter of the three major arterial branches. The left subclavian artery is the last arch branch and arises from the posterosuperior portion of the aortic arch; it is usually visible at the most cephalad aspect of the arch seen on CT. The left subclavian artery is a relatively posterior structure throughout most of its course, lying to the left of and frequently directly lateral to the trachea. The lateral border of the left subclavian artery typically indents the mediastinal surface of the left upper lobe. At the level of origin of the left subclavian artery, the posterior portion of the arch should not be confused with a mediastinal mass.
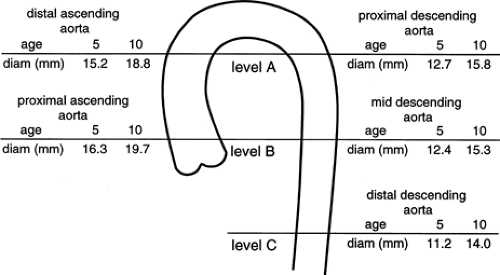 Figure 2-11 Approximate mean values for aortic diameter in children aged 5 and 10 years. Ninety-five percent confidence limits include values approximately 3 mm above and below the values shown. (From Fitzgerald AW, Donaldson JS, Poznanski AK. Pediatric thoracic aorta: normal measurements determined with CT. Radiology. 1987;165:667–669 , with permission.) |
Although this pattern of branching is typical, variations are common (73, 74). A “normal” branching pattern was found in only 74% of 300 arteriograms reviewed by Sutton and Rhys Davies and in 56% to 70% of autopsy cases (Fig. 2-12) (73, 74). The most common variation is a combined origin of the innominate and left common carotid arteries (Figs. 2-12 and 2-13), which is seen in about 20% of patients at arteriography and in 22% to 36% of cases at autopsy. In about 4% to 6% of cases, the left vertebral artery arises as a separate branch of the aorta, between the left common carotid and subclavian branches, instead of arising from the left subclavian artery itself (Figs. 2-8, 2-12, and 2-14).
Above the level of the innominate artery bifurcation, the right subclavian and right common carotid arteries can be identified as separate structures and, although usually located somewhat more anteriorly, may appear quite similar to the left subclavian and common carotid arteries in size and location. The exact position of the bifurcation of the brachiocephalic artery is variable, depending on the length
and degree of tortuosity of this vessel. In a significant percentage of cases, the brachiocephalic artery bifurcates somewhat distally; in these cases the right subclavian artery has an oblique course, and if thin sections are not obtained near the thoracic inlet, it may not be seen at all. When the right common carotid and right subclavian arteries are visible, they normally are found only in sections through the uppermost portion of the superior mediastinum. Visualization of these vessels in a more inferior position, just above the aortic arch, frequently indicates the presence of some type of vascular mediastinal anomaly, usually involving the aortic arch. This has been termed the “four vessel sign” by McLoughlin et al. (75); it is common in double aortic arch.
and degree of tortuosity of this vessel. In a significant percentage of cases, the brachiocephalic artery bifurcates somewhat distally; in these cases the right subclavian artery has an oblique course, and if thin sections are not obtained near the thoracic inlet, it may not be seen at all. When the right common carotid and right subclavian arteries are visible, they normally are found only in sections through the uppermost portion of the superior mediastinum. Visualization of these vessels in a more inferior position, just above the aortic arch, frequently indicates the presence of some type of vascular mediastinal anomaly, usually involving the aortic arch. This has been termed the “four vessel sign” by McLoughlin et al. (75); it is common in double aortic arch.
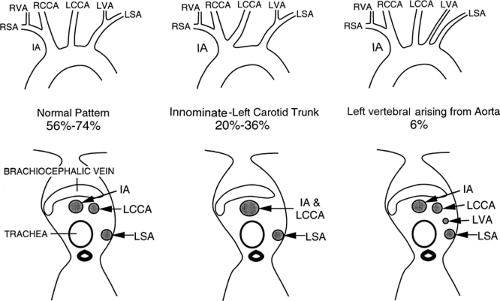 Figure 2-12 The most common branching patterns of the arch great vessels, with their approximate frequencies and typical CT appearances. IA, innominate artery; LCCA, left common carotid artery; LSA, left subclavian artery; LVA, left ventricle artery; RVA, right ventricle artery; RSA, right subclavian artery. |
 Figure 2-13 Common origin of the left common carotid and innominate artery (bovine aorta). A: Oblique sagittal maximum intensity projection image from breath-hold gadolinium-enhanced three-dimensional MR angiogram fails to demonstrate the origin of the left common carotid artery because of extreme tortuosity. B: Reformatted image from same dataset demonstrates that the left common carotid does arise from a common trunk with the innominate artery and loops inferiorly just after its origin. |
 Figure 2-14 Direct origin of the vertebral artery from the aortic arch. Oblique sagittal maximum intensity projection image from breath-hold gadolinium-enhanced three-dimensional MR angiogram (A) and axial MDCT image (B) demonstrate a direct origin of the left vertebral artery from the aortic arch (arrow). Note that the vertebral artery (arrow) is anterior to the left subclavian and posterior to the left common carotid artery in B. |
Although the great vessels should be recognizable by their characteristic appearances and locations, tortuosity or ectasia of these vessels may present a confusing picture and be easily mistaken as pathologic. Use of intravenous contrast media, with or without multiplanar reformations, will almost always resolve this problem. Alternatively, MRA readily demonstrates tortuosity (Fig. 2-13), ectasia, and vessel loops that may present clinically as a palpable neck mass (Fig. 2-15).
The subclavian arteries exit and enter the mediastinum by crossing over the first ribs, behind the proximal portions of the clavicles. The subclavian vein lies anterior and the subclavian artery lies posterior to the anterior
scalenus muscle, which attaches to the superior border of the first rib. The transition from the mediastinal to the axillary portions of the subclavian arteries is difficult to visualize because they angle sharply as they cross over the first rib. The axillary portions of the subclavian arteries lie posterior to the corresponding veins.
scalenus muscle, which attaches to the superior border of the first rib. The transition from the mediastinal to the axillary portions of the subclavian arteries is difficult to visualize because they angle sharply as they cross over the first rib. The axillary portions of the subclavian arteries lie posterior to the corresponding veins.
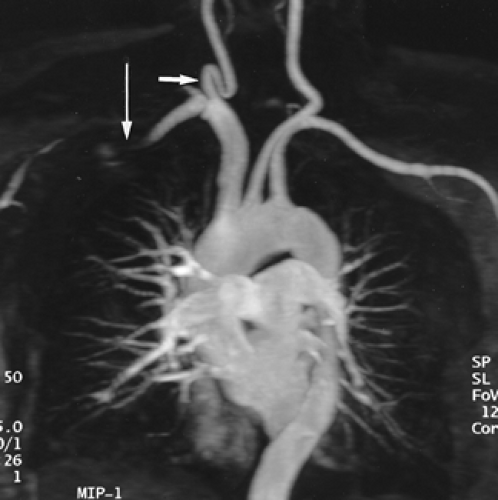 Figure 2-15 Redundant common carotid artery presenting as a palpable neck mass with pseudo-occlusion of the right axillary artery. Coronal maximum intensity projection image from breath-hold gadolinium-enhanced three-dimensional MR angiogram in a patient referred for a palpable neck mass demonstrates the mass as a common carotid artery loop (short arrow). Diffuse signal loss in the right axillary artery (long arrow) is artifactual and caused by stagnant, concentrated gadolinium in the adjacent vein draining the injection site. This resulted from failure to administer a flush after the gadolinium bolus. (From reference 34, with permission.) |
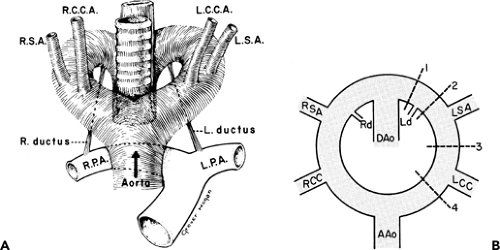 Figure 2-16 A: Hypothetical double aortic arch of Edwards. (From Shuford WH, Sybers RG. The aortic arch and its malformations. Springfield, IL: Charles C Thomas; 1974 , with permission.) B: Schematic representation of embryonic double aortic arch. Normally, there is interruption of the right arch distal to the right subclavian artery. The result is a normal left arch. Right aortic arches result when there is interruption of some portion of the left aortic arch. Five potential sites of interruption have been identified. If there is interruption distal to the left subclavian (at either 1 or 2), the result is a right aortic arch with mirror image branching (types 1 and 2). If there is interruption between the left subclavian and left common carotid arteries (at 3), the result is a right aortic arch with an aberrant left subclavian (type 3). If the arch is interrupted proximal to the left common carotid artery (at 4), the result is a right arch with an aberrant innominate artery (type 4). Finally, interruption may occur both distal to the left subclavian artery and proximal to the left subclavian artery (at 1 and 3); this results in an isolated left subclavian artery, connected to the left pulmonary artery through the left ductus arteriosus (type 5). DAo, descending aorta; AAo, ascending aorta; LSA, left subclavian artery; LCC, left common carotid artery; Ld, left ductus arteriosus; Rd, right ductus; RCC, right common carotid artery; RSA, right subclavian artery. |
Congenital Aortic Disease
Aortic Arch Anomalies
To recognize anomalies of the aorta and great vessels, it is helpful to have a working knowledge of embryology. These anomalies are most easily understood if the hypothetical double arch system, described by Edwards (76), is used as a framework. As shown in Figure 2-16, in this system there is an aortic arch and a potential ductus arteriosus on each side; the descending aorta is in the midline posteriorly. Interruption of this arch at different locations can explain the various aortic arch anomalies. These can be divided into three main groups: left aortic arch anomalies, right aortic arch anomalies, and double aortic arch anomalies.
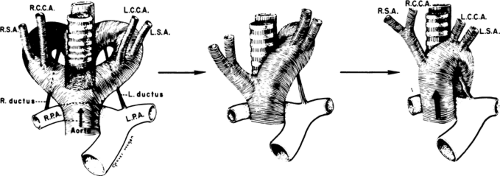 Figure 2-17 Hypothesized embryologic development of the normal left arch. The shaded portion of the right arch, distal to the right subclavian artery, is interrupted. (From Shuford WH, Sybers RG. The aortic arch and its malformations. Springfield, IL: Charles C Thomas; 1974 , with permission.) |
Normally, there is interruption of the hypothetical right arch distal to the right subclavian artery. The right common carotid and subclavian arteries fuse to become the right brachiocephalic artery as the proximal portion of the embryologic right arch becomes incorporated into the left arch. The result is the normal left-sided aortic arch. This is demonstrated in Figure 2-17.
 Figure 2-18 Schematic representation of an aberrant right subclavian artery. |
Left Aortic Arch Anomalies
The most common congenital anomaly of the aorta is an aberrant right subclavian artery originating from an otherwise normal left-sided arch. This occurs in approximately 0.5% of the normal population (76). According to Edward’s model, this occurs when there is interruption of the embryologic right aortic arch between the right common carotid and the right subclavian arteries. The right subclavian artery then originates from the posterior portion of the left-sided arch and crosses the mediastinum obliquely from left to right, lying posterior to the trachea and esophagus (Figs. 2-18 and 2-19).
Dilatation of the artery at its origin (Kommerell diverticulum) is common (Fig. 2-20), occurring in up to 60% of cases, and may present as dysphagia. True aneurysms of an aberrant right subclavian artery (Fig. 2-21) have a mortality as high as 50% and should be surgically repaired (77). Many arch vessel anatomic variants coexist with aberrant subclavian arteries; the most frequent is a common origin of both carotid arteries, which occurs in 48% of cases (Fig. 2-22) (78). Less common is a direct origin of the vertebral artery from its ipsilateral carotid artery; this occurs almost exclusively in patients with aberrant subclavian arteries (78).
Dilatation of the artery at its origin (Kommerell diverticulum) is common (Fig. 2-20), occurring in up to 60% of cases, and may present as dysphagia. True aneurysms of an aberrant right subclavian artery (Fig. 2-21) have a mortality as high as 50% and should be surgically repaired (77). Many arch vessel anatomic variants coexist with aberrant subclavian arteries; the most frequent is a common origin of both carotid arteries, which occurs in 48% of cases (Fig. 2-22) (78). Less common is a direct origin of the vertebral artery from its ipsilateral carotid artery; this occurs almost exclusively in patients with aberrant subclavian arteries (78).
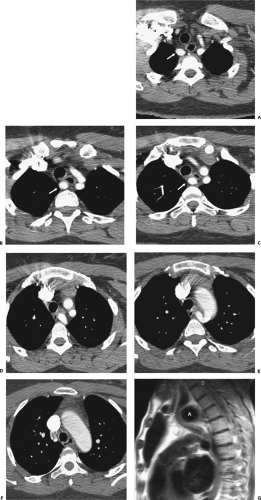 Figure 2-19 Aberrant right subclavian artery. A–F: Sequential CT images through the mediastinum from the great vessels to the aortic arch, inferiorly, respectively. An aberrant right subclavian artery is present, arising from the medial-posterior portion of the aortic arch on the left. This artery passes posterior to the esophagus and trachea (arrow in C) and then proceeds superiorly to eventually lie in a normal position in the superior mediastinum (arrows in A–C). G: Sagittal MR image in another patient with an aberrant right subclavian artery. Again, the aberrant subclavian artery (labeled A in G) is posterior to the esophagus and trachea (arrow in G) with compression of these structures. |
Right Aortic Arch Anomalies
Using Edward’s double aortic arch model, five potential anomalies can occur, although only two are relatively common. The type of anomaly encountered will depend on the exact point at which the left aortic arch is interrupted.
 Figure 2-20 Enlargement of an aberrant subclavian artery at its origin (diverticulum of Kommerell). Oblique sagittal maximum intensity projection image (A) and axial reformation (B) from breath-hold gadolinium-enhanced three-dimensional MR angiogram show enlargement of the origin of an aberrant right subclavian artery. (From reference 34, with permission.) |
 Figure 2-21 Aneurysm, aberrant right subclavian artery. Contrast-enhanced CT image at the level of the aortic arch demonstrates an aneurysm of an aberrant right subclavian artery (arrow) with considerable amount of thrombus. The aneurysm causes considerable mass effect on the adjacent esophagus (curved arrow). |
The most common right aortic arch anomaly is a right aortic arch with an aberrant left subclavian artery (Fig. 2-23). This occurs in approximately 1 in 2,500 patients. The sequence of events leading to this malformation is illustrated in Figure 2-24. In this case, there is interruption of the left arch between the left common carotid and left subclavian arteries. This results in an anterior left common carotid artery as the first branch of the ascending aorta and a retroesophageal left subclavian artery, which may also result in dysphagia when aneurysmal. If the right arch itself becomes aneurysmal, it may also compress the esophagus (Fig. 2-25). This variant is usually not associated with congenital heart disease. In both aberrant right and left subclavian arteries, the portion of the aberrant artery that is adjacent to the spine may be compressed, resulting in vessel narrowing. A right aortic arch with mirror-image branching occurs if the hypothetical left arch is interrupted distal to the left subclavian artery. This anomaly is significant because of the high incidence of concomitant congenital heart disease, usually tetralogy of Fallot. Other rare left aortic arch anomalies may result in
the syndrome of the interrupted aortic arch (IAA), which is discussed in detail elsewhere in this chapter.
the syndrome of the interrupted aortic arch (IAA), which is discussed in detail elsewhere in this chapter.
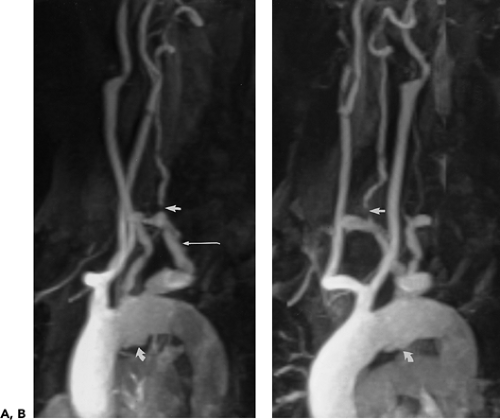 Figure 2-22 Aberrant right subclavian artery associated with common origin of both common carotid arteries. A, B: Oblique sagittal maximum intensity projection images from breath-hold, gadolinium-enhanced three-dimensional MR angiogram demonstrate plaque within an aberrant right subclavian artery (long arrow in A), which is stenotic at its origin. There is a severe stenosis of the ipsilateral vertebral artery (straight arrows) and the origin of the left subclavian artery. Both carotid arteries arise from a common trunk. There is a deep ulcerated plaque on the inferior aspect of the aortic arch (curved arrows). (From reference 34, with permission.) |
 Figure 2-23 Right-sided aortic arch with aberrant left subclavian artery. Coronal (A) and oblique sagittal (B) maximum intensity projection images from breath-hold, gadolinium-enhanced three-dimensional MR angiogram show a right-sided aortic arch with a stenosis at the origin (long arrow in A) and midportion (short arrows) of an aberrant left subclavian artery. The left vertebral artery is occluded and the right vertebral artery is prominent with a focal stenosis (curved arrows). The injection of contrast was administered through the right arm. (From reference 34, with permission.) |
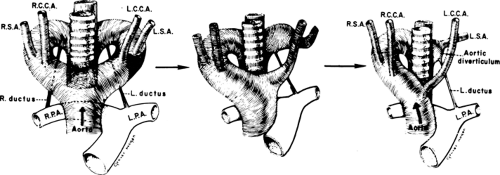 Figure 2-24 Hypothesized embryonic development of a right aortic arch with an aberrant left subclavian artery. RSA, right subclavian artery; RCCA, right common carotid artery; LCCA, left common carotid artery; LSA, left subclavian artery; LPA, left pulmonary artery; RPA, right pulmonary artery. (From Shuford WH, Sybers RG. The aortic arch and its malformations. Springfield, IL: Charles C Thomas; 1974 , with permission.) |
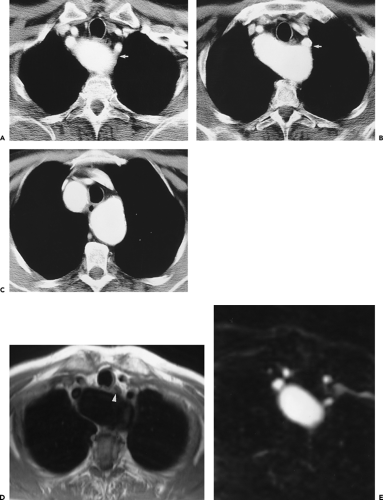 Figure 2-25 Aneurysmal dilatation of a right-sided aortic arch with aberrant left subclavian artery: CT and MR demonstration. A–C: Sequential MDCT images through the mediastinum from the great vessels to the aortic arch, inferiorly, respectively. There is aneurysmal dilatation of the ascending, arch, and descending portions of a right aortic arch. The left subclavian artery arises from the descending aorta (arrows in A and B). D: T1-weighted SE MR image at the same level as A demonstrates displacement of the esophagus anteriorly (arrowhead). E: Axial reformation from breath-hold gadolinium-enhanced three-dimensional MR angiogram at the same level as A and D demonstrates a four-vessel arch configuration. Note that because of the arch aneurysm the superiormost portion of the aorta is at the thoracic inlet and appears similar to a cervical aortic arch. |
In the usual case of right aortic arch with mirror-image branching, interruption of the left arch occurs distal to the ductus arteriosus. The result is that there is no structure posterior to the trachea or esophagus. Rarely, interruption occurs distal to the left subclavian artery but proximal to the ductus (79). If the ductus on the left side persists the result is a true vascular ring.
Symptomatic Arch Anomalies
Symptomatic arch anomalies include double aortic arch, right arch with aberrant left subclavian artery and persistent left ligamentum arteriosum, and cervical arch. All of these abnormalities can result in tracheal and esophageal compression, but the former two often present in infancy with respiratory or feeding problems. Cervical aortic arches are rare anomalies that are usually right sided and are associated with unusual great vessel origins (80). The innominate artery may fail to form, and there are usually separate origins of the subclavian and carotid arteries. They are often circumflex, crossing the chest or lower neck in a near coronal orientation that may result in compression of the esophagus (81) and may present as a pulsatile neck mass.
Double aortic arches have been classified into two types, depending on the patency of the arches (79). The most frequent form is a functional double aortic arch. In this case, both arches remain patent; the right common carotid and subclavian arteries arise from the right arch, whereas the left common carotid and subclavian arteries arise from the left arch. Both arches join posteriorly to form one descending aorta, which may be midline or, more usually, left sided. The two arches may be of equal size, although the right arch is generally larger (Fig. 2-26). Less common is the double arch in which atresia of some portion of the left arch has occurred. There is similarity between this condition and some of the right aortic arch anomalies. Theoretically, the major difference is that with double aortic arches, some portion of the left arch persists despite atresia, and a vascular ring around the trachea and esophagus is present. With right aortic arch anomalies there is true interruption of the left aortic arch, and a true vascular ring is rarely formed.
ECG-triggered SE MR (82, 83, 84), 2D TOF, cine MR, and phase-contrast MR (85, 86) can readily demonstrate symptomatic arch anomalies (Fig. 2-27) but require multiple imaging planes, which are time consuming to perform and result in limited postprocessing potential. A single volume gadolinium-enhanced 3D MRA acquisition offers higher spatial resolution, higher signal-to-noise, and faster acquisition times and provides for high-quality surgically pertinent multiplanar reformations (87). However, without breath holding, respiratory-induced blurring can result in significant degradation of image quality with this technique.
Helical CTA has successfully been used in the evaluation of pediatric great vessel anomalies (56,88, 89, 90, 91). Advantages over MR imaging include rapid scanning time, which allows for examination of critically ill children without the constraints of a closed-bore magnet, and better evaluation of the relationships of aberrant vessels with the airways and the esophagus. Hopkins et al. (90) evaluated 15 children (aged 1 month to 12 years) with helical CTA using 3-mm collimation and a bolus of 2 mL/kg of nonionic contrast injected by hand at 1 mL/second.
Scanning began immediately after the infusion of contrast finished and was performed with breath holding in two children and during quiet respiration in 13. Using 2D axial images and 3D SSD, they were able to diagnose anomalies correctly in 13 children (87%), including double and right-sided aortic arches, aberrant subclavian arteries, innominate artery compression syndrome, and pulmonary artery abnormalities (90). More recently 16-slice MDCT was used to diagnose infants with double aortic arches with thinner collimation, faster imaging times (mean 4 sec), and reduced contrast dose (91).
Scanning began immediately after the infusion of contrast finished and was performed with breath holding in two children and during quiet respiration in 13. Using 2D axial images and 3D SSD, they were able to diagnose anomalies correctly in 13 children (87%), including double and right-sided aortic arches, aberrant subclavian arteries, innominate artery compression syndrome, and pulmonary artery abnormalities (90). More recently 16-slice MDCT was used to diagnose infants with double aortic arches with thinner collimation, faster imaging times (mean 4 sec), and reduced contrast dose (91).
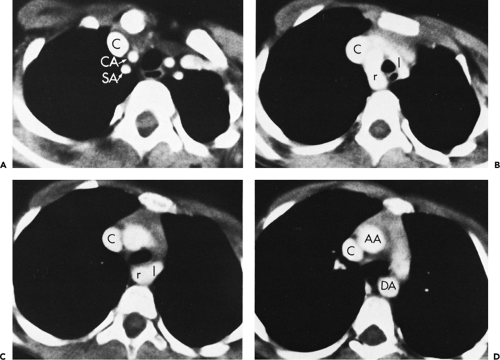 Figure 2-26 Double aortic arch. A: Most superior image shows carotid (CA) and subclavian (SA) vessels on both sides of the trachea. B: Contiguous inferior image shows a larger right aortic arch (r) and a smaller left aortic arch (l) giving rise to the great vessels. C: The right aortic arch (r) crosses to the left of the midline and joins the descending left aortic arch (l). Note that the trachea is not severely compressed at this level. D: Most inferior image at the level of the aortic pulmonary window. C, superior vena cava; AA, ascending aorta; DA, descending aorta. |
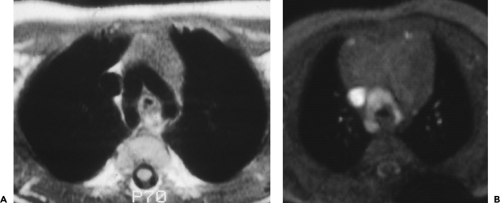 Figure 2-27 Double aortic arch: MR demonstration in two patients. A: T1-weighted SE MR image demonstrates a double aortic arch. In this case both arches are the same size. B: Cine gradient-echo MR image in a different child demonstrates a double aortic arch, with the right arch larger than the left. |
Interrupted Aortic Arch
IAA is an interruption in the continuity of the aortic arch, often with a fibrous cord between the two segments. It occurs in three places: (a) just distal to the origin of the left subclavian artery, (b) between the origins of the left common carotid and left subclavian arteries (Fig. 2-28), and (c) between the origins of the innominate and left common carotid arteries (92). These correspond to types A (25%), B (70%), and C (5%) in the Celoria and Patton classification (93). A large patent ductus arteriosus invariably supplies blood to the descending aorta. IAA is also associated in the majority of cases with intracardiac defects and subaortic outflow obstruction. IAA usually presents within the first few days of life, as the ductus closes. Rapidly progressive congestive heart failure ensues. The mortality rate at 10 days is 50%, and, by the end of the first month, 75%. Initial management includes prostaglandin therapy to maintain the patency of the PDA. Echocardiography has traditionally been used to quickly diagnose IAA, but distinguishing between IAA type A and severe coarctation is difficult. Hemodynamically stable patients, as well as those who have undergone surgical repair, can be evaluated with cine (94) or gadolinium-enhanced 3D MRA (95). Critically ill patients and those who cannot tolerate anesthesia are better studied with MDCT (96).
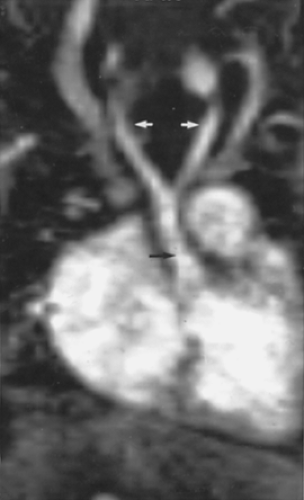 Figure 2-28 Interrupted aortic arch with hypoplastic ascending aorta in a 10-day-old infant. Coronal reformation from non–breath-hold gadolinium-enhanced three-dimensional MR angiogram, performed in the head coil, demonstrates a hypoplastic, 4-mm ascending aorta (black arrow), which bifurcates into both common carotid arteries (white arrows). The arch was interrupted distal to the common carotid arteries. (From Krinsky G, Weinreb J. Gadolinium-enhanced three-dimensional MR angiography of the thoracoabdominal aorta. Semin Ultrasound CT MR. 1996:17:280–303 , with permission.) |
Coarctation
Clinical Features
Coarctation of the aorta represents a focal narrowing in the proximal descending thoracic aorta, usually in the region of the ductus arteriosus. When associated with tubular hypoplasia of the aortic arch or descending aorta (Fig. 2-29), it is usually referred to as preductal or infantile. Patients with aortic coarctation may present with congestive heart failure as infants when a patent ductus arteriosus closes; alternatively, the condition may be discovered during workup of a coexistent cardiac anomaly, the most common being a bicuspid aortic valve, which occurs in 75% to 85% of patients. In 2% of patients coarctation may occur as an isolated segment of narrowing of the abdominal aorta.
Treatment
Three types of surgical repair of coarctation remain in common use: resection of the stenosed segment of aorta with end-to-end anastomosis, use of a subclavian flap that is mobilized proximal to the internal mammary artery and reflected down as a flap to bridge the coarctation, and patch aortoplasty (using synthetic material for the patch) (97). The choice of operative technique is influenced by the morphology of the coarctation, the age of the patient, and the personal preference of the surgeon, although among surgeons specializing in congenital heart disease, end-to-end anastomosis has become the most popular option, as it probably provides the best anatomic relief of obstruction, has the lowest risk of recoarctation, and probably has the lowest incidence of late aneurysm formation. Dacron patch aortoplasty was a commonly used repair technique that resulted in a low rate of recurrence and
stenosis, but because of an alarming incidence of late aortic rupture and sudden death resulting from aneurysm formation (98), this technique is now rarely performed. Recoarctation (in reality a mixture of residual and recurrent coarctation) occurred in approximately 10% of cases in most published surgical series up until the early 1990s, but in the last decade refinement of the end-to-end anastomosis has resulted in a reduction in recoarctation to less than 4% (99).
stenosis, but because of an alarming incidence of late aortic rupture and sudden death resulting from aneurysm formation (98), this technique is now rarely performed. Recoarctation (in reality a mixture of residual and recurrent coarctation) occurred in approximately 10% of cases in most published surgical series up until the early 1990s, but in the last decade refinement of the end-to-end anastomosis has resulted in a reduction in recoarctation to less than 4% (99).
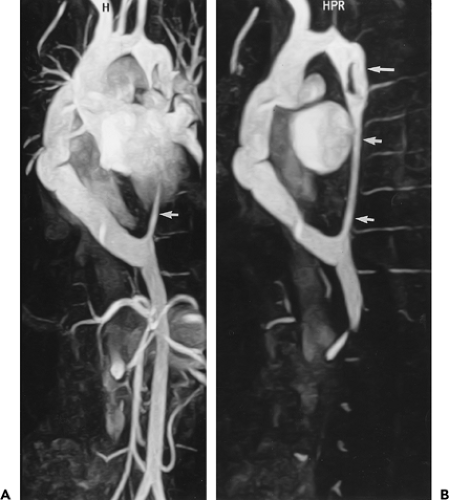 Figure 2-29 Aortic coarctation and a hypoplastic descending aorta in an 18-year-old man treated with extra-anatomic bypass from the ascending to descending aorta. This case represents the importance of subvolume maximum intensity projection (MIP) images in removing extraneous anatomy that may obscure the vessels of interest. Oblique sagittal MIP image from breath-hold gadolinium-enhanced three-dimensional (3D) MR angiogram (A) demonstrates an extra-anatomic bypass graft from the ascending aorta to the descending aorta. Arrow represents a portion of the distal hypoplastic native aorta. Subvolume oblique sagittal MIP image from breath-hold gadolinium-enhanced 3D MR angiogram (B) demonstrates the complete extent of the coarctation and hypoplastic aorta (short arrows) as well as the initial bypass graft (long arrow) that was unable to adequately decrease left ventricular afterload and hypertension. The extra-anatomic bypass graft from the ascending aorta to the descending aorta was subsequently placed and resulted in normalization of blood pressure and a decrease in left ventricular mass. (From reference 29, with permission.) |
More recently, transluminal balloon angioplasty with or without stenting has been used successfully in selected cases and may be the procedure of choice for recoarctation without aneurysm formation. This nonsurgical treatment works best when the stenosis is focal and located just distal to the left subclavian artery. In a randomized trial comparing surgery and balloon angioplasty for native coarctation, aneurysms visible on angiography were present in 20% of cases after angioplasty compared with none after surgery (100). In another recent randomized study in children, angioplasty was associated with a higher incidence of aneurysm formation and iliofemoral arterial injury than was surgery (101). However, long-term results from stent placement for coarctation or recoarctation have proven much better than angioplasty alone, with a negligible recoarctation rate and no aneurysm formation (102).
Adults with coarctation usually present with hypertension and discrepant blood pressure measurements in the arms and legs and less commonly with symptoms of aortic stenosis, aneurysms, and, rarely, aortic dissection. Almost all patients with coarctation of the aorta will have concomitant left ventricular hypertrophy. Coarctation in adults is often associated with medial degenerative disease of the aorta; thus, resection with interposition graft is a widely used surgical approach. If primary resection is not feasible, extra-anatomic bypass grafting from the ascending to descending aorta can be performed (Figs. 2-29 and 2-30) under cardiopulmonary bypass (103).
A less invasive alternative is transluminal angioplasty with stent graft placement, but the long-term results are unknown.
A less invasive alternative is transluminal angioplasty with stent graft placement, but the long-term results are unknown.
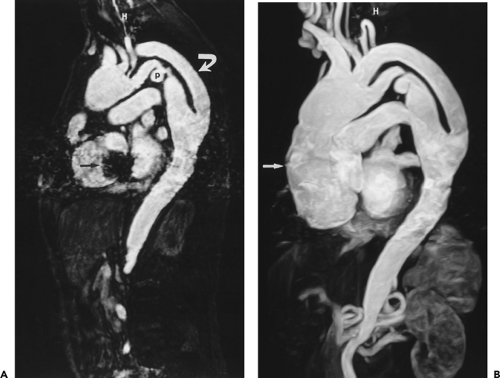 Figure 2-30 Patent extra-anatomic aortic bypass graft in an adult patient with untreated aortic coarctation associated with a native aortic pseudoaneurysm. The patient was being evaluated for an ascending aortic aneurysm and aortic valve insufficiency. A: Oblique sagittal source image from non–breath-hold gadolinium-enhanced three-dimensional acquisition clearly demonstrates an extra-anatomic graft (curved arrow) and pseudoaneurysm (p) of the native aorta. There is also narrowing of the proximal left subclavian artery. Susceptibility artifact is present from a prosthetic mitral valve (arrow). B: Oblique sagittal maximum intensity projection (MIP) image shows an ascending aortic aneurysm (arrow) and a normal abdominal aorta. Note the susceptibility artifact is obscured in the MIP image. (From reference 31, with permission.) |
Pseudocoarctation of the aorta results from a congenital elongation of the aortic arch with resultant redundancy and kinking (Figs. 2-31 and 2-32) (104). Unlike coarctation, however, there is no obstruction to blood flow and therefore little or no demonstrable pressure gradient and no evidence of collateral circulation (105, 106).
Imaging Features
MR Evaluation
Although both MDCT and MR have been successfully used to diagnose coarctation, in our opinion, MR has proved of greater value, especially in the pediatric age group as well as for routine postsurgical evaluation, as pressure gradients across the stenotic lesions can be determined (107).
Various traditional MR imaging techniques, performed in the axial and oblique sagittal plane, have been successfully used in the evaluation of coarctation, to assess the location, the degree of anatomic narrowing, and the extent of collateral circulation. These include multiplanar ECG- triggered TI-weighted SE techniques (108) supplemented by phase-contrast (109) or cine MRA (110, 111). The latter technique, when performed in the oblique sagittal plane, can readily demonstrate the dephasing that occurs from turbulent flow across the site of narrowing. Cine phase-contrast techniques, including velocity-encoded cine MR, are used to measure the peak velocity across the site of coarctation (107). With this information, the pressure gradient across the coarctation can be estimated. One study demonstrated that peak coarctation jet velocity measured by MR velocity mapping was comparable to results obtained with continuous wave Doppler sonography (51), and a more recent study showed it was similar but added additional morphologic evaluation not assessable by sonography (112). This technique can also be used to determine the extent of collateral circulation by measuring flow immediately distal to the coarctation and at the level of the diaphragm. In normal aortas, flow will
decrease by an average of 8% as it reaches the diaphragm, whereas in patients with hemodynamically significant coarctation, the flow will be augmented by an average of 80% (113).
decrease by an average of 8% as it reaches the diaphragm, whereas in patients with hemodynamically significant coarctation, the flow will be augmented by an average of 80% (113).
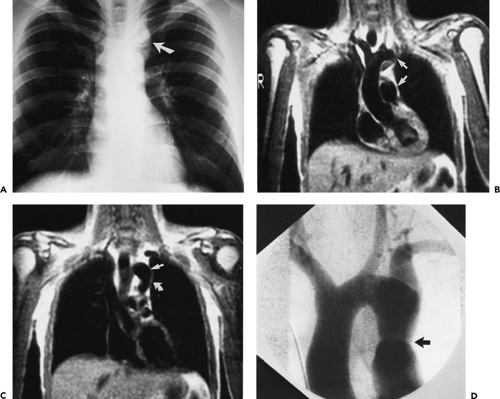 Figure 2-31 Pseudocoarctation. A: Posteroanterior radiograph shows unusual configuration of the superior mediastinum on the left side (arrow). Differentiation between an aneurysm and a mediastinal mass is difficult. B, C: Sequential coronal MR images through the root of the aorta and posterior portion of the aortic arch, respectively. The ascending aorta is elongated as indicated by the considerable distance between the arch superiorly and the main pulmonary artery inferiorly (arrows in B). There is aneurysmal dilation of the aorta (arrow in C), below which there is abrupt narrowing of the lumen, suggesting possible coarctation (curved arrow in C). D: Coned-down view from a subtraction aortogram shows characteristic kink in the course of the aorta (arrow) without actual narrowing. No pressure gradients could be measured across this region. (Case courtesy of Patricia Redmond, MD, Staten Island, NewYork.) |
Gadolinium-enhanced 3D MRA can readily demonstrate the presence of collateral circulation (Fig. 2-33) as well as the degree of associated arch hypoplasia (Fig. 2-29) and concomitant branch vessel abnormalities. It also provides excellent anatomic images of the extent of coarctation without dephasing artifacts from turbulent flow and allows reformation of 3D data into multiple surgically pertinent imaging planes in patients with associated tubular hypoplasia (Fig. 2-29). CT (90) and, more recently, ECG-gated MDCT can also demonstrate the anatomic segment of coarctation and the presence of collateral vessels (114) (Fig. 2-34).
MR may be used to predict the response of patients who are candidates for balloon angioplasty and/or stent placement (115, 116). The best results with balloon angioplasty occur when the stenosis is focal and located just distal to the left subclavian artery. When the stenosis involves the proximal arch or involves a long segment, balloon angioplasty is less successful. As documented by Bank et al. (116) in their study of 12 children with suspected coarctation evaluated both before and after surgical repair, MR proved accurate in identifying those patients who were unlikely to benefit from angioplasty. In addition, MR proved valuable by determining the appropriate balloon size for angioplasty.
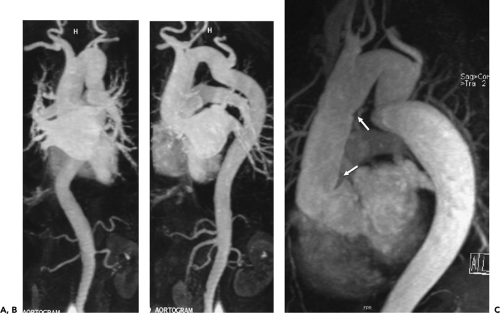 Figure 2-32 Two patients with aortic pseudocoarctation demonstrated with MR angiography (MRA). Coronal (A) and oblique sagittal (B) maximum intensity projection images from breath-hold gadolinium-enhanced three-dimensional MR angiogram demonstrate pseudocoarctation. Note the redundant aorta associated with buckling and inferior displacement of the left subclavian artery and the complete absence of collateral vessels. In a second patient with pseudocoarctation (C), note the presence of previous supracoronary ascending aortic graft replacement as areas of graft puckering (arrows). (A, B from reference 29, with permission.) |
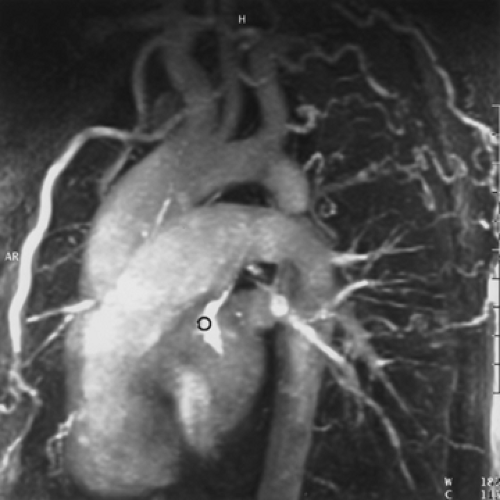 Figure 2-33 Aortic coarctation—evaluation with gadolinium-enhanced MR angiography (MRA). Oblique sagittal maximum intensity projection image from breath-hold gadolinium-enhanced three-dimensional MRA demonstrates aortic coarctation with extensive collateral circulation. (From reference 29, with permission.) |
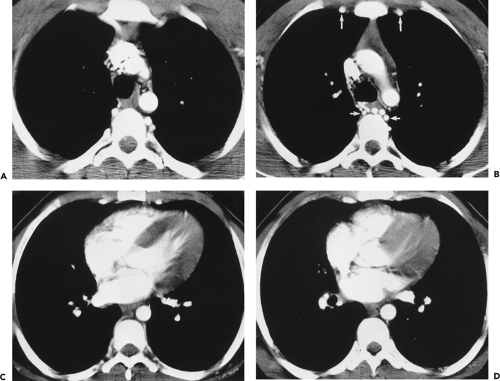 Figure 2-34 Aortic coarctation—CTA evaluation. A–D: Sequential contrast-enhanced helical CTA from superior to inferior demonstrates multiple collateral vessels, including intercostal (short arrows in B) and internal mammary (long arrows in B) arteries. Left ventricular hypertrophy is present as well. The site and degree of narrowing are not well visualized. |
All patients with surgically repaired coarctation should undergo surveillance either with MR (111, 112, 117) or with MDCT imaging to detect recurrent coarctation and pseudoaneurysm formation (Fig. 2-35). One study using ECG-triggered 2D TOF MRA with 3D surface renderings demonstrated a sensitivity of 100% for the detection of aneurysms (98). Recurrent coarctation after primary repair may result from multiple causes, including inadequate removal of ductal tissue, failure to repair associated aortic arch hypoplasia, and suture line tension (118). These patients can be treated with transluminal angioplasty and/or stenting with excellent results (102). Alternatively, coarctation resection and/or extra-anatomic bypass grafting from the aortic arch to the descending aorta (Figs. 2-29, 2-30, and 2-35) can be performed with excellent long-term results (103).
Pulmonary Sequestration
Pulmonary sequestrations are defined as areas of nonfunctioning lung tissue that are not in continuity with the tracheobronchial tree and derive their blood supply from systemic vessels. Traditionally divided into intra- and extralobar forms, they are now considered by most authors to be two entirely separate entities. Intralobar sequestrations are contiguous with normal lung parenchyma, enclosed by normal pleura. In distinction, extralobar pulmonary sequestrations lie outside the normal pleura, frequently appearing as solid masses of tissue. Intralobar sequestrations are only rarely associated with other malformations and typically are first identified in later life, often as an asymptomatic finding on routine chest radiographs. In distinction, extralobar pulmonary sequestrations are frequently seen in association with other congenital abnormalities and are most often
identified in either the neonatal period or early childhood. In patients with intralobar sequestration, the feeding artery arises from the thoracic aorta in 73% of cases, the abdominal aorta or celiac axis in 20%, and the intercostal arteries in 4% (119). Venous drainage typically is to normal pulmonary veins. Although extralobar sequestrations also typically derive blood from the arterial circulation, these frequently are considerably smaller vessels than seen in patients with intralobar sequestrations. Unlike intralobar sequestrations, however, venous drainage is almost always to systemic veins, including the azygos and hemiazygos veins, as well as the inferior vena cava (IVC) and even the portal vein.
identified in either the neonatal period or early childhood. In patients with intralobar sequestration, the feeding artery arises from the thoracic aorta in 73% of cases, the abdominal aorta or celiac axis in 20%, and the intercostal arteries in 4% (119). Venous drainage typically is to normal pulmonary veins. Although extralobar sequestrations also typically derive blood from the arterial circulation, these frequently are considerably smaller vessels than seen in patients with intralobar sequestrations. Unlike intralobar sequestrations, however, venous drainage is almost always to systemic veins, including the azygos and hemiazygos veins, as well as the inferior vena cava (IVC) and even the portal vein.
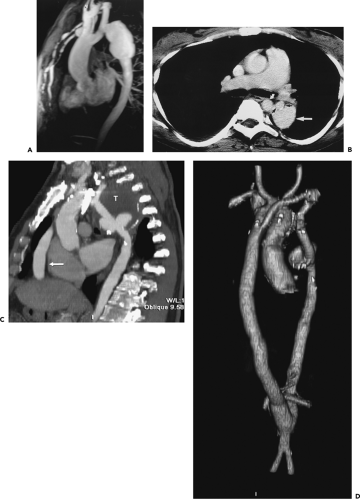 Figure 2-35 Aortic coarctation and postoperative pseudoaneurysm formation detected by CT and MR in three different patients. A: Oblique sagittal maximum intensity projection image from breath-hold gadolinium-enhanced three-dimensional MR angiogram demonstrates an aneurysm at the site of previous coarctation repair. Note the enlarged, tortuous internal mammary arteries with areas of focal stenosis. B: Axial contrast-enhanced CT image through the level of the right pulmonary artery demonstrates a pseudoaneurysm (long arrow) adjacent to the aortic graft (small arrows). Curved arrow denotes the native aorta. C: Sagittal reformatted image from multidetector CT (MDCT) shows a large pseudoaneurysm with thrombus (T) at the site of previous coarctation repair. Note segment of extra-anatomic bypass (arrow) from ascending aorta. D: Volume-rendered image in same patient shows exclusion of the pseudoaneurysm and extra-anatomic bypass from innominate artery to distal abdominal aorta with a second graft revascularizing the distal left subclavian artery. (Images C and D courtesy of Gary Israel, MD, New Haven, Connecticut.) |
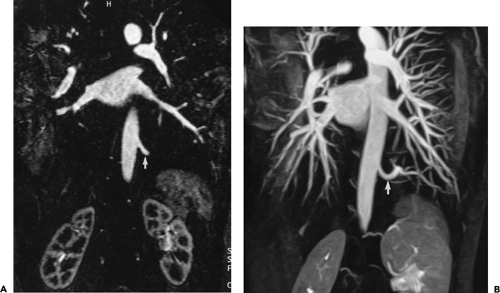 Figure 2-36 A, B: MR demonstration of vascular supply to intralobar sequestration. Coronal source (A) and maximum intensity projection (B) images from breath-hold gadolinium-enhanced three-dimensional MR angiogram demonstrate a feeding vessel (arrows in A and B) to a pulmonary sequestration. |
Regardless of the type of sequestration, both aberrant arteries and veins are easily identified using either MDCT or MR (120, 121, 122) (Fig. 2-36). A potential advantage of MDCT in these cases is the ability to simultaneously evaluate lung parenchymal abnormalities that frequently are present, especially in patients with intralobar sequestrations (121).
Acquired Aortic Disease
Thoracic Aortic Aneurysms
Clinical Features
Aortic aneurysm is defined as an irreversible dilatation of the aorta with all components of the aortic wall present in the dilated segment (123, 124). Thoracic aneurysms may involve one or more aortic segments (aortic root, ascending aorta, arch, or descending aorta) and are classified accordingly. Sixty percent of thoracic aortic aneurysms (TAAs) involve the aortic root and/or ascending aorta, 40% involve the descending aorta, 10% involve the arch, and 10% involve the thoracoabdominal aorta (with some involving >1 segment). The etiology, natural history, and treatment of thoracic aneurysms differ for each of these segments (125). Although medial and aortic valve disease is a more common etiology for ascending aortic aneurysm, most descending TAAs are due to both atherosclerosis and medial disease, similar to abdominal aortic aneurysms (AAAs). Medial degeneration leads to weakening of the aortic wall, which in turn results in aortic dilatation and aneurysm formation. When such aneurysms involve the aortic root, the anatomy is often referred to as annuloaortic ectasia. Cystic medial degeneration occurs normally to some extent with aging, but the process is accelerated by hypertension. Patients with bicuspid aortic valves develop ascending aortic aneurysms unrelated to valvular disease but rather to concomitant medial degeneration (125). As previously discussed, aortic size is age related, and a 4-cm ascending aorta is clearly aneurysmal in a 30-year-old but normal in an octogenarian. The etiology of thoracic aneurysmal disease is broad, including degenerative disease, connective tissue disorders, trauma, aortitis (infective and inflammatory), previous surgery, hemodynamic alterations (from aortic stenosis and regurgitation), and congenital abnormalities. The histologic changes occurring in the diseased aorta include medial degeneration, medial necrosis, atherosclerosis, and
inflammatory infiltration. Pseudoaneurysms, or false aneurysms, represent saccular dilatations of the aorta that do not contain an intimal layer and are usually associated with previous penetrating atheromatous ulcers, aortic surgery, trauma, or infections (Fig. 2-37).
inflammatory infiltration. Pseudoaneurysms, or false aneurysms, represent saccular dilatations of the aorta that do not contain an intimal layer and are usually associated with previous penetrating atheromatous ulcers, aortic surgery, trauma, or infections (Fig. 2-37).
Most patients with TAAs are asymptomatic at the time of diagnosis, because the aneurysms are typically discovered incidentally on imaging studies (chest radiograph, CT, or echocardiogram) ordered for other indications (125). Aneurysms of the root or ascending aorta may produce secondary aortic regurgitation, so a diastolic murmur may be detected on physical examination or, less often, patients may present with congestive heart failure. Patients with aneurysms at the level of the sinus of Valsalva that rupture may present with heart failure or a new murmur. When TAAs are large, patients may suffer a local mass effect, such as compression of the trachea or mainstem bronchus (causing cough, dyspnea, wheezing, or recurrent pneumonitis), compression of the esophagus (causing dysphagia), compression of the recurrent laryngeal nerve (causing hoarseness), or compression of the great veins (plethora). Rarely, chest or back pain may occur with nondissecting aneurysms as a result of direct compression of other intrathoracic structures or erosion into adjacent bone.
The overall incidence of TAAs from a large autopsy series over a 27-year period was 489 per 100,000 men and 437 per l00,000 women (126). This study also demonstrated an increasing prevalence of asymptomatic thoracic aneurysms with advancing age. Aneurysmal disease often is multifocal or diffuse; up to 28% of patients with thoracic aneurysms have concomitant infrarenal AAAs, making evaluation of the entire aorta mandatory in patients presenting with nontraumatic thoracic aneurysms (123, 127).
 Figure 2-37 Ascending aortic pseudoaneurysm resulting from prior mediastinitis complicating previous aortic surgery. A: Axial electrocardiogram-triggered T1-weighted SE MR image shows pseudoaneurysm arising from the anterior portion of the ascending aorta (long arrow) and associated thrombus or granulation tissue (short arrow). B: Oblique sagittal source image from breath-hold gadolinium-enhanced three-dimensional MR angiogram demonstrates the larger superior pseudoaneurysm (long arrow) and the neck of the inferior, smaller pseudoaneurysm (short arrow). |
The most serious complication of aneurysmal disease of the thoracic aorta is death from rupture, the incidence of which varies from 42% to 70% depending on the series (128). Davies et al. (124) reported on the yearly rupture or dissection rates in 721 patients with TAA. A total of 304 patients were dissection free at presentation; their natural history was followed up for rupture, dissection, and death. Patients were excluded from analysis once operation occurred. Not surprisingly, the authors reported that aneurysm size had a profound impact on outcomes; the cumulative risk of rupturing a TAA is related to aneurysm diameter. For example, based on their modeling, a patient with an aneurysm exceeding 6 cm in diameter can expect a yearly rate of rupture or dissection of at least 6.9% and a death rate of 11.8%. Although the mean rate of growth of thoracic aneurysms was only 0.1 cm/year in this series, the growth rate varied by location. The serial growth rate was greater for aneurysms of the descending aorta versus ascending aorta, was greater for dissected aneurysms versus nondissected ones, and was greater for those with Marfan syndrome versus those without. In another recent series of 133 patients with TAA, risk of rupture at 5 years was 0% for aneurysms with a diameter less than 4 cm, 16% for those with a diameter of 4 to 5.9 cm, and 31% for aneurysms greater than 6 cm in diameter (129). Another study with 1,600 patients with TAA showed a 31% risk of rupture or dissection for ascending aortic aneurysms at a diameter of 6 cm and 43% for descending TAAs at a diameter of 7 cm (130). This author recommends elective repair of ascending aneurysms at 5.5 cm and descending aneurysms at 6.5 cm for patients without any familial disorders such as Marfan syndrome. Patients with Marfan syndrome or familial aneurysms should undergo earlier repair, when
the ascending aorta grows to 4 to 5 cm or the descending aorta grows to 5 to 6 cm (130).
the ascending aorta grows to 4 to 5 cm or the descending aorta grows to 5 to 6 cm (130).
 Figure 2-38 Ascending aortic aneurysm with involvement of the sinus segment in a patient with cystic medial necrosis. Oblique sagittal black blood half-Fourier single shot turbo-SE (HASTE) image performed with electrocardiogram triggering (TR/TE = 800 ms/42 ms) (A) and oblique sagittal source image from breath-hold gadolinium-enhanced three-dimensional (3D) MR angiogram (B) demonstrate the tulip-shaped aortic root characteristic of cystic medial necrosis. Note the smooth tapering to a relatively normal aortic arch. C: Oblique sagittal maximum intensity projection image from breath-hold gadolinium-enhanced 3D MR angiogram better shows the full extent of the normal great vessels, but overlapping chambers preclude evaluation of the aortic root. |
Measuring the size of TAA from axial MDCT and MR imaging studies is not an exact science, and both interobserver (131) and intraobserver variability exist. These errors occur most commonly at the aortic root and in tortuous arch and descending TAAs, where size may be under- or overestimated. Recently, both automated and semiautomated techniques have become available to determine a true short axis measurement of an aneurysm. Without these techniques a double oblique orthogonal image can usually be obtained accurately at a workstation when using a 3D dataset. Although MR has been the preferred technique to evaluate the size of the aortic root due to motion-related artifacts with MDCT, the use of retrospective ECG gating with 16- and 64-slice CT has rendered this technique better than MR. Some authors advocate using relative aortic size controlled for body surface area information (the “aortic size index”). In one recent study, increasing aortic size index was a significant predictor of increasing rates of rupture as well as the combined endpoint of rupture, death, or dissection (132). These authors believe that relative aortic size is more important than absolute aortic size in predicting complications and allows for the stratification of patients into three levels of risk, enabling appropriate surgical decision making.
Prior to the use of automated or semiautomated volumetric techniques, a longitudinal CT study demonstrated growth rates of 0.42 cm/year for thoracic aneurysms and 0.56 cm/year for aneurysms involving the aortic arch (133); these expansion rates are faster than those reported for AAAs. As with AAAs, the size at presentation can be used to stratify the cohort at risk for rupture; the cumulative 5-year risk of rupture increases fivefold for thoracic aneurysms greater than 6 cm in diameter.
 Figure 2-39 Ascending aortic aneurysm—value of electrocardiographic (ECG) gating to minimize cardiac motion. See Color Figure 2-39E. Axial source (A), coronal (B), and sagittal (C) reformatted images from 16-slice CT angiography (CTA) performed without ECG gating demonstrate fusiform dilatation of the ascending aorta, with relative sparing of the sinus segment (arrow in B) and extension into the transverse arch. Note the extensive artifact from cardiac motion. Axial (D) and oblique sagittal volume-rendered (E) images from another patient with ascending aortic aneurysm involving the left coronary sinus (arrow in D) performed with ECG gating show the precise relationship of coronary arteries to aneurysm (arrows in E). |
The operative technique for aortic aneurysms, as with dissection of the aorta, depends on the extent of involvement. Previously, conventional angiography was required for preoperative planning, but ECG-gated MDCT or a combination of MR techniques can supply more information, including the ability to evaluate the coronary arteries in patients with aneurysms involving the aortic root (134) and the intercostal arteries that supply the spinal cord in patients with descending thoracic and thoracoabdominal aneurysms (135, 136, 137). These techniques can readily evaluate aortic size, mural disease, thrombus, and the proximal and distal extent of aneurysms. The last is extremely important, as this dictates the operative approach and technique used. For aneurysms involving the ascending aorta, the type of proximal repair is determined by whether or not the sinotubular ridge and aortic valve are compromised, and the distal extent may determine the need for hypothermic circulatory arrest. If the distal ascending aorta is not aneurysmal or diseased and the aortic root is relatively normal, then simple aortic cross clamping with cardiopulmonary bypass without hypothermic circulatory arrest may be performed. In distinction, if the aneurysm extends to within 1 cm of the innominate artery, involves the aortic arch, or is associated with extensive atheromatous plaque, then hypothermic
circulatory arrest with antegrade cerebral perfusion is commonly performed.
circulatory arrest with antegrade cerebral perfusion is commonly performed.
The morphology of aneurysms of the ascending aorta and aortic arch is predictable based on the disease process. Typically, patients with cystic medial necrosis (regardless of the etiology) will have aneurysmal involvement of the sinuses of Valsalva with smooth tapering to a normal-sized aortic arch. This results in the classic tulip- or pear-shaped aorta seen in patients with Marfan syndrome, Turner syndrome, Ehlers-Danlos syndrome (Fig. 2-38), bicuspid aortic valve, or familial TAA syndrome with cystic medial degeneration (125). In contrast, atherosclerotic or degenerative aneurysms usually spare the sinus segment but extend into the transverse arch (Fig. 2-39). Aneurysms related to aortic stenosis may have a peculiar appearance with the greatest diameter at the level of the turbulent aortic jet (Fig. 2-40).
The distinction is not always so clear cut, as atherosclerotic aneurysms may also involve the sinus segment (Fig. 2-41), especially when associated with aortic regurgitation. However, they will almost never demonstrate the complete effacement of the sinotubular junction seen with cystic medial necrosis.
Crawford Classification
Descending TAAs originate beyond the left subclavian artery and may extend into the abdomen. Crawford devised a classification system that includes both aneurysms and chronic dissections based on length and location of disease and relative risk of paraplegia (138). Type I involves the descending thoracic aorta from the left subclavian artery to the suprarenal aorta. Type II extends from the left subclavian artery to below the renal arteries and may continue distally to the aortic bifurcation. Type III begins at the mid-to-distal descending thoracic aorta and involves most of the abdominal aorta as far distal as the aortic bifurcation. Type IV (also a suprarenal AAA) extends from the upper abdominal aorta and all or none of the infrarenal aorta. Descending TAAs may compress or erode into surrounding structures, including the trachea, bronchus, esophagus, vertebral body, and spinal column.
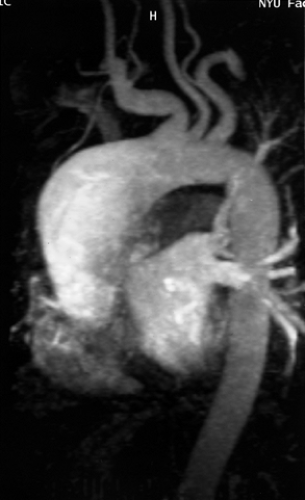 Figure 2-40 Ascending aortic aneurysm with relative sparing of the sinus segment due to congenital aortic stenosis. Oblique sagittal maximum intensity projection image from breath-hold gadolinium-enhanced three-dimensional MR angiogram demonstrates dilatation predominantly involving the anterior wall of the ascending aorta, with some involvement of the sinus segment, without extension into the mid transverse arch. The unusual morphology of the aneurysm is due to the lifelong jet through a stenotic valve in a patient with congenital aortic stenosis. |
For thoracoabdominal aneurysms it is essential that imaging includes a complete evaluation of the renal and visceral vessels, as aneurysmal involvement or occlusive disease may alter surgical management (Fig. 2-42). These aneurysms invariably contain thrombus and at times may be difficult to distinguish from chronic, thrombosed aortic dissections. The presence of a sharp, spiraling interface with compression of the patent lumen and extension over a 7-cm segment points to the latter diagnosis (Fig. 2-43). Displaced intimal calcifications also favor a chronic thrombosed aortic dissection.
Complete replacement of the thoracic aorta may be necessary in aneurysms that involve the ascending aorta, aortic arch, and proximal descending aorta (Figs. 2-7 and 2-44). This can be performed in a single operation or as a two-stage procedure (139) using an “elephant trunk” technique (see Postoperative Aorta). Because patients who have undergone repair of thoracic aneurysms are at risk for a second noncontiguous aneurysm (123), as well as anastomotic pseudoaneurysms, they require follow-up surveillance imaging.
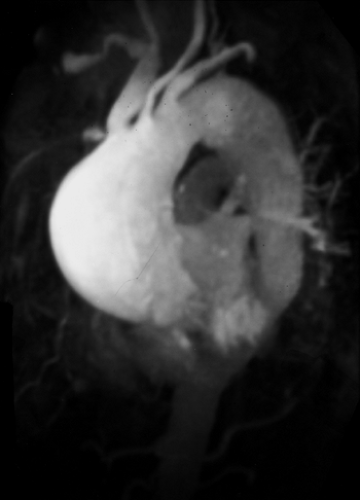 Figure 2-41 Atherosclerotic ascending aortic aneurysm with some dilatation of the sinus segment. Oblique sagittal maximum intensity projection image from breath-hold gadolinium-enhanced three-dimensional MR angiogram demonstrates fusiform dilatation of the ascending aorta, with some involvement of the sinus segment, which extends into the transverse arch. This patient had significant aortic regurgitation. Note the concomitant proximal descending aortic aneurysm. Involvement of the transverse arch is characteristic of atherosclerotic or senescent aortic aneurysms. Because of the aortic arch involvement, surgical repair would require hypothermic circulatory arrest. |
Imaging Features
Computed Tomography Evaluation
Early CT literature using nonhelical scanning demonstrated high accuracy rates for the diagnosis of thoracic aneurysms and their complications (140, 141, 142, 143, 144, 145, 146, 147, 148, 149). Contrast-enhanced MDCT can demonstrate all the gross pathologic features of aortic aneurysms, including dilatation, extraluminal thrombi, displacement or erosion of adjacent structures
(Fig. 2-45), and perianeurysmal thickening and hemorrhage (140, 141, 142, 143, 144, 145). CT has also proven valuable in detecting unusual types of aneurysms, including mycotic (Fig. 2-46) and ductus aneurysms (Fig. 2-47), as well as complications arising from aneurysms, including those secondary to rupture (145, 146, 147, 148, 149). CT also plays an important role in distinguishing TAAs from pulmonary masses adjacent to the mediastinum.
(Fig. 2-45), and perianeurysmal thickening and hemorrhage (140, 141, 142, 143, 144, 145). CT has also proven valuable in detecting unusual types of aneurysms, including mycotic (Fig. 2-46) and ductus aneurysms (Fig. 2-47), as well as complications arising from aneurysms, including those secondary to rupture (145, 146, 147, 148, 149). CT also plays an important role in distinguishing TAAs from pulmonary masses adjacent to the mediastinum.
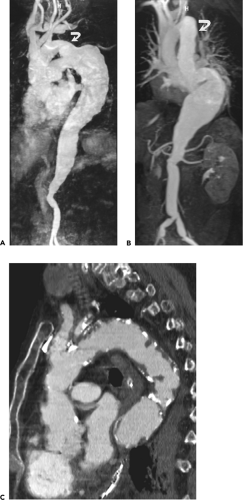 Figure 2-42 Thoracoabdominal aneurysms. Oblique sagittal maximum intensity projection images from non–breath-hold (A) and breath-hold (B) gadolinium-enhanced three-dimensional MR angiograms demonstrate thoracoabdominal aneurysms with sufficient proximal necks for cross clamping (curved arrows). Poor visualization of the renal and visceral vessels in (A) results from a combination of severe renal insufficiency and the known limitations of evaluation of branch vessels using a non–breath-hold technique. C: Oblique sagittal reformatted image from multidetector CT (MDCT) in a third patient demonstrates similar findings. |
Thoracic aneurysms secondary to atherosclerosis are readily demonstrated as fusiform dilatation of a segment of the aorta, which usually contains mural thrombus, and may demonstrate calcification of the thrombus or the aortic wall (Fig. 2-48). The pattern of mural thrombi and calcifications within aortic aneurysms has been described (146, 147). Calcification within aneurysms is common, occurring in up to 85% of cases, both mural (Fig. 2-45) and within the thrombus itself. The latter type of calcification has been reported to occur in approximately 25% of patients with both thoracic and abdominal aortic calcifications (147). The significance of calcification within thrombi is that this appearance can be mistaken for the displaced intimal calcification seen in aortic dissection and IMH.
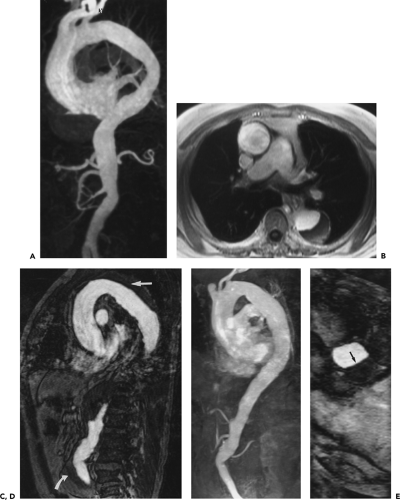 FIG. 2-43. Thoracoabdominal aneurysm with thrombus and chronic thrombosed type B dissection (A and B). Oblique sagittal maximum intensity projection (MIP) image from breath-hold gadolinium-enhanced three-dimensional MR angiogram (A) and axial, breath-hold gradient-echo image (B) performed immediately after (A) demonstrate crescentic thrombus in the descending thoracic aorta, without mass effect on the lumen. Findings are most consistent with a thoracoabdominal abdominal aneurysm. C–E: Chronic thrombosed dissection with aneurysmal dilatation of false lumen. C: Oblique sagittal source image from non–breath-hold gadolinium-enhanced three-dimensional MR angiogram shows low signal intensity thrombus (arrow) with sharp luminal interface, typical for thrombosed dissection. Note secondary aneurysm formation in the abdominal aorta (curved arrow). D: MIP image is deceptively normal appearing. E: Axial reformation from same dataset better demonstrates the sharp interface (arrow) between the enhanced true lumen and the thrombosed false lumen. (From Krinsky G, Weinreb J. Gadolinium enhanced three-dimensional MR angiography of the thoracoabdominal aorta. Sem Ultrasound CT MR. 1996;17:280–303 , with permission.) |
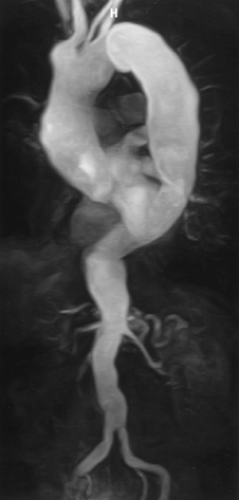 Figure 2-44 Oblique sagittal maximum intensity projection image from breath-hold gadolinium-enhanced three-dimensional MR angiogram demonstrates aneurysmal dilatation of the entire thoracic aorta (mega-aorta). (From reference 29, with permission.) |
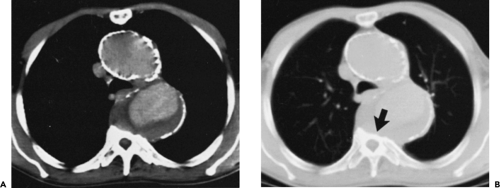 Figure 2-45 A, B: Long-standing thoracic aortic aneurysm resulting in bone erosion. Contrast-enhanced CT scans at the same level imaged with narrow and wide windows, respectively. There is dense calcification of the walls of both the ascending and descending aorta. An aneurysm is present within the proximal descending aorta, with considerable surrounding thrombus. The adjacent vertebral body has been significantly eroded (arrow in B). |
Aortic thrombi may be crescentic (Fig. 2-49) or circumferential, in which case the residual lumen appears circular. As a rule, the residual aortic lumen is smooth, although the aortic lumen may develop a very irregular contour, especially in large aneurysms, depending on the extent of thrombus (Fig. 2-48). Unlike IMHs (which are discussed later), thrombus is often circumferential and does not displace a calcified intima. When the thrombus forms a sharp margin with the enhanced lumen, and no displaced intimal calcifications are present, it may be difficult to distinguish a thoracic aneurysm from a chronic aortic dissection with a thrombosed false lumen.
CT can be used to follow up aneurysms, although this involves repeated use of intravenous contrast and ionizing radiation not inherent in MR. An increasing diameter is readily detected with serial scans and helps prompt a surgical decision. CT may also have value in assessing patients with iatrogenic pseudoaneurysms, which may occur following aortic valve replacement, cardiopulmonary bypass, or coronary artery bypass grafting.
With the introduction of volumetric CT, interest has focused on the potential use of retrospective reconstruction techniques to evaluate aortic aneurysms. Quint et al. (150) evaluated the diagnostic contribution of helical CT with multiplanar reformations in the evaluation of 49 patients with thoracic aortic disease (36 aneurysms, 6 penetrating ulcers, 5 dissections, and 2 pseudoaneurysms). Overall diagnostic accuracy was 92%, both with and without multiplanar reconstructions. Although MPRs were of value by displaying pathology in a format more accessible to nonradiologists, their addition failed to change the diagnosis in any patient (150). Furthermore, whereas in two patients
extension of an aneurysm into the aortic arch necessitating the use of hypothermic circulatory arrest was shown more clearly using MPRs, in a third patient multiplanar reconstructions incorrectly predicted this need.
extension of an aneurysm into the aortic arch necessitating the use of hypothermic circulatory arrest was shown more clearly using MPRs, in a third patient multiplanar reconstructions incorrectly predicted this need.
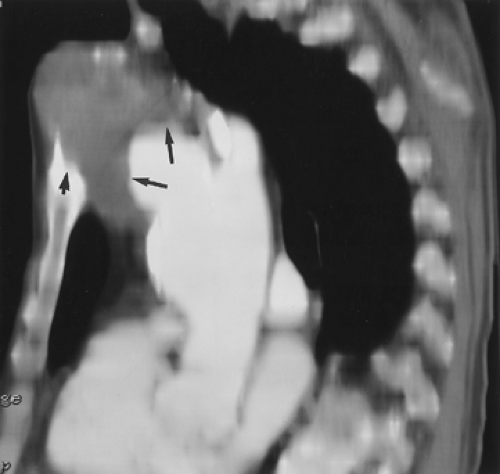 Figure 2-46 Longstanding mycotic aneurysm of the ascending aorta. Sagittal reformation from contrast-enhanced helical CT demonstrates a mycotic aneurysm of the ascending aorta with thrombus (long arrows) that eroded through the sternum (short arrow) to present as a chest wall mass. |
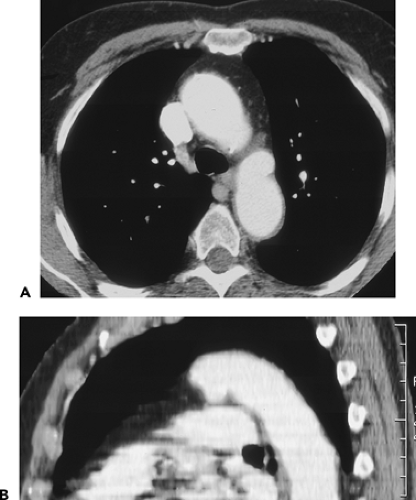 Figure 2-47 A, B: Ductus aneurysm. Axial contrast-enhanced helical CT images with sagittal reformation demonstrate an aneurysm in the region of the ductus arteriosus. |
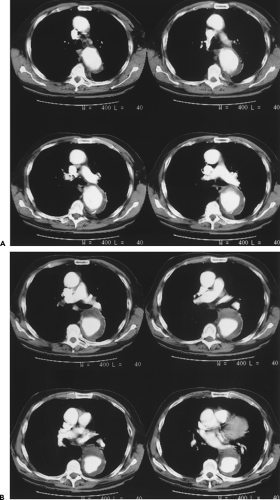 Figure 2-48 A, B: Atherosclerotic thoracic aortic aneurysm. Sequential images (superior to inferior) from contrast-enhanced helical CT demonstrate a fusiform aneurysm of the descending thoracic aorta with irregular, mostly circumferential thrombus. |
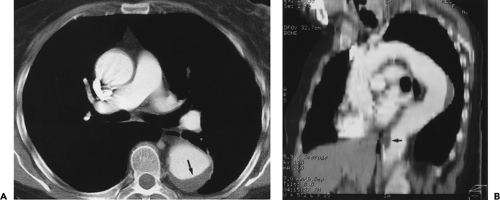 Figure 2-49 A, B: Thoracoabdominal aneurysm with crescentic thrombus. Axial and oblique sagittal reformations from contrast-enhanced helical CT demonstrate crescentic mural thrombus in both the midthoracic aorta (arrow in A) and at the level of the diaphragm (arrow in B). Note the similar morphology in Figure 2-43. |
In distinction, Kimura et al. (151) have shown that both SSD and especially CT angioscopy are superior to axial images for assessing the relationship between distal arch aneurysms and the origin of the great vessels. Comparing
the accuracy of 2D axial source images with SSDs and endoscopic renderings in 12 patients with distal aortic arch aneurysms, these authors found that depiction of the relationship between the aneurysm and the orifice of the left subclavian artery was correct in only 5 (42%) of 12 patients, using axial images; in distinction, using 3D display only, this relationship could be discerned in 9 of the 12 (75%), whereas use of 3D endoscopic renderings allowed accurate assessment in 11 of 12 (92%) patients (151). The reasons for failure of axial images to accurately identify the anatomic relationship between aneurysms and the left subclavian artery included the presence of atheromas obscuring continuity and gradual sloping of the proximal portion of the aneurysm obscuring its precise margin. Of the three renderings, CT angioscopy most clearly delineated the distance between the arterial orifice and the border of the aneurysm.
the accuracy of 2D axial source images with SSDs and endoscopic renderings in 12 patients with distal aortic arch aneurysms, these authors found that depiction of the relationship between the aneurysm and the orifice of the left subclavian artery was correct in only 5 (42%) of 12 patients, using axial images; in distinction, using 3D display only, this relationship could be discerned in 9 of the 12 (75%), whereas use of 3D endoscopic renderings allowed accurate assessment in 11 of 12 (92%) patients (151). The reasons for failure of axial images to accurately identify the anatomic relationship between aneurysms and the left subclavian artery included the presence of atheromas obscuring continuity and gradual sloping of the proximal portion of the aneurysm obscuring its precise margin. Of the three renderings, CT angioscopy most clearly delineated the distance between the arterial orifice and the border of the aneurysm.
An even more compelling use of CT for evaluating aortic aneurysms has been reported by Rubin et al. (152, 153). Using helical CT angiographic data, these authors demonstrated that it is possible to automatically derive accurate quantitation of arterial cross sections, segment lengths, and absolute curvature by continuously describing variations in cross-sectional dimensions and as a function of position along the median vessel path. Previously limited, especially in patients with markedly tortuous aortas, use of quantitative vascular CT should now allow more accurate assessment of longitudinal changes in aortic dimensions with time, as well as more accurate treatment planning, especially in those cases for which endoluminal stent-grafts are planned. This is in addition to the already well established role of CT in pre- and postoperative evaluation of patients with both surgical and endovascular stent-graft repair of TAAs (154, 155, 156, 157, 158).
In our experience, the extent of aortic aneurysms, and in particular their relationship to adjacent structures, are better visualized using either MPRs, curved MPRs, or 3D renderings. In this regard, the use of MIPs to delineate the exact location of calcification may be of particular value in assessing the necks of aneurysms.
CT does have some recognized limitations in the evaluation of aneurysmal disease, aside from the risks of iodinated contrast and radiation. Evaluation of the aortic root is often difficult secondary to motion artifacts unless ECG gating is performed (Fig. 2-39). Many patients with advanced aneurysmal disease often have concomitant renal insufficiency; however, with a 64-detector CT, optimized timing, and judicious use of a saline flush, adequate studies can be performed with as little as 50 mL of contrast. Gadolinium chelates have been successfully used for CTA as an alternative to iodinated contrast (159, 160), but the high dose needed for a diagnostic quality scan (0.4 mg/kg) is much more expensive than nonionic iodinated contrast and has recently been linked to a rare kidney disease.
Stay updated, free articles. Join our Telegram channel

Full access? Get Clinical Tree


