More adults than children with congenital heart disease (CHD) are alive today. Few studies have evaluated adult congenital heart disease (ACHD) health care utilization in the United States. Data from the National Inpatient Sample from 2002 to 2012, using International Classification of Diseases, Ninth Revision , codes for moderate and complex CHD were analyzed. Hospital discharges, total billed and reimbursed amounts, length of stay, and gender/age disparities were evaluated. There was an increase in CHD discharges (moderate CHD: 4,742 vs 6,545; severe CHD: 807 vs 1,115) and total billed and reimbursed dollar amounts across all CHD (billed: $2.7 vs $7.0 billion, 155% increase; reimbursed: $1.3 vs $2.3 billion, 99% increase) and in the ACHD subgroup (billed: $543 million vs $1.5 billion, 178% increase; reimbursed: $221 vs $433 million, 95% increase). Women comprised more discharges in 2002 but not in 2012 (men:women, 2002: 6,503 vs 7,805; 2012: 7,715 vs 7,200, p = 0.39). Gender-based billed amounts followed similar trends (2002: $263 vs $280 million; 2012: $845 vs $662 million, p = 0.006) as did reimbursements (2002: $108 vs $114 million; 2012: $243 vs $190 million, p = 0.008). All age subgroups demonstrated increased health care expenditures, including the >44 versus 18- to 44-year-old age subgroup (billed: $618 vs $347 million, p <0.001; reimbursed: $136 vs $75 million, p <0.001). Our results reveal increased ACHD billed and reimbursed amounts and hospital discharges with a shift in gender-based ACHD hospitalizations: men now account for more hospitalizations in the United States. In conclusion, increased health care expenditure in older patients with ACHD is likely to increase further as health care system use and costs continue to grow.
The overall profile of congenital heart disease (CHD) in the United States (US) has shifted strikingly in the last several decades whereby childhood survival has increased from <20% in 1950 to >90% in the modern era. Current data suggest that there are now more adults than children with CHD, an observation that foreshadows the future growth of the adult congenital heart disease (ACHD) population in the US. There are very few studies that provide a global assessment of ACHD health care use and expenditure in the US as it relates to social, demographic, and health characteristics. Defining the overall utilization rate and health care dollar expenditure accounted for by the ACHD population is the first step required to prospectively strategize how this need can be accommodated for in an already congested health care system. We aim to define current ACHD health care resource utilization and expenditure in the US as it relates to demographic characteristics and hospitalization rates.
Methods
We analyzed data from the National Inpatient Sample (NIS) from 2002 to 2012. These data are a subset of the Healthcare Cost and Utilization Project sponsored by the Agency for Healthcare Research and Quality and provides stratified, sample designed data both nationally and regionally. National estimates are produced by the use of sampling with weight-based hospital-specific information, and although limited administrative data are available, its size and sampling frame allow for analysis of relatively rare clinical data on a national level. The study was approved by the Montefiore Medical Center institutional review board.
All patients admitted to an inpatient facility with an International Classification of Diseases, Ninth Revision ( ICD-9 ), diagnosis code designating a congenital cardiac defect were queried; these codes were included in Clinical Classifications Software (CCS) code 213 (cardiac and circulatory congenital anomalies). Discharge numbers, total billed charges, and reimbursement data were generated from CCS code 213 for all CHD diagnoses. Each ICD-9 code was categorized as moderate or great (severe) complexity based on the Thirty-Second Bethesda Conference Report ( Table 1 ). Data for CHD diagnoses that were not moderate or great complexity are included in CCS analyses but not ICD-9 –specific analyses. Data were obtained with the revised sampling weights using sampling data from all hospitals participating in Healthcare Cost and Utilization Project within the NIS databases in 2014. In an effort to accurately identify all CHD admissions and services, we specifically sought coding information reflective of underlying CHD. In so doing, if CHD diagnoses were not coded, they were not included in the analysis. Although not optimal, it is the only way to definitively define all recognized/coded CHD charges.
| Moderate Complexity | Severe (Great) Complexity |
|---|---|
| Tetralogy of Fallot | Truncus Arteriosus |
| Endocardial Cushion Defect NOS | d-Transposition of the Great Arteries |
| Ostium Primum Defect | Double Outlet Right Ventricle |
| Endocardial Cushion Defect NEC | l-Transposition of the Great Arteries |
| Congenital Pulmonary Valve Stenosis | Single Ventricle |
| Ebstein’s Anomaly | Congenital Pulmonary Valve Atresia |
| Congenital Aortic Valve Stenosis | Tricuspid Atresia |
| Congenital Mitral Valve Regurgitation | Hypoplastic Left Heart Syndrome |
| Congenital Mitral Valve Stenosis | |
| Coarctation of Aorta | |
| Partial Anomalous Pulmonary Venous Return |
The total CHD population was analyzed irrespective of age, and subgroup analysis was conducted on patients with ACHD. Comparative analysis was performed on national data in 2002 and 2012, representing a 10-year interval with most available noncensored statistics. Of the great complexity ICD-9 code diagnoses listed in Table 1 , those with discharge data available in both 2002 and 2012 were analyzed longitudinally ( d -transposition of the great arteries, l -transposition of the great arteries, truncus arteriosus, and tricuspid atresia). Of the moderate complexity ICD-9 code diagnoses listed in Table 1 , all had discharge data present both in 2002 and 2012 except congenital aortic valve insufficiency, congenital mitral stenosis, and partial anomalous pulmonary venous return, which were censored from the analysis. For 2012 discharge analysis, all ICD-9 code diagnoses in Table 1 were used. The ICD-9 codes for CHD without specific designation were also analyzed despite lack of specific Bethesda Conference classification (746.89, other specified congenital anomalies of heart and 746.9, unspecified congenital heart anomaly).
We analyzed hospital discharges and total billed/reimbursed amounts in the earlier described cohort. Discharge, length of stay, gender, age, total billed, and total reimbursed data are generated when the principal discharge diagnosis is contained within CCS code 213 and from principal discharge diagnosis for specific ICD-9 codes; specific discharges examined in the year 2012 were data based on all listed discharge diagnoses from the NIS database. We define total billed as the sum of charges for all hospital stays in the US billed to a payer (private or public), reflecting aggregate charges in the NIS. We define total reimbursed as the sum of costs for all hospital stays that were actually reimbursed to the hospital, reflecting aggregates costs in the NIS. These values do not reflect increases from inflation. In the case where a single patient was admitted to the hospital multiple times (>1 admission) in 1 year, each hospitalization was separately analyzed. When missing information on billing or reimbursement occurred, a value was imputed by NIS software by taking the mean charges (mean imputation) for all discharges of the same diagnosis-related group with nonmissing charges, which occurred <2% of the time. We also evaluated length of stay in days when the primary diagnosis was related to underlying CHD and performed gender and age subgroup analysis irrespective of reason for admission. Predetermined cohorts (specified by the format of the NIS data set) related to age were further analyzed as subgroups: 18 to 44 years, 45 to 64, 65 to 84, and >85.
The population-based number of patients with moderate and great complexity CHD in the US from 2002 to 2012 was estimated using sample-weighted data in the NIS database. Continuous data are presented as summed values ± standard error of the mean. Continuous variables were analyzed with independent 2-tailed Student’s t tests to look at between-group changes and with paired t tests when evaluating within-group changes over time. Categorical variables are presented as percentages. Two-tailed p value <0.05 was considered statistically significant. All analyses were conducted with SAS, version 9.4 (SAS Institute Inc., Cary, North Carolina) statistical software.
Results
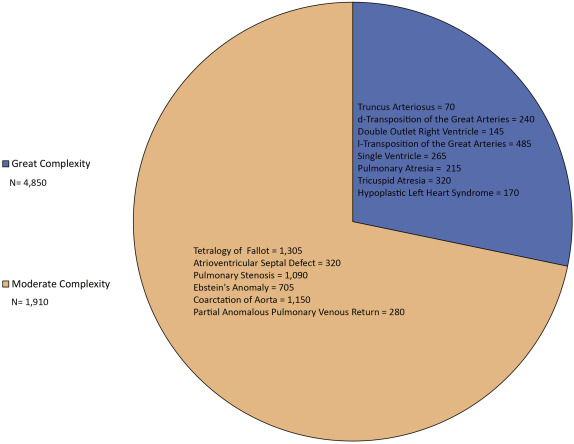
From 2002 to 2012, total discharges for all CHD patients (CCS subgroup 213) increased (38,280 vs 40,410) as did those for patients with ACHD (14,307 vs 14,915) ( Figure 1 ) whereas national discharges were relatively unchanged (36.52 vs 36.48 million). Nonspecific CHD ICD-9 billing codes were the primary diagnosis in 6% of total discharges in 2012, and during the study time frame, there was a 72% (5,524 vs 9,485) increase in discharges using these codes. Moderate and great complexity ACHD discharges increased by 38% (moderate: 4,742 vs 6,545 and great complexity: 807 vs 1,115, respectively) during the observed time frame ( Figure 1 ). The total number of discharges for each type of moderate and complex ACHD lesion in 2012 is shown in Figure 2 .


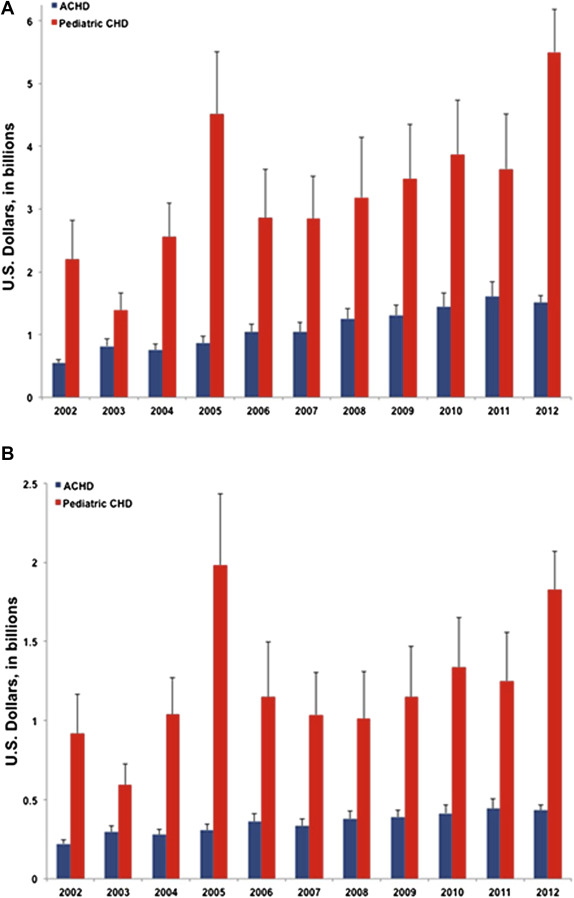
The overall billed amount for the entire cohort (all ages) increased by 155% from 2002 to 2012 ($2,744,275,127 vs $7,005,610,598). The total reimbursed for the same group increased 99% over the study period. Within the ACHD subgroup, total billed charges increased by 178% from 2002 to 2012; a similar (95%) increase in ACHD reimbursement was seen over the same time frame ( Figure 3 ). For total billed and total reimbursed amounts within the US for all inpatients, increases of 113% and 51% were reported, respectively.

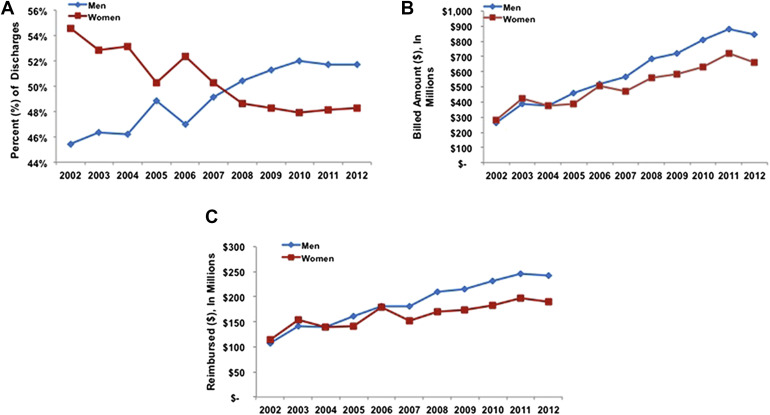
In 2002, female CHD patient discharges were more frequent (men:women 6,503 vs 7,805); however, this relation shifted with male predominance by 2012 (7,715 vs 7,200, p = 0.39) ( Figure 4 ). In the 45- to 64-year-old subgroup, 48% of the discharges in 2002 were for men compared with 55% in 2012. The overall total billed for men versus women followed similar suit from 2002 ($262,918,357 vs $279,785,604) to 2012 ($844,923,857 vs $662,021,185, p = 0.006) ( Figure 4 ) as did total reimbursement from 2002 ($107,766,175 vs $113,651,604) to 2012 ($243,183,638 vs $189,613,905, p = 0.008) ( Figure 4 ).


