Hakki’s formula (simplified Gorlin formula) can be used during cardiac catheterization to calculate the stenosed cardiac valve areas and can also be adapted to magnetic resonance imaging (MRI) to measure the stenosed cardiac valve areas. We evaluated the reliability of this approach to determine the severity of aortic stenosis compared to the continuity equation using transthoracic echocardiography and planimetry using MRI. We included all eligible symptomatic patients with known aortic stenosis referred to our department during a 1-year period. The aortic valve area (AVA) was estimated using Hakki’s formula (MRI), planimetry (MRI), and the continuity equation (transthoracic echocardiography). The agreement among the measurement methods was analyzed using the Bland-Altman method. A total of 63 patients were included (mean age 72 ± 10 years, 35 men [56%]). The mean AVA was 0.70 ± 0.21 cm 2 using the continuity equation (transthoracic echocardiography), 0.67 ± 0.18 cm 2 using planimetry (MRI), and 0.64 ± 0.21 cm 2 using Hakki’s formula (MRI). The mean difference was 0.03 cm 2 (95% limits of agreement −0.32 to 0.25) between planimetry and the continuity equation, 0.05 cm 2 (95% limits of agreement −0.40 to 0.29) between Hakki’s formula and the continuity equation, 0.02 cm 2 (95% limits of agreement −0.20 to 0.25) between Hakki’s formula and planimetry. The inter- and intraobserver reproducibility using Hakki’s formula was excellent. In conclusion, measurement of the AVA using Hakki’s formula yielded similar results to those obtained using planimetry and slightly different ones from those obtained using the continuity equation. However, Hakki’s formula has the advantage of being easy to use, fast, and reproducible and can be used regardless of the status of the valve (in contrast to planimetry).
The Gorlin formula can be used for the evaluation of the aortic valve area (AVA), usually during cardiac catheterization. Published data have reported a good correlation among the Gorlin formula, the continuity equation, and planimetry using both transthoracic echocardiography (TEE) and magnetic resonance imaging (MRI) to evaluate the AVA. The Gorlin formula states that the AVA is equal to the flow through the aortic valve during ventricular systole divided by the systolic pressure gradient across the valves according to the following equation : valve area (cm 2 ) = cardiac output (ml/min)/heart rate (beats/min) × systolic ejection period (seconds) × 44.3 × √gradient (mm Hg).
The Hakki equation is a simplified version of the Gorlin equation, which relied on the observation that the product of the heart rate, systolic ejection period, and constant is often approximately 1,000 8 : aortic valve area (cm 2 ) = cardiac output (L/min)/√gradient (mm Hg).
The AVA can, therefore, be evaluated with the measured cardiac output and pressure gradient estimated by the peak velocity, both of which can be obtained by phase-contrast MRI techniques. The aim of the present study was to evaluate the reliability of Hakki’s formula with MRI to determine the severity of aortic stenosis compared to measurements obtained from the continuity equation with transthoracic echocardiography and planimetry with MRI.
Methods
We conducted a retrospective agreement study in which we included all symptomatic patients with known aortic stenosis (documented by TTE) referred to our department during a 1-year period. To be included, each patient was required to be aged >18 years, to have severe aortic stenosis, clinically symptomatic (dyspnea, syncope, chest pain, and/or heart failure), and to be clinically stable. Patients were excluded if they were clinically unstable or had contraindications for MRI (i.e., metallic implant, severe claustrophobia, pacemaker, cardiac valvular prostheses, rapid uncontrolled arrhythmia >100 beats/min). Patients with aortic regurgitation were not excluded. The local institutional review board approved the protocol.
For each patient, the AVA was estimated using Hakki’s formula (MRI), planimetry (MRI), and the continuity equation (TTE). The left ventricular (LV) ejection fraction was evaluated with TTE and MRI using Simpson’s method. The data were processed off-line by an independent observer who was unaware of the results of other observers.
Two-dimensional TTE images were acquired using an IE 33 imager (Philips, Andover, Massachusetts), with a 2.5-MHz phased-array transducer, in standard imaging windows. Doppler flow data were acquired from the LV outflow tract (LVOT) region in pulsed wave mode and from the aortic valve in continuous mode in the 5-chamber view. The LVOT diameter was measured from the parasternal long-axis view and then converted to the LVOT area (A LVOT ) according to A = πr 2 . The peak velocities and velocity time integral (VTI) were used to calculate the AVA according to the continuity equation [A valve = A LVOT (VTI LVOT /VTI valve )]. Three measurements were averaged for AVA calculation. Finally, the ejection fraction was also evaluated using TTE (Simpson’s method). Three measurements were averaged for the ejection fraction calculation.
Imaging was performed on a 1.5 T MRI scanner using a cardiac 6-element antenna (Philips Medical System). Steady-state free precession sequences were used during breath holding (true fast imaging with steady state precession; echo time 1.7 ms, repetition time 3.5 ms, 30 frames/heart beat, flip angle 60°, field of view 340 mm). The 2-chamber, 3-chamber, 4-chamber, and short-axis views of the left ventricle were used to provide a qualitative and quantitative assessment of the LV function.
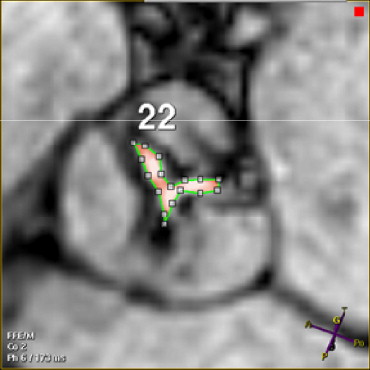
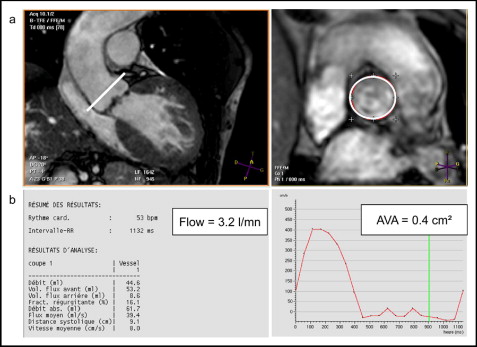
Three views of the LVOT were obtained to evaluate the AVA using MRI: an oblique transverse plane view; an oblique coronal plane view, acquired orthogonally to the outflow tract of the transverse view; and an oblique longitudinal plane view orthogonal to the previous one. The imaging planes for planimetry were then laid out perpendicular to the aortic annulus. The middle imaging plane was positioned on the aortic side of the valve at the greatest excursion (end-systole). Next, 2 other 5-mm sections were obtained parallel to the aortic plane (1 above and 1 below). Delineation of the valve orifice (manual planimetry) was performed manually after magnifying the selected image on an off-line workstation (View Forum, Philips Medical System) by 2 observers. The maximum visible opening in systole was measured twice, and the values were averaged. The signal void due to calcifications found at the edge of the leaflets was counted as a part of the leaflet tissue ( Figure 1 ). Measurement in MRI has been shown to have a high rate of intra- and interobserver reproducibility. Quantitative images were obtained using a free-breathing, retrospectively gated, velocity encoding technique in the through-plane direction (repetition time/echo time/α 5.0 ms/3 ms/15°, 20 frames/heart beat). The view was planned parallel 10 mm above the aortic valve excursion ( Figure 2 ). The maximum encoding velocity was typically 4 m/s in the aorta but was increased if the peak velocity could be predicted to be greater. Flow images were reacquired with correct encoding velocity if velocity aliasing occurred. The regions of interest were drawn on the 20 frames of the cine imaging. We then obtained the maximum speed, the maximum gradient (using the Bernoulli equation), and the volume of systolic ejection. Each measurement was performed twice by 2 experienced operators (blinded). It was also easier to calculate the aortic valve orifice using the Hakki equation (AVA = cardiac flow/√maximum gradient).
The intraclass correlation coefficients were used to assess the inter- and intraobserver reproducibility for the AVA measurements. Values close to 1 (i.e., >0.8) indicated that a single measurement would be satisfactory to classify a patient according to that measurement. Moreover, we computed the within-subject standard deviations—the smaller the within-subject standard deviation, the better the reproducibility. The Bland-Altman method was used to assess the agreement among the different measurement methods. This included the use of a difference plot, with the x axis showing the mean of the results of the 2 methods and the y axis showing the absolute difference between the 2 methods, the calculation of the 95% limits of agreement (average difference ± 1.96 SD of the difference). We defined a priori that a clinically acceptable difference between the 2 methods would be 0.2 cm 2 for the AVA, and we compared the observed 95% limits of agreement regarding this clinically acceptable difference. These analyses were also performed in the subgroups of patients with aortic regurgitation and a LV ejection fraction of ≤50%. Two-tailed p values <0.05 were deemed significant. The analyses were performed using the Statistical Analysis Systems, version 9.1 (SAS Institute, Cary, North Carolina) and GraphPad Prism, version 5, software (San Diego, California).
Results
A total of 63 consecutive patients (mean age 72 ± 10 years, range 44 to 89 years, 35 men [55%]) were included in the present study ( Table 1 ). No patient was excluded because of a contraindication to MRI or the impossibility of performing the examination (TEE or MRI).
| Variable | Patients (n = 63) |
|---|---|
| Age (years) | 72 ± 10 |
| Men | 35 (56%) |
| Associated findings | |
| Aortic regurgitation ⁎ | 35 (56%) |
| Bicuspid aortic valve | 10 (16%) |
| Left ventricular ejection fraction ≤50% | 23 (37%) |
| Atrial fibrillation | 2 (3%) |
Table 2 lists the average AVA measurements obtained with each method. Figure 3 shows the results of the Bland-Altman analyses. The data listed in Table 3 showed that Hakki’s formula and planimetry-based measurements of AVA from MRI were almost interchangeable, with a mean difference of 0.02 cm 2 (95% limits of agreement −0.20 to 0.25 cm 2 ), almost within the a priori limit of 0.2 cm 2 (paired t test, p = 0.11). However, the AVA tended to be greater with these methods than with the continuity equation, with a mean difference between the continuity equation and MRI planimetry measurements of 0.03 cm 2 (paired t test, p = 0.09), and a mean difference between the continuity equation and Hakki’s formula measurements of 0.05 cm 2 (paired t test, p = 0.02). In both cases, the 95% limits of agreement spanned considerably beyond the a priori limit of 0.2 cm 2 . Similar results were found in the subgroups of patient with aortic regurgitation (n = 35) and a low ejection fraction (n = 23; Table 3 ).


