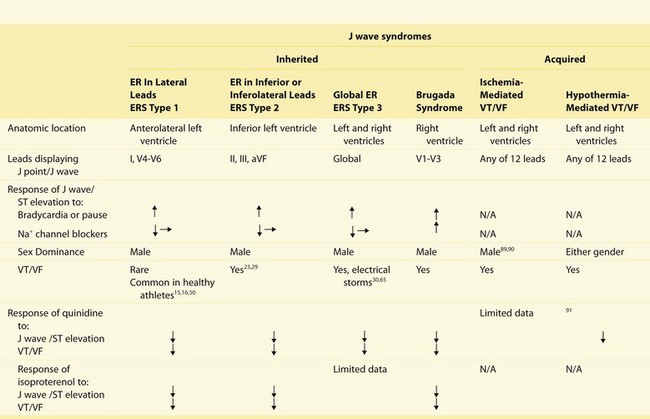
52 The J wave is a positive deflection in the electrocardiogram (ECG) that occurs at the junction between the QRS complex and the ST segment, also known as the J point. Because much of the J wave is typically hidden inside the QRS, it may manifest as a J point elevation, a slurring of the terminal part of the QRS, or a late delta wave following the QRS. When it becomes more accentuated, it may appear as a small secondary R wave (R′) or ST segment elevation (Figure 52-1). Figure 52-1 Cellular Basis for Diversity in the Manifestation of the Early Repolarization Pattern in the ECG The J wave or elevated J point has been recognized in the ECG of humans and animals since the early 1930s. It was first described by Tomaszewski1 in 1938 in an accidentally frozen human. The J wave has also been termed an Osborn wave after Osborn’s description of the wave in hypothermic dogs.2 In both humans and animals, the appearance of a prominent J wave in the ECG is pathognomonic of hypothermia3–5 and hypercalcemia6,7 and, more recently, as a marker for a substrate capable of generating life-threatening ventricular arrhythmias.8 A distinct J wave has been described in the ECG of subjects completely recovered from hypothermia9,10 and those predisposed to idiopathic ventricular fibrillation, but is otherwise rarely observed in humans under normal conditions. A distinct J wave is commonly observed under baseline conditions in the ECG of some animal species, such as dogs and baboons, and is greatly accentuated under hypothermic conditions.11–13 An elevated J point, on the other hand, is commonly encountered in humans and in some animal species under normal conditions. The term early repolarization (ER) to the best of our knowledge was coined by Grant et al14 to describe ST-segment deviations and associated T wave changes and was thought to result from premature repolarization. The ER pattern in the ECG in recent years has been shown to be associated with life-threatening arrhythmias, describing an entity that we termed early repolarization syndrome (ERS). Although Brugada syndrome (BrS) and ERS differ with respect to the magnitude and lead location of abnormal J wave manifestation, they are thought to represent a continuous spectrum of phenotypic expression termed J wave syndromes.8 In this chapter, we discuss the genetic basis for and the cellular and ionic mechanisms underlying J wave syndromes. The clinical aspects are discussed in Chapter 96. An ER pattern in the ECG, consisting of a distinct J wave or J point elevation, a notch or slur of the terminal part of the QRS, and an ST-segment elevation, is commonly seen in healthy young males and until recent years had been viewed as benign.15,16 Our observation in 2000 that an ER pattern in the canine coronary-perfused wedge preparation can readily convert to one in which phase 2 reentry gives rise to polymorphic ventricular tachycardia/ventricular fibrillation (VT/VF) prompted us to suggest that ER in some cases may predispose to malignant arrhythmias in the clinic.8,17,18 A number of case reports and experimental studies have suggested a critical role for the J wave in the pathogenesis of idiopathic ventricular fibrillation (IVF).19–28 A definitive association between ER pattern and IVF was reported in two studies published in New England Journal of Medicine in 2008.29,30 These publications were followed by another study from Viskin and coworkers31 that same year and by large population association studies in 2009 and 2010.32–36 As is discussed in Chapter 96, a number of case-control and population-based studies appeared between 2010 and 2012, confirming the association between ER and IVF. It is interesting to note that recent studies have reported that the prevalence of inferior and anterior, but not lateral, ER is significantly greater among patients who developed VT/VF within 72 h after an acute myocardial infarction.37–40 A strong male predominance is observed with all of the J wave syndromes,8 including BrS.41 Experimental and clinical studies have provided evidence in support of the hypothesis that testosterone plays an important role in ventricular repolarization. Ezaki and coworkers42 demonstrated that ST-segment elevation is relatively small and is similar in males and females before puberty. After puberty, ST-segment elevation in males, but not in females, increases sharply, more so in the right precordial leads, subsequently decreasing gradually with advancing age. The effect of androgen-deprivation therapy on the ST segment was evaluated in 21 prostate cancer patients. Androgen-deprivation therapy significantly decreased ST-segment elevation. These results suggest that testosterone modulates the early phase of ventricular repolarization and thus ST-segment elevation. We recently suggested a classification scheme for ER based on the data available in the literature in 2010 (Table 52-1).8 An ER pattern manifest exclusively in the lateral precordial leads was designated as Type 1; this form is prevalent among healthy male athletes and is thought to be associated with a relatively low level of risk for arrhythmic events. The ER pattern in the inferior or inferolateral leads was designated as Type 2; this form is thought to be associated with a moderate level of risk. Finally, an ER pattern appearing globally in the inferior, lateral, and right precordial leads was labeled Type 3; this form is associated with the highest level of risk and in some cases has been associated with electrical storms.8 Type 3 ER patterns may be very similar to those of Type 2, exhibiting inferolateral ER, except for brief periods just before the development of VT/VF, when pronounced J waves are also observed in the right precordial leads.43 BrS represents a fourth variant in which ER is limited to the right precordial leads. Within each category, the level of risk appears to increase in accordance with the presence of additional electrocardiographic signatures, including a horizontal or declining ST segment following the J wave or J point elevation,35,44,45 relatively short QT intervals,46 and very prominent J waves or J point elevation, which may appear as a coved-type ST-segment elevation (Box 52-1). Risk stratification strategies for BrS and ERS are discussed more fully in Chapter 96. Table 52-1 J Wave Syndromes: Similarities and Differences Modified from Antzelevitch C, Yan GX: J wave syndromes. Heart Rhythm 7:549–558, 2010. Transmural differences in the magnitude of the action potential notch have long been recognized as the basis for inscription of the electrocardiographic J wave.47,48 The ventricular epicardial (Epi) action potential (AP), particularly in the right ventricle outflow tract, displays a prominent transient outward current (Ito)-mediated action potential notch or spike and dome morphology. The presence of a prominent Ito-mediated action potential notch in ventricular epicardium but not endocardium leads to the development of a transmural voltage gradient that manifests as a J wave or J point elevation on the ECG. Direct evidence in support of this hypothesis was first acquired in the arterially perfused canine ventricular wedge preparation,20 as illustrated in Figures 52-1 and 52-2. Modulation of the notch amplitude, whether due to hypothermia (Figure 52-2, C and D) or due to changes in activation rate or to prematurity (Figure 52-3), gives rise to parallel changes in the amplitude of the J wave. Factors that influence Ito kinetics or ventricular activation sequence (Figure 52-2, A, B) can modify the manifestation of the J wave on the ECG. Whether reduced by Ito blockers such as 4-aminopyridine, quinidine, or premature activation; or augmented by exposure to hypothermia, ICa and INa blockers, or Ito agonists such as NS5806 or IK-ATP agonists, changes in the magnitude of the epicardial action potential notch parallel those of the J wave or J point elevation (see Figure 52-1).49–52 Figure 52-2 Effect of Ventricular Activation Sequence and Temperature on the Manifestation of the J Wave in the Pseudo-ECG Recorded for Coronary-Perfused Canine Right Ventricular Wedge Preparations Figure 52-3 Effect of Premature Stimulation on the Relationship Between Epicardial (Epi) Action Potential (AP) Notch (APN) Amplitude and J Wave Amplitude Augmentation of net repolarizing current, whether secondary to a decrease in inward current or an increase in outward current, accentuates the notch leading to augmentation of the J wave or appearance of ST-segment elevation. A further increase in net repolarizing current can result in partial or complete loss of the action potential dome, leading to a transmural voltage gradient that manifests as an accentuated J wave or an ST-segment elevation.18,49,50 In regions of the myocardium exhibiting a prominent Ito, such as the epicardium of the right ventricular outflow tract (RVOT), marked accentuation of the action potential notch leads to a very pronounced J wave, generally referred to as a coved-type or Type 1 ST-segment elevation, which is diagnostic of BrS when it appears in the right precordial leads (Figure 52-4, B). When this pronounced manifestation appears in the inferior or lateral leads, it is sometimes referred to as a variant of BrS, but in our view it is best characterized as a more pronounced manifestation of ER. Figure 52-4 Cellular Basis for Electrocardiographic and Arrhythmic Manifestation of Brugada Syndrome (BrS)
Genetics and Cellular Mechanisms of the J Wave Syndromes
Definition and Clinical Characteristics of the J Wave Syndromes
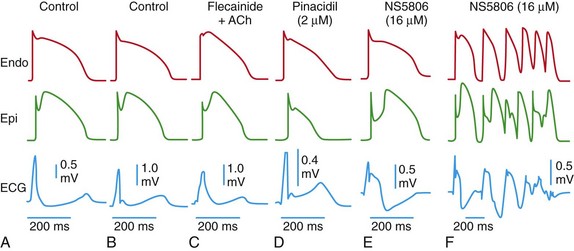
Each panel shows transmembrane action potentials recorded from the epicardial and endocardial regions of an arterially perfused canine ventricular wedge preparation and a transmural electrocardiogram (ECG) simultaneously recorded. Under the conditions indicated, the six panels illustrate the cellular basis for a J point elevation, a distinct J wave, slurring of the terminal part of the QRS, combined J wave and ST-segment elevation, and a very prominent J wave appearing as an ST-segment elevation and giving rise to a brief episode of polymorphic ventricular tachycardia (VT).
Cellular Basis for the J Wave and Associated Arrhythmogenesis
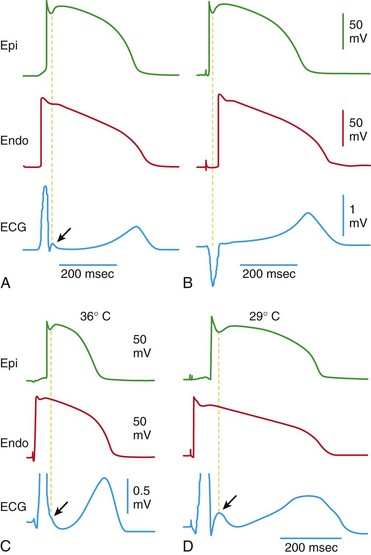
A, When the wedge preparation is stimulated from the endocardial (Endo) surface, a J wave on the electrocardiogram (ECG) is temporally aligned with the Ito-mediated epicardial action potential notch. B, When the preparation is paced from the epicardial surface, the epicardial action potential notch is coincident with the QRS, and a J wave is no longer observed. C and D, Hypothermia-induced J wave. Each panel shows transmembrane action potentials from the epicardial and endocardial regions of an arterially perfused canine left ventricular wedge and a transmural ECG simultaneously recorded. C, Because of the smaller notch in the left ventricular (LV) epicardium, a distinct J wave is not seen under baseline conditions. The small action potential notch in epicardium but not in endocardium is associated with an elevated J point at the R-ST junction (arrow) at 36° C. D, A decrease in the temperature of the perfusate to 29° C results in an increase in the amplitude and width of the action potential notch in epicardium but not endocardium, leading to the development of a transmural voltage gradient that manifests as a prominent J wave on the ECG (arrow). (Modified from Antzelevitch C, Yan GX: J wave syndromes. Heart Rhythm 7:549–558, 2010.)
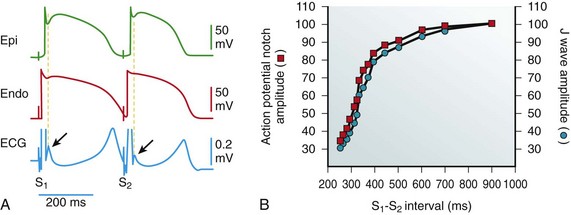
A, Simultaneous recording of a transmural electrocardiogram (ECG) and transmembrane APs from the Epi and endocardial (Endo) regions of an isolated arterially perfused right ventricular wedge. A significant APN in epicardium is associated with a prominent J wave (arrow) during basic stimulation (S1-S2: 4000 ms). Premature stimulation (S1-S2: 300 ms) causes a parallel decrease in the amplitude of Epi APN and that of the J wave (arrow). B, Plot of the amplitudes of the Epi APN (open circles) and the J wave (open squares) as a function of the S1-S2 interval. The amplitude of the Epi APN and that of the J wave are normalized to the value recorded at an S1-S2 interval of 900 ms. (Modified from Yan GX, Antzelevitch C: Cellular basis for the electrocardiographic J wave. Circulation 93:372–379, 1996.)
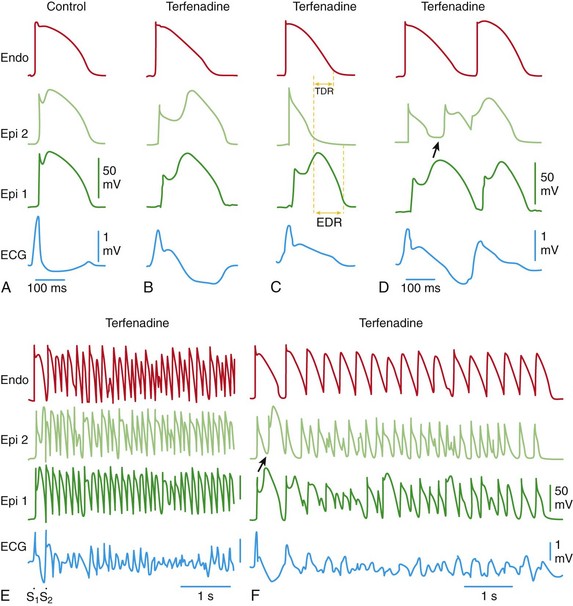
Each panel shows transmembrane action potentials (APs) from one endocardial (Endo) (top) and two epicardial (Epi) sites, together with a transmural electrocardiogram (ECG) recorded from a canine coronary-perfused right ventricular wedge preparation. A, Control (basic cycle length = 400 ms). B, Combined sodium and calcium channel block with terfenadine (5 µM) accentuates the Epi AP notch, creating a transmural voltage gradient that manifests as an exaggerated J wave or ST-segment elevation in the ECG. C, Continued exposure to terfenadine results in all-or-none repolarization at the end of phase 1 at some Epi sites but not others, creating a local Epi dispersion of repolarization (EDR), as well as a transmural dispersion of repolarization (TDR). D,![]()
Stay updated, free articles. Join our Telegram channel

Full access? Get Clinical Tree


Genetics and Cellular Mechanisms of the J Wave Syndromes
