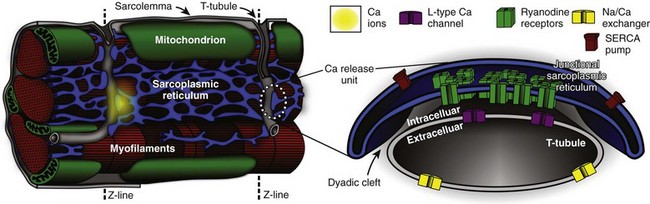
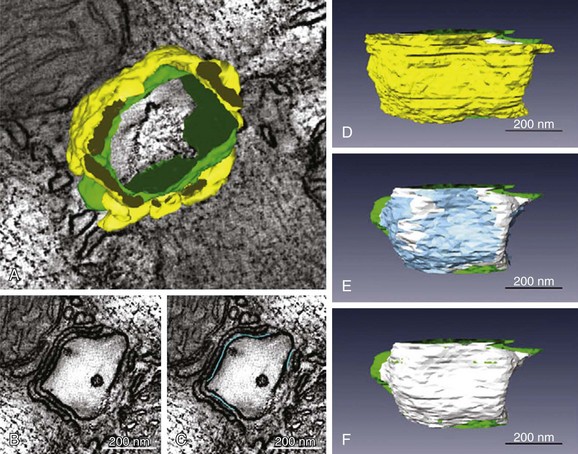
33 The plasma membrane of ventricular myocytes, and of most mammalian striated muscle, exhibits regular invaginations that project into the cell perpendicular to its surface (Figure 33-1). These structures align with the sarcomeric Z-disc and were originally termed transverse tubules (T-tubules) for their dominant orientation with respect to the long axis of the cell. However, in most species, a large number of longitudinal branches have also been observed,1,2 and this has caused different authors to describe the lattice architecture variously as the transverse-axial-tubular system (TATS),3 the sarcolemmal tubule system,4 the T-system,5 and the sarcolemmal Z-rete.6 At a macroscopic level, the T-tubular lattice affects myocyte function through at least two important mechanisms. First, it expands VM surface area, and thereby increases the density (per unit cell volume) of all sarcolemmal transport mechanisms. Second, it provides a platform for regionalization of specialized signaling structures. Here we focus on structures that are directly involved in cardiac Ca2+ signaling; the best described are the calcium release unit (CRU; Figure 33-1, right panel) and the cardiac couplon. Figure 33-1 Overview of structures involved in cardiac Ca2+ handling and excitation-contraction (E-C) coupling. T-tubules are invaginations of the sarcolemma that facilitate spatiotemporal synchronization of intracellular Ca2+ release by bringing L-type Ca2+ channels (LCCs) into close proximity with most of the cell’s volume. Ca2+ release units (CRUs) juxtapose the T-tubules along their length, and the narrow space separating the jSR and the T-tubules is named the dyadic cleft. LCCs reside in the sarcolemma, predominantly at dyadic clefts, and the surface of the release unit that faces the T-tubule (the dyadic surface) contains ryanodine receptors (RyRs). In a ventricular myocyte, typically ≈20 000 CRUs are present, and these are synchronously activated during an action potential (AP). Upon arrival of the AP, LCCs open and permit Ca2+ influx, which then triggers further Ca2+ release from the sarcoplasmic reticulum (SR) via binding to local RyRs. Ca2+ release from a single CRU is called a Ca2+ spark. After a spark, the SERCA pump and the Na/Ca exchanger either resequester the released Ca2+ into the SR, or extrude it from the cell, respectively. (Left panel is retouched from Fawcett DW, McNutt NS: The ultrastructure of the cat myocardium. I. Ventricular papillary muscle. J Cell Biol 42:1–45, 1969.) Initial impressions of the shape and structure of the CRU first appeared roughly half a century ago—well before the function of the couplon was understood, or the term itself had been coined.7 At that time, transmission electron microscopy (EM) had shown junctions between the SR and T-tubular membranes, which, in cardiac muscle, were termed dyads for their characteristic two-component appearance in longitudinal tissue sections. A few years later, Constantin et al8 identified these SR structures as the site of intracellular calcium storage; Winegrad’s landmark study9 shortly thereafter showed that they were also the site of intracellular Ca2+ release. Facett and McNutt5 accordingly refined Porter and Palade’s well-known sketch of the cardiac sarcomere,10 and their rendition remains popular today (Figure 33-1, left panel). In this schematic, Ca2+ is released from specialized projections of the SR, which closely juxtaposes the T-tubular membrane. These projections were originally named for their anatomical appearance in transmission EM (i.e., junctional—jSR; terminal—cisternal SR) or for characteristics of physical separation (i.e., heavy SR). Over the next several decades, classic studies were published by a number of groups to define Ca2+-induced Ca2+ release (CICR) as the essential mechanism of E-C coupling occurring at cardiac dyads, and responsible for activating contraction of the heart.11,12 Key aspects of CICR are detailed in the next sections, but to review briefly, voltage-dependent opening of local L-type Ca2+ channels (LCC) permits influx of Ca2+, which binds to and activates nearby ryanodine receptors (RyRs) in the jSR membrane. This results in release, from the jSR, of the bulk of Ca2+, which goes on to participate in contraction.12 Over the past two decades, it has become clear that a number of important properties of cardiac E-C coupling are critically dependent upon the biophysical characteristics of Ca2+-mediated interaction between the LCC and RyR. These processes and phenomena will be discussed in detail below, but at this point it behooves us to introduce several terms that have been adopted to reflect fundamental structure-function relationships in the current paradigm of E-C coupling, which is known as “local control.”13 First, the term CRU refers to an individual jSR terminal and its associated RyR ensemble14 and helps to indicate the discrete functional nature of these structures, that is, individual CRUs are generally activated in an all-or-nothing fashion but are otherwise functionally isolated from one another by a sufficiently large inter-CRU diffusion distance. The term couplon was introduced to explicitly define the combination of an LCC cluster and juxtaposed CRU, which together are capable of functionally interacting to contribute to E-C coupling.7 For this reason, the couplon is, by definition, the elementary site of E-C coupling in the heart (see Figure 33-1) and along with the CRU will be a feature of much further discussion in this chapter. Much of our knowledge of cardiac ultrastructure has been permitted by steadily improving approaches to both EM and light microscopy (LM). In combination with tomographic reconstruction algorithms, high-voltage EM (HVEM) has both enhanced resolution and improved penetration of thick-section preparations, which has now permitted 3-dimensional (3D) reconstruction of the T-tubule system and associated E-C coupling structures.15,16 Improvements in acquisition and analysis of LM images have now permitted imaging at or below the optical diffraction limit. This progress has brought the living T-tubule,6,17 and even the detailed morphology of individual RyR clusters,18,19 into view. Together, these techniques have been central to defining the structural characteristics of VM microdomains, describing protein localization in and around those domains, and permitting the geometrically detailed quantitative approaches we describe here. The small space between the jSR and T-tubular membranes provides a confined volume (“dyadic cleft,” “junctional cleft,” or “fuzzy space”) in which large and rapid changes in local [Ca2+] can be generated by local transporters, particularly LCCs and RyRs. This constrained architecture is fundamental to high-fidelity coupling between those transporters, and is maintained by the specialized anchoring protein, junctophilin, which tethers the jSR to the T-tubular membrane.19–21 In healthy myocytes, junctophilin keeps the distance between the jSR and the T-tubule to within 12 to 15 nm, and appears to be interspersed among the RyR molecules within the dyadic surface of the jSR membrane.19 The exact numbers of LCCs and RyRs inside the couplon are still debated. Early studies employed transmission EM to measure the cross-sectional diameter of individual CRU terminals, and to show that, in mammalian cardiac muscle, RyRs form dense clusters at these terminals.22 Assuming that the CRU terminals are circular (i.e., that the size corresponds to the diameter) and are densely packed with receptors, these authors were able to approximate the number of RyRs per couplon. This estimate suggested that 130 to 150 receptors are present in mouse ventricular couplons.22 Given that the RyR tetramer is 30 nm at each side, this would require a dyad containing 100 RyRs to be 440 nm in diameter and 1.8 × 10⁻¹² µℓ in volume. Recent studies have challenged these initial estimates.15,18,23 Using 3D EM tomography, Hayashi et al15 reported that the size of each dyad is almost an order of magnitude smaller than was previously reported (mean 0.44 × 10⁻¹² µℓ) and that each dyad includes a large fraction of tiny dyads (median 0.28 × 10⁻¹² µℓ). They also showed that the density of RyRs within each CRU was sparse. By segmenting features, such as the T-tubule (green), jSR (yellow), dyadic space (white), and RyR occupancy (blue), they observed spaces within the dyad that did not contain any RyRs (Figure 33-2, E). It is interesting to note that Hayashi et al also found that 80% of all dyads have a neighboring dyad within 25 nm, which is dramatically closer than was previously thought. Using super-resolution light microscopy, Baddeley et al18 found support for most of these surprising results. They similarly observed RyR clusters to be much smaller, more closely arranged, and more irregularly shaped than had been reported or assumed in earlier work. It is not completely clear why recent studies have retrieved such different estimates of couplon size compared with those of Franzini-Armstrong et al,22 although it is at least clear that the early assumption of a circular dyadic geometry was oversimplified, and this fact may contribute to the discrepancy. Based on agreement among recent structural studies and even earlier functional work,24 it is probably safe to conclude that the number of RyRs in the average CRU is on the order of tens rather than greater than 100. Figure 33-2 Fine anatomy of dyadic clefts in the mouse myocardium. A, High- resolution mesh models of a T-tubule (green) and jSRs (yellow) shown with a slice image; these were constructed by dual-axis electron microscopy (EM) tomography. B and C, The ultrathin serial slice images of this structure revealed inhomogeneous distribution of ryanodine receptor (RyR) feet in dyadic cleft spaces (B), and their RyR foot–rich subdomains were segmented (light blue lines in C). D through F, The intra-anatomy of three closely assembled dyadic clefts. From the complete mesh model (D), jSR membranes are removed to expose eight RyR foot–rich subdomains (the surface meshes of these subdomains are shown in light blue in E) that partially occupy dyadic cleft spaces (the whole dyadic cleft spaces are indicated as the junctional regions of T-tubular membranes in white). Both jSR meshes and meshes that identify the RyR-rich subdomains are removed in F. Scale bars: 200 nm. (From Hayashi T, et al: Three-dimensional electron microscopy reveals new details of membrane systems for Ca2+ signaling in the heart. J Cell Sci 122[Pt 7]:1005–1013, 2009.) The observation by both Baddeley et al18 and Hayashi et al15—that many small RyR clusters exist very close to each other—may have important functional implications. Baddeley et al defined a class of RyR super clusters, which combined small clusters within 100 nm of each other, because conventional understanding suggests that these clusters would function as a single CRU. However, at some combination of short intercluster distance and low SR release flux, these clusters might be expected to exhibit a variety of spark amplitudes as the result of partial activation of the super cluster. Such subspark amplitude CRU activations have been observed experimentally and have been called quarks or sparklets.25 It is conceivable that the sparse distribution of RyRs within a single dyad (observed by Hayashi et al15) could yield such behavior, and this sparse arrangement has since been observed by other investigators.23 Immunofluorescence-based colocalization studies have definitively shown that the LCCs present in ventricular myocytes exhibit a punctate pattern of distribution, and that ∼90% of these puncta are coincident with RyR.26,27 Thus, a vast majority of LCCs are probably components of couplon structures. The number of LCCs within each couplon is less certain, as is the number of active LCCs required to trigger local Ca2+ release during physiological E-C coupling. One range of estimates suggests that 17 to 53 LCCs are likely to be involved in couplon activation28–30; others have observed higher coupling fidelities and therefore suggest that fewer LCCs are required to trigger local SR Ca2+ release.31 Part of the uncertainty here is due to discrepancy in the estimates of RyR cluster size, which are required to extrapolate the LCC number in some studies.29 Otherwise, differences in the details of approach across studies, such as the potential ranges for LCC activation and partial pharmacological inhibition of the LCC pool, have made it difficult to determine truly physiologically representative constraints for E-C coupling. Localization of the myocardial Na+/Ca2+ exchanger (NCX) is also worth mentioning at this point, as its potential involvement in E-C coupling is a long-debated topic that has recently been revisited.32 Although NCX does exhibit a punctate distribution in the T-tubules, precise colocalization of NCX with RyR occurs for only ∼10 % of the total NCX signal.27,33 With this in mind, the latter authors also note that ∼40% of NCX puncta reside within 150 nm of the nearest RyR cluster. Thus, even though NCX is probably not selectively concentrated within the dyadic portion of the T-tubular membrane, it is likely to be nearby. The protein exhibiting strongest colocalization with RyR is calsequestrin (CSQN). A total of 95% of all CSQN labeling is coincident with RyR, and only ∼10% of RyR occur in the absence of CSQN. These observations are consistent with our understanding of the function of CSQN, which, through its ability to rapidly buffer Ca2+, acts to both limit the thermodynamic gradient that opposes SR Ca2+ reuptake and provide a large local supply of Ca2+ for RyR-mediated Ca2+ release. Finally, localization of the sarco-endoplasmic reticulum Ca2+ ATPase (SERCA2) is less clear than that of RyR or CSQN. It is generally agreed that both major (SERCA2a) and minor (SERCA2b) cardiac splice variants are present at the Z-disc, and therefore in the vicinity of the jSR.34–36 However, fluorescent labeling also appears to decorate the M-line SR,34 and no investigation to date has definitively demonstrated that SERCA2 exists within the same functional domain as RyR, and CSQN. As mentioned below, our quantitative approaches suggest that uncertainty in SERCA2 localization at this level may be functionally important, particularly with respect to Ca2+ spark dynamics. Functional data gained from LM and patch-clamp electrophysiology have formed the basis for multiple model studies of whole-cell E-C coupling and single Ca2+ sparks over the past 20 years.37,38 A set of four specific properties of macroscopic E-C coupling, and isolated RyR function, have been used to drive and constrain the development of these computational models: (1) RyR activation should exhibit a steep and nonlinear dependence upon submembrane cytosolic [Ca2+]; (2) reliable termination of release should be achieved by experimentally defined RyR gating properties; (3) the total Ca2+ released from the SR should be about an order of magnitude larger than that entering through activated LCCs, that is, E-C–coupling gain should be high; and (4) the total Ca2+ released from the SR should be proportional to the macroscopic LCC current, that is, SR Ca2+ release should be graded by L-type Ca2+ current (ICaL). The multiscale aspects of modeling E-C coupling became obvious quite early, as (3) and (4) are whole-cell measures, and E-C coupling is controlled locally within each of the ∼20 000 couplons in a myocyte. The first attempts to model E-C coupling used the mean cytosolic [Ca2+] as a trigger for RyR release. None of these early models, however, were able to reconcile (1) to (3) with (4).13 The remedy was to let local [Ca2+] within each CRU control the gating of the local RyRs,13,39,40 and thus “local control” models were born. These models kept a steep all-or-none control of RyR release within each couplon, and graded release was accomplished by a probabilistic recruitment of the CRUs, where CRUs were activated in proportion with ICaL. The problem of combining local control and whole-cell aspects of Ca2+ signaling is an inherently multiscale problem that has been addressed by several approaches of varying complexity.41 At the level of a single CRU, modelers have been challenged by the lack of direct measurements of local SR Ca2+ release current. Because RyRs are not members of the sarcolemma, patch-clamping techniques are not available to assay channel function in the intact cell. Instead local SR release current has been estimated from indirect measures, such as Ca2+ spark fluorescence.42 For this uncertainty, modelers have turned to functionalistic models of the CRU43 or have constrained their approaches to lipid bilayer recordings of RyRs extracted from their native environment.44 The former have been most popular in integrative models.45,46 However, we still lack a proper understanding of how models based on bilayer experiments can be incorporated into integrative models, and whether they fulfill the four E-C coupling properties previously described. One of the reasons for this is that to be able to reliably terminate a Ca2+ spark (property (2) mentioned earlier), the functionalistic models have employed Ca2+-dependent inactivation as the main termination mechanism. However, lipid bilayer experiments do not support such an inactivation mechanism at physiologically relevant cytosolic [Ca2+].47 Alternatively, experimental measurements have demonstrated that RyR channel activity is also regulated by luminal SR [Ca2+], and it has been thought for some time that this mechanism may contribute to spark termination via local jSR Ca2+ depletion.48 When luminal Ca2+ regulation was included in the model, together with a limited supply of Ca2+ in the jSR, reliable spark termination was accomplished without inactivation by cytosolic [Ca2+].49 A requirement of this model, however, is that luminal [Ca2+
Calcium Signaling in Cardiomyocyte Models With Realistic Geometries
Electrophysiological Structure of the Ventricular Myocyte
Anatomy of the Myocyte Sarcolemma
A Brief Ultrastructural History of Cardiac Excitation-Contraction (E-C) Coupling
Role of Imaging in Defining Cardiac Ultrastructure and Subcellular Modeling
Structure-Function Relationships at the Nanometer Scale (CRU and Couplon)
Couplon and CRU Microarchitecture
Subcellular Modeling at the Nanometer Scale
![]()
Stay updated, free articles. Join our Telegram channel

Full access? Get Clinical Tree


Calcium Signaling in Cardiomyocyte Models With Realistic Geometries
