Fundamentals of X-Ray Imaging, Radiation Safety, and Contrast Media
Thomas Bashore MD
Every invasive cardiologist should have a working knowledge of how x-rays are produced, and how they eventually result in visual images of the heart and its structures during angiography. Also important is the fundamental knowledge of the complications from both radiation exposure and the use of contrast media. The following is meant to be a brief, schematic look at these intertwined issues for the purposes of board review.
BASICS OF X-RAY IMAGING SYSTEMS
Basic x-ray systems in use today, including the digital imaging system using an image intensifier and the flat panel system, are shown in Figure 6-1.
To understand how an x-ray system creates an image, it is helpful to follow the flow of energy through the system. Electrons produced in the generator are sent to the x-ray tube, where they are converted to x-rays. These x-rays diverge immediately and travel through the table and the patient, where most are absorbed or scattered. A few then make it to an image detector (either image intensifier or flat panel). There they pass through a filter on the detector and strike a face layer of cesium-iodide phosphor, and a clump of light photons are emitted. From here, things differs depending on the imaging device.
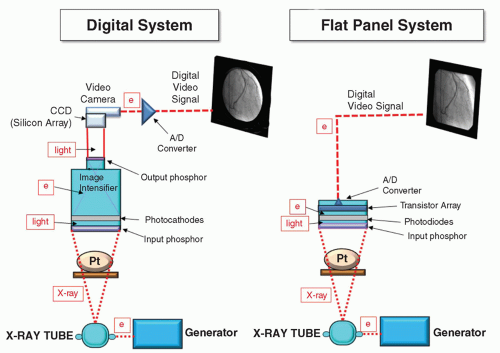 FIGURE 6-1 the left panel represents the digital imaging system, the right panel, the flat panel system. electrons generated are converted to x-rays, pass through the patient, and are sensed on the input phosphor and converted to light in both systems. in the traditional image intensifier, the light photons are converted back to electrons, accelerated, and strike the output phosphor, now enhanced 1000-fold. the image is then picked up by the CCD chips, converted to a video signal, digitized in the A/D converter and sent to the monitor. in the flat panel system, the light is converted to electrons, sensed by a transistor array, digitized, and sent directly to the monitor. |
In an image intensifier, the photons are converted to electrons and accelerated toward an output phosphor, where the image appears, now enhanced 1,000-fold. The light from this output phosphor is then transmitted to a TV camera that has a charge-coupled device (CCD). Each tiny silicon square on the CCD is activated proportionally by the amount of light that hits it. This information plus the location of each CCD chip square becomes the video signal. The signal is then digitized and sent for display on the computer monitor.
In a flat panel system, the clumps of photons are first converted to electrons by a layer of photodiodes. These electrons are then
detected by a layer made of an array of thin-film transistors (TFTs). Much like the CCD chip, the location of transistors and the intensity of the electrons that hit each TFT are then converted to a video signal. This signal is then digitized and sent directly from the panel to the monitor for display. The avoidance of another conversion of energy to light and then to an electrical signal (as occurs in the traditional image intensifier system) improves the overall performance of the flat panel system. Flat panel systems have better dynamic range and improved uniformity in both image and brightness compared with the traditional image intensifier systems. Unfortunately these advances in image quality have not resulted in a major reduction in x-ray dose (1). Newer systems, based on amorphous selenium, can now directly convert the x-rays to electrons to construct the video signal, skipping the light photon conversion step.
detected by a layer made of an array of thin-film transistors (TFTs). Much like the CCD chip, the location of transistors and the intensity of the electrons that hit each TFT are then converted to a video signal. This signal is then digitized and sent directly from the panel to the monitor for display. The avoidance of another conversion of energy to light and then to an electrical signal (as occurs in the traditional image intensifier system) improves the overall performance of the flat panel system. Flat panel systems have better dynamic range and improved uniformity in both image and brightness compared with the traditional image intensifier systems. Unfortunately these advances in image quality have not resulted in a major reduction in x-ray dose (1). Newer systems, based on amorphous selenium, can now directly convert the x-rays to electrons to construct the video signal, skipping the light photon conversion step.
FORMATION OF THE X-RAY BEAM
The general concept of what happens between the generator and the x-ray tube to form x-rays is shown in Figure 6-2. The x-ray tube is a vacuum tube with a cathode coil (or coils) facing a spinning anode. Electrons are sent to the cathode from the generator, and the cathode becomes white hot (about 3,000°F). At this temperature, the electrons virtually boil off (thermionic emission). The generator also sets up a voltage potential across the x-ray tube. The electrons from the cathode are encouraged to jump from the cathode to the anode by this voltage potential. A cup with a local voltage potential helps focus the electrons toward the anode. The maximal (peak) voltage across the x-ray tube is referred to as the kVp of the system, and the number of electrons that jump from the cathode to the anode is mA (milliamperes) of the system. Most of the electrons that jump from the cathode to the anode simply produce heat, but some end up striking the anode and producing x-rays. To control the heat generated, the anode rotates rapidly (3,500 to 10,000 rpm), and circulating oil around the x-ray tube helps cool it.
X-rays are produced when electrons strike the tungsten anode. The face of the anode is steeply angulated (8° to 15°) so that the x-rays emerge from as much a point source as possible (the x-ray beam focal point). If a large patient is on the table, a second coil (cathode) may be brought into play. Because low-frequency x-rays are not clinically useful and only contribute to noise, many of them are absorbed by copper and aluminum filters as they pass through the output of the x-ray tube. Collimation also helps shape the x-ray beam as it emerges, and reduces scatter.
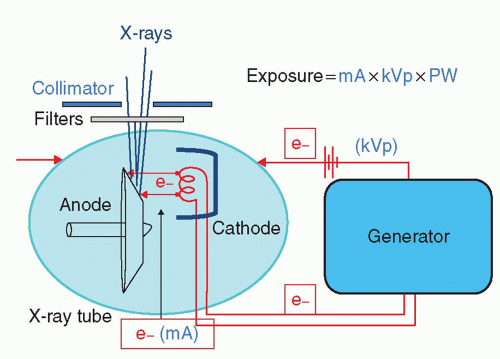 FIGURE 6-2 The x-ray tube. A potential is setup across the x-ray tube that encourages electrons from the cathode inside the vacuum tube to jump to the anode. The peak voltage across the x-ray tube is referred to as the kVp of the system, and the number of electrons that jump is referred to as the mA. The exposure equation is defined as the mA × kVp × pulse width. Collimators and filters help shape and filter out unusable x-rays as they leave the x-ray tube. |
X-RAY SPECTRUM AND IODINATED CONTRAST
The x-ray spectrum that emerges from the x-ray tube is shown in Figure 6-3. The highest energy in the spectrum correlates with the highest energy potential across the x-ray tube (the kVp). Iodine is a particularly good absorber of the x-rays in the emitted energy range, and that is the reason why it is used as a contrast agent. The iodine absorption spectrum is shown superimposed on the x-ray spectrum. Note that as the energy increases, the iodine absorbs fewer of the x-rays until suddenly there is marked absorption. This is the energy of the K shell electron of the iodine and is referred to as the K edge. Progressively increasing the x-ray energy again results in progressively less absorption past this K edge. X-ray exposure is defined by the following equation:

What then happens when levels of these are altered? If the kVp is increased, there are more high-energy x-rays produced, with many of them penetrating through the iodine column. The result is a washed-out, gray image with little contrast between the angiogram and the background. For this reason, the kVp should not be too high, and all systems now limit it. If the mA is increased, there is a significant increase in the radiation exposure, but radiographic imaging contrast is preserved. In very large patients, it may be difficult to generate enough mA with one cathode, though, and a second cathode in the x-ray tube is brought into play to increase the number of eventual x-rays. If the pulse width is too long, then blurring of the image may occur.
EXPOSURE CONTROL
X-rays diverge as they leave the x-ray tube and travel through the table and the patient toward the image detector. In the traditional I.I. system, the brightness of the output phosphor is sampled and fed
back to the generator (automatic brightness control). In flat panel systems, the feedback is based on the output voltage (automatic dose-rate exposure control). Most of the x-rays never make it to the image detector as they are absorbed, attenuated, or scattered by the patient and the table. To the operator, most of the exposure occurs from the scatter from the entry side of the patient. When the x-ray tube is closest to the operator, the amount of radiation exposure to the operator is the greatest. Thus, in a cranial left anterior oblique (LAO) view, with the x-ray tube on the same side of the table as the operator, operator exposure occurs six times more than in a caudal right anterior oblique (RAO), where the x-ray tube is on the opposite side of the table (2).
back to the generator (automatic brightness control). In flat panel systems, the feedback is based on the output voltage (automatic dose-rate exposure control). Most of the x-rays never make it to the image detector as they are absorbed, attenuated, or scattered by the patient and the table. To the operator, most of the exposure occurs from the scatter from the entry side of the patient. When the x-ray tube is closest to the operator, the amount of radiation exposure to the operator is the greatest. Thus, in a cranial left anterior oblique (LAO) view, with the x-ray tube on the same side of the table as the operator, operator exposure occurs six times more than in a caudal right anterior oblique (RAO), where the x-ray tube is on the opposite side of the table (2).
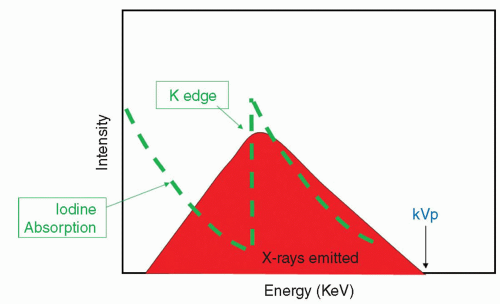 FIGURE 6-3 The x-ray spectrum and iodine absorption. X-rays emitted from the x-ray tube are diverse in their energy levels with the maximal energy correlating with the kVp. When the iodine absorption curve overlies the energies sent from the x-ray tube, the dotted line is noted. Initially as the energy increases the iodine absorbs less and then suddenly the energy from the K shell of the iodine is reached, and it absorbs much more of the x-ray energy. This is the K edge. This is the reason iodine is used to provide radiographic contrast. |
Radiation exposure decreases by the inverse square law:
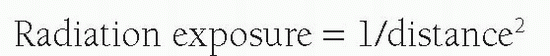
Thus, the greater the distance the operator can be from the radiation source and patient, the lesser the exposure. The same principle applies to the patient, that is, the closer the patient is to the x-ray source, the greater the exposure. Indeed, the patient is the major absorber of the x-rays, with most of the impact of the ionizing radiation occurring in the patient’s skin. X-rays also scatter from within the patient to both the operator and the patient’s internal organs.
An estimate of how much radiation absorption has occurred at the skin has been devised, and this feature is available on many recent x-ray systems. Figure 6-4 demonstrates how the “interventional reference point” derives this estimate (3). From an ionization chamber placed at the output of the x-ray tube, an estimate of the total radiation dose sent, the dose-area product (DAP), can be derived. If one assumes a line to the precise middle of the patient, then drops back 15 mm, one can assume the energy at this point represents the energy delivered to the skin. Using the inverse square law, the radiation dose delivered at that skin level can be mathematically derived. There is some uncertainty as to how well these derived data actually correlate with the measured peak skin dose (4), as the value has correlated with total effective dose to the patient in some studies (5) but not in others (6). In cardiac catheterization study, the reported values vary widely, but an average DAP for a diagnostic catheter is about 60 Gy cm2; the average dose during an interventional study is about 90 Gy cm2 (6, 7).
 FIGURE 6-4 The dose-area product and interventional reference point. The total amount of radiation sent from the x-ray tube can be estimated by use of an ionizing box attached to the output of the x-ray system. This provides the dose-area product or DAP. The total amount, though, does not provide an accurate measurement of the patient’s skin exposure. Short of a monitoring device on the skin, the dose to the skin of the patient can be estimated at about 15 cm from the patient’s midpoint (150 mm) and calculating what the skin dose would be expected at that point, by applying in the inverse square law. |
While continuous emission of the x-rays has traditionally been used during fluoroscopy and pulsing of the x-ray beam used during cineangiography, newer systems now pulse the fluoroscopic beam as well. Pulsing the fluoroscopic beam reduces total x-ray exposure, and most studies in adults are now done at a fluoroscopic rate of 7.5 to 15 frames/s, with cineangiography rates of 15 frames/s. At higher heart rates, framing rates need to be increased to prevent inadequate sampling (aliasing); so many pediatric laboratories sometimes still use 30 to 60 frames/s imaging rates.
Regardless of the pulsing rate, each exposure must still satisfy the exposure equation. An exposure-control prism samples the output phosphor in digital systems and the central area in flat panel systems (8). As one pans over the bones rather than the lungs, for instance, more exposure is required due to the increased density of bone. Similarly, in obese patients and for angulated views, more exposure is required to satisfy the exposure equation.
Another factor that requires increase in the x-ray dose is magnification. Figure 6-5A shows how magnification is electronically accomplished in the image intensifier and the flat panel. When the
entire face of the image intensifier is used to acquire an image on the input phosphor (9-inch diameter mode, for example), the image at the output phosphor appears much smaller than when either 7-inch or 5-inch diameter mode is used. Stated another way, the lesser of the face of the image intensifier used, the larger the image appears on the output phosphor. However, because less of the face of the image intensifier is used, and the exposure equation must still be satisfied, the x-ray dose must necessarily be increased proportionately.
entire face of the image intensifier is used to acquire an image on the input phosphor (9-inch diameter mode, for example), the image at the output phosphor appears much smaller than when either 7-inch or 5-inch diameter mode is used. Stated another way, the lesser of the face of the image intensifier used, the larger the image appears on the output phosphor. However, because less of the face of the image intensifier is used, and the exposure equation must still be satisfied, the x-ray dose must necessarily be increased proportionately.
 FIGURE 6-5 A: Magnification in a traditional image intensifier. Using less and less of the face of the image intensifier results in the image appearing larger and larger on the output phosphor. To satisfy the exposure equation, since less of the face of the image intensifier is being used, requires an increased dose. B: Magnification in a flat-panel system. Extracting the image from the middle section of the TFTs outputs a larger image. To do this without loss of resolution is complex and requires an increased x-ray dose. |
 FIGURE 6-6 Magnification that occurs when the source-to-image distance is increased. Increasing the source-to-image distance results in loss of x-rays owing to their divergence. The image appears larger, and to satisfy the exposure equation, the amount of x-ray dose increases. |
In the flat panel system, the issue is more complex (Fig.6-5B). Magnification can occur by simply selecting the inner section of the image and digitally expanding it. The image may lose resolution by this method, so to keep the signal-to-noise ratio satisfactory and to meet the total exposure equation, an increase in x-ray dose is required as well.
Magnification also results when the source-to-image distance (SID) is increased (Fig. 6-6). Because of the diversion of x-rays, the more narrow the SID, the more x-rays are captured, and the image appears smaller compared with when the SID is expanded. Therefore, it is important to keep the image detector as close to the patient as possible. Recall, though, that the closer the patient is to the x-ray source, the more the radiation exposure to the patient via the inverse square law. Figure 6-7 outlines the various relationships between the patient, the operator, the x-ray source, and the image detector. If the SID is high and the patient is elevated, there is excessive exposure to the operator. If the SID is high and the patient is close to the x-ray tube, there is excessive exposure to the patient.
IMAGE STORAGE
Digital imaging allows for high-resolution image data to be made immediately available. Newer systems all have storage capacity and system bandwidth for storage and transfer of large amounts of data. Once in a digital format, the data are then written to the disk using the DICOM (Digital Communication in Medicine) format that provides for standardization across the various cardiac catheterization laboratories. The digital data are also available for viewing across internal and external network connections and can be stored on a variety of archival media devices. As the cost of digital storage has dramatically dropped and the availability of large storage media in the terabyte range has become an inexpensive reality, the expense involved with the all-digital imaging system has dropped.
 FIGURE 6-7 The effects of various relationships between the table and source-to-image distance heights. In the first panel, the source-to-image distance is low to the patient and he is a comfortable distance from the x-ray tube. In the middle panel, the image intensifier is close to the patient, but he is far from the x-ray tube. This increase in the source-to-image distance requires a greater x-ray dose and more exposure to the operator with less to the patient based on the inverse square law. In the right panel, the patient is at a comfortable distance from the x-ray tube, but the source-toimage distance is too wide. This increases the x-ray dose and results in an increased dose to the patient. |
RADIATION SAFETY ISSUES
Terminology
There are several recent reviews of radiation safety specifically for cardiac catheterization laboratories (9, 10, 11, 12, 13 and 14). The National Council on Radiation Protection and Measurement (NCRP) is responsible for providing guidelines for the public and medical workers. The traditional use of the ALARA (As Low As Reasonably Achievable) concept still holds, as theoretically no dose of ionizing radiation is without harm.
Much of the confusion in the radiologic literature relates to the interchangeable use of various terms to describe radiation, radiation absorption, and radiation exposure. The basic unit of radiation ionization is defined as the Roentgen (R). It is the amount of ionization that a defined mass of air undergoes when bombarded by x-rays or gamma rays. The amount of energy actually absorbed by material is the radiation absorbed dose (rad). The amount of energy absorbed by differing materials varies according to the type of radiation and the atomic number of the material. Radiation protection units are simply rads times some quality factor that is dependent on the type of radiation, and these units are called rems (Roentgen equivalent man, rem dose = rad dose × QF × other modifying factors). In cardiology, the quality factor is 1.0 for both x-rays and gamma rays, so rems and rads are equal.
The units for rads are expressed in Gray (Gy) and for rems in Seiverts (Sv). One Sv equals 100 rem or 1 rem equals 10 mSv. When one discusses radiation being delivered, Gy units are used. When one discusses radiation absorbed, then Sv are used.
Biologic Effects from X-ray Exposure
Radiation may be classified as directly or indirectly ionizing (15). Direct ionization means the radiation has enough energy to disrupt
the atomic structure of the material it strikes, producing chemical and biologic changes. X-rays (and gamma rays) are indirectly ionizing, meaning that when they are absorbed, they produce a variety of fast-moving particles that can ionize other atoms of the absorber, breaking vital chemical bonds. The biologic effects of x-rays results principally from damage to DNA. For x-ray radiation, this damage is primarily due to the production of free radicals (a free radical is an atom or molecule with an unpaired orbital electron in the outer shell), and most of this is from the hydroxyl radical. When cells are irradiated, the DNA may suffer a single-strand break or a doublestrand break. Single-strand breaks are readily healed and the cell normally is not killed. The repair may be incorrect, though, and a mutation may occur. Double-strand breaks are less common, but more serious, and result in cell death as well as mutations and carcinogenesis.
the atomic structure of the material it strikes, producing chemical and biologic changes. X-rays (and gamma rays) are indirectly ionizing, meaning that when they are absorbed, they produce a variety of fast-moving particles that can ionize other atoms of the absorber, breaking vital chemical bonds. The biologic effects of x-rays results principally from damage to DNA. For x-ray radiation, this damage is primarily due to the production of free radicals (a free radical is an atom or molecule with an unpaired orbital electron in the outer shell), and most of this is from the hydroxyl radical. When cells are irradiated, the DNA may suffer a single-strand break or a doublestrand break. Single-strand breaks are readily healed and the cell normally is not killed. The repair may be incorrect, though, and a mutation may occur. Double-strand breaks are less common, but more serious, and result in cell death as well as mutations and carcinogenesis.
In most organs, the loss of a few cells due to these DNA breaks is unimportant until a threshold dose is reached. Effects such as this are called deterministic, and this kind of injury is dose dependent. Examples of this type of injury include skin erythema, skin desquamation, cataracts, bone marrow suppression, gonadal injury, sterility, fibrosis, and organ atrophy.
If irradiation to the cell keeps it viable, but modified, it may become cancerous. Injury that causes mutations or cancer is referred to as stochastic (a word meaning “random”). Stochastic effects have no threshold (a single x-ray can cause it), but the probability of such an occurrence increases as the dose increases.
Each of the body’s organs has a variable susceptibility to radiation injury. In general, the more biologically active an organ, the more susceptible it is to radiation. The International Commission on Radiation Units and Measurement has suggested a tissue weighting factor for the various organs, and this generally corresponds to the organ’s susceptibility to the effects of ionizing radiation. Table 6-1 outlines the tissue weighting factors for different tissues based on this report (16). Note that the sum of all the weighting factors is unity.
TABLE 6-1 Tissue Weighting Factors. This Table Provides the Approximate Sensitivity of Various Organs to Ionizing Radiation | ||||||||||||||||||||||||||||||||
|---|---|---|---|---|---|---|---|---|---|---|---|---|---|---|---|---|---|---|---|---|---|---|---|---|---|---|---|---|---|---|---|---|
| ||||||||||||||||||||||||||||||||
For the cardiac catheterization laboratory, the effective dose is probably the most important as it is associated with stochastic risk. It is derived from the Monte-Carlo-derived weighted sum of dose estimates to individual organs. The risk is generally associated with the overall dose received.
Radiation Exposure
We live on a planet where radiation has been a fact of life since the beginning. In fact, most of the background radiation we receive comes from the earth (radon = 55% of total background dose) (17). Natural radiation accounts for about 82% of the radiation we receive, and man-made radiation for 18%. Though the numbers vary widely depending on location, altitude, and so forth, the average background radiation per year received in the United States is about 3.6 mSv. Compare this with a patient’s exposure from a routine chest x-ray being around 0.02 to 0.04 mSv. Table 6-2 outlines the current recommendations for maximal occupational radiation dose limits (18). Note that the total recommended maximal dose for an invasive cardiologist is 50 mSv ??????(5 rem)/y, and the total accumulative dose is age × 10 mSv (age × total rems). The population cancer risk has variously been estimated for the general population at about 20% or greater. The cumulative additional risk for cancer in those exposed to occupational radiation is about 0.004% × mSv (or 0.04% × rem) (14) If a busy interventionalist receives 25 mSv/y and practices for 20 years, his total dose would be about 500 mSv ??????(50 rem). The added risk would thus be 500 × 0.004% or 2%. The additional radiation exposure received would thus increase the cancer risk from baseline 20% to 22%.
During an average interventional cardiac catheterization, the physician operator receives about 0.04 mSv (about that of a chest x-ray) on his badge outside the apron. In a year, the average interventionalist receives from 2 to 60 mSv/y (19). Nurses in the room receive around 8 to 16 mSv/y, and the technologists about 2 mSv/y (20).
Stay updated, free articles. Join our Telegram channel

Full access? Get Clinical Tree


