Frailty is a syndrome of older adults associated with increased morbidity and mortality. We aimed to assess the impact of frailty status on outcomes after transcatheter aortic valve implantation (TAVI). We reviewed all 191 patients who underwent a modified Fried frailty assessment before TAVI between February 2012 and September 2015 at a single academic medical center, and we assessed the impact of preoperative frailty status on morbidity, mortality, and health care utilization after TAVI. Frailty, pre-frailty, and nonfrailty were present in 33% (n = 64), 37% (n = 70), and 30% (n = 57) of patients, respectively. Slowness (75% vs 54%, p = 0.003) and low physical activity (55% vs 31%, p = 0.001) were more common in women than men. With increasing frailty status, the proportion of women increased (35% nonfrail, 44% pre-frail, and 66% frail, p = 0.002) and stature decreased (1.68 ± 0.11 m nonfrail, 1.66 ± 0.11 m pre-frail, 1.62 ± 0.12 m frail, p = 0.028). There was no difference in post-TAVI 30-day mortality, stroke, major vascular injury, major or life-threatening bleeding, respiratory failure, mean hospital length of stay, 30-day hospital re-admission, or overall survival between groups. The rate of discharge to a rehabilitation facility increased with increasing frailty status (14% nonfrail, 22% pre-frail, and 39% frail, p = 0.005). Frailty was independently associated with discharge to a rehabilitation facility (odds ratio 4.80, 95% confidence interval 1.66 to 13.85, p = 0.004). In conclusion, the safety of TAVI is not affected by frailty status, but patients with frailty are less likely to be discharged directly home after TAVI.
Frailty is a syndrome of older adults characterized by shrinking, weakness, slowness, low physical activity, and exhaustion. Among elderly patients with cardiovascular disease, frailty portends higher rates of morbidity and mortality compared with patients without frailty. In clinical trials, 15% to 18% of patients treated with transcatheter aortic valve implantation (TAVI) meet criteria for frailty, but recent reports have detected frailty in 47% to 49% of patients treated with TAVI. Despite the high prevalence of frailty in this population, the impact of frailty status on outcomes after TAVI is poorly understood. Previous reports with a variety of nonstandard frailty assessments have suggested that frailty is associated with increased rates of disability and mortality after TAVI. This study describes the prevalence and impact of preoperative frailty status on outcomes after TAVI using a simple modified Fried frailty assessment.
Methods
The Institutional Review Board at the Northwestern University Feinberg School of Medicine approved this study. The study period spanned from initial adoption of pre-TAVI frailty assessments in February 2012 until September 2015. Ours is a tertiary care academic medical center in which the need for pre-TAVI frailty assessment was determined by the multidisciplinary heart valve team on a case-by-case basis to inform clinical decision making regarding aortic valve intervention. During the study period, 262 consecutive cases of TAVI were performed at our institution, of which 191 (73%) underwent baseline frailty testing before TAVI and were included in this study. Baseline demographics, patient characteristics, and procedural details were obtained by review of the electronic medical record. We reviewed the social security death index and the electronic medical record to assess survival.
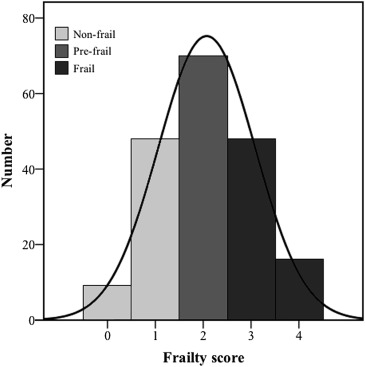
Frailty status was assessed by a trained registered nurse using a modified Fried frailty assessment ( Table 1 ), which incorporated 4 domains of frailty: shrinking, weakness, slowness, and low physical activity. Each domain was scored individually in a binary fashion as normal or abnormal, and the total number of abnormal domains was summed to generate a frailty score. We classified patients with a frailty score of ≥3 as frail, whereas those with a score of 2 were classified as pre-frail, and those with a score of ≤1 were classified as nonfrail ( Figure 1 ).
| Shrinking | |
| Self-reported unintentional weight loss >10lbs in prior 12 months | 1 point |
| Weakness | |
| Grip strength by dynamometer (kg) for men according to body mass index (kg/m 2 ) | |
| ≤ 24kg/m 2 | 1 point if ≤ 29 kg |
| 24.1-28.0kg/m 2 | 1 point if ≤ 30 kg |
| >28kg/m 2 | 1 point if ≤ 32 kg |
| Grip strength by dynamometer (kg) for women according to body mass index (kg/m 2 ) | |
| ≤ 23kg/m 2 | 1 point if ≤ 17 kg |
| 23.1-26.0kg/m 2 | 1 point if ≤ 17.3 kg |
| 26.1-29.0kg/m 2 | 1 point if ≤ 18 kg |
| >29kg/m 2 | 1 point if ≤ 21 kg |
| Slowness | |
| 5 meter gait speed (seconds) for men according to height (cm) | |
| ≤ 173cm | 1 point if ≥ 7 seconds |
| > 173cm | 1 point if ≥ 6 seconds |
| 5 meter gait speed (seconds) for women according to height (cm) | |
| ≤ 159cm | 1 point if ≥ 7 seconds |
| > 159cm | 1 point if ≥ 6 seconds |
| Low Physical Activity | |
| Katz Index of Independence in Activities of Daily Living scale | 1 point if dependent with ≥ 1 activity |
Each frailty domain was scored by commonly accepted methods of the modified Fried frailty assessment. Patients with self-reported unintentional weight loss of 10 pounds or more within the previous 12 months were classified as shrinking. Handgrip strength was tested on the patient’s dominant hand using a standard dynamometer. We defined weakness as a handgrip strength value below the twentieth percentile from a cohort of >5,000 community-dwelling adults >65 years stratified by gender and body mass index (BMI). We measured 5-m gait speed (the time required for the patient to complete a 5-m walk test), and we defined slowness as a 5-m gait speed slower than the twentieth percentile from a cohort of over 5,000 community-dwelling adults >65 years stratified by gender and height. Finally, we assessed physical activity level using the Katz Index of Independence in Activities of Daily Living (ADL) scale which is a patient-reported 6-point scale measuring dependence with 6 ADLs (bathing, dressing, hygiene, mobility, continence, and feeding). Congruous with previous reports using the Katz ADL scale, we defined low physical activity as the presence of any disability (any score <6).
The outcomes of this study were 30-day mortality, adverse events within 30 days of TAVI, hospital length of stay, discharge to a rehabilitation facility, and hospital re-admission within 30 days of TAVI. Additionally, we assessed the impact of frailty status on overall survival. Hospital length of stay was measured as the number of days from TAVI until hospital discharge or inpatient death. We defined discharge to a rehabilitation facility as any discharge to a skilled nursing facility, acute inpatient rehabilitation facility, or long-term acute care facility. We adjudicated adverse events based on the consensus guidelines of the Valve Academic Research Consortium.
Comparisons of baseline characteristics and procedural details between groups were performed with chi-square tests for categorical variables and 1-way ANOVA tests for continuous variables. We used a log-rank test to compare survival functions between groups. We assessed associations between baseline factors and discharge destination by univariate binary logistic regression. We created a multivariable model to assess the adjusted risk of discharge to a rehabilitation facility by including variables with a significance of p <0.05 by univariate analysis. All analyses were performed using SPSS, version 22, software (IBM Corporation, Armonk, NY).
Results
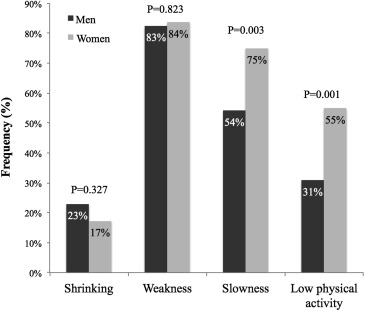
Nonfrailty was present in 30% (n = 57), pre-frailty in 37% (n = 70), and frailty in 33% (n = 64). Shrinking was reported by 20% (n = 38) of patients, whereas slowness was present in 64% (n = 122), weakness in 83% (n = 157), and low physical activity in 41% (n = 79) of patients. Female gender was significantly associated with slowness and low physical activity ( Figure 2 ).
Baseline and procedural characteristics of the study population are summarized in Table 2 . Patients without frailty were significantly younger and more likely to be male. The rate of previous stroke was the highest among patients with frailty, but there were no other differences in patient demographics or chronic co-morbidities such as congestive heart failure or chronic lung disease between the groups. All patients, including the pre-frail and frail groups, had mean BMI values consistent with being overweight, and there was an association between increasing frailty status and shorter stature. There was a trend showing lower baseline serum creatinine levels with increasing frailty status. Notably, there was no difference in Society of Thoracic Surgeons (STS)–predicted 30-day operative mortality or the frequency of New York Heart Association class 3 or class 4 symptoms between the groups. Transfemoral vascular access for TAVI was common in each group. First-generation Edwards-Sapien valves were used in 25% (n = 47), Sapien XT valves in 31% (n = 59), Sapien 3 valves in 17% (n = 32), Medtronic CoreValve in 22% (n = 41), and Direct Flow Medical valves in 6% (n = 11) of cases, respectively.
| All (n=191) | Non-frail (n=57) | Pre-frail (n=70) | Frail (n=64) | P | |
|---|---|---|---|---|---|
| Age (years) | 82.4 +/- 9.2 | 78.9 +/- 11.9 | 84.6 +/- 7.2 | 83.1 +/- 7.5 | 0.002 |
| Men | 98 (51%) | 37 (65%) | 39 (56%) | 22 (34%) | 0.002 |
| Hypertension | 154 (81%) | 46 (81%) | 58 (83%) | 50 (78%) | 0.787 |
| Hyperlipidemia | 121 (63%) | 38 (67%) | 46 (66%) | 37 (58%) | 0.526 |
| Diabetes mellitus | 66 (35%) | 23 (40%) | 19 (27%) | 24 (38%) | 0.247 |
| Coronary artery disease | 149 (78%) | 42 (74%) | 53 (76%) | 54 (84%) | 0.309 |
| Coronary artery bypass surgery | 54 (28%) | 17 (30%) | 20 (29%) | 17 (27%) | 0.922 |
| Coronary artery stent | 58 (30%) | 17 (30%) | 21 (30%) | 20 (31%) | 0.982 |
| Congestive heart failure | 127 (67%) | 40 (70%) | 46 (66%) | 41 (64%) | 0.765 |
| Peripheral artery disease | 32 (17%) | 11 (19%) | 15 (21%) | 6 (9%) | 0.145 |
| Prior stroke | 19 (10%) | 3 (5%) | 3 (4%) | 13 (20%) | 0.003 |
| Atrial fibrillation or flutter | 78 (41%) | 22 (39%) | 30 (43%) | 26 (41%) | 0.888 |
| Chronic obstructive pulmonary disease | 27 (14%) | 8 (14%) | 14 (20%) | 5 (8%) | 0.129 |
| Chronic kidney disease | 54 (28%) | 20 (35%) | 20 (29%) | 14 (22%) | 0.272 |
| NYHA class 3 or 4 | 150 (85%) | 45 (83%) | 52 (81%) | 53 (90%) | 0.393 |
| Height (meters) | 1.66 +/- 0.11 | 1.68 +/- 0.11 | 1.66 +/- 0.11 | 1.62 +/- 0.12 | 0.028 |
| Weight (kg) | 78.4 +/- 18.2 | 80.1 +/- 17.1 | 78.6 +/- 19.2 | 76.8 +/- 18.3 | 0.623 |
| Body mass index (kg/m 2 ) | 28.5 +/- 5.7 | 28.2 +/- 5.0 | 28.2 +/- 4.9 | 29.1 +/- 6.9 | 0.597 |
| STS-predicted 30-day operative mortality (%) | 7.2 +/- 3.9 | 7.4 +/- 4.4 | 7.4 +/- 4.4 | 6.8 +/- 2.8 | 0.617 |
| Creatinine (mg/dL) | 1.38 +/- 1.08 | 1.66 +/- 1.67 | 1.33 +/- 0.83 | 1.19 +/- 0.45 | 0.053 |
| Hemoglobin (mg/dL) | 12.1 +/-1.7 | 12.4 +/- 1.8 | 12.1 +/- 1.6 | 11.8 +/- 1.8 | 0.155 |
| Left ventricular ejection fraction (%) by transthoracic echocardiography | 55 +/- 13 | 55 +/- 13 | 55 +/- 13 | 55 +/- 14 | 0.931 |
| Aortic valve area (cm 2 ) by transthoracic echocardiography | 0.73 +/- 0.28 | 0.78 +/- 0.30 | 0.73 +/- 0.30 | 0.70 +/- 0.22 | 0.289 |
| Trans-femoral TAVI | 161 (84%) | 44 (77%) | 60 (86%) | 57 (89%) | 0.185 |
There was no significant difference in the 30-day mortality rate between groups. Similarly, there were no differences in the rates of stroke, major or life-threatening bleeding, major vascular injury, or respiratory failure within 30 days of TAVI between the groups. Mean hospital length of stay and the rate of hospital re-admission within 30 days were also similar between the groups. There was a significant increase in the rate of discharge to a rehabilitation facility with increasing frailty status ( Table 3 ).
| All (n=191) | Non-frail (n=57) | Pre-frail (n=70) | Frail (n=64) | P | |
|---|---|---|---|---|---|
| 30-day mortality | 6 (3%) | 1 (2%) | 3 (4%) | 2 (3%) | 0.718 |
| Stroke | 11 (6%) | 2 (4%) | 5 (7%) | 4 (6%) | 0.668 |
| Major or life-threatening bleeding | 15 (8%) | 2 (4%) | 9 (13%) | 4 (6%) | 0.126 |
| Major vascular injury | 12 (6%) | 3 (5%) | 5 (7%) | 4 (6%) | 0.910 |
| Respiratory failure | 7 (4%) | 3 (5%) | 3 (4%) | 1 (2%) | 0.525 |
| Hospital length of stay (days) | 6.1 +/- 5.0 | 5.9 +/- 6.1 | 6.3 +/- 5.3 | 6.0 +/- 3.5 | 0.883 |
| Discharge to a rehabilitation facility | 48 (25%) | 8 (14%) | 15 (22%) | 25 (39%) | 0.005 |
| Hospital re-admission within 30 days | 17 (9%) | 4 (7%) | 6 (9%) | 7 (11%) | 0.746 |
Stay updated, free articles. Join our Telegram channel

Full access? Get Clinical Tree


