FIGURE 10.1. Illustration from the 1982 report by Zierler and coworkers showing the Doppler spectral waveforms from an early postoperative stenosis that regressed. Left,Examination approximately 6 months after a left carotid endarterectomy shows a flow pattern that is characteristic of a 50% to 79% stenosis with elevated peak systolic frequency. Right,A follow-up examination 8 months later (about 14 months postoperatively) is consistent with less than 50% internal carotid artery stenosis. Note that Doppler shift frequencies are shown on the vertical axis because the duplex scanners at the time of this study did not have a velocity scale. (From Zierler RE, Bandyk DF, Thiele BL, et al. Carotid artery stenosis following endarterectomy. Arch Surg 1982;117:1408–1415. Reprinted with permission.)
Bernstein and coworkers followed 566 patients after CEA and found a 50% or greater restenosis rate at 10 years (life-table analysis) of 14.5% in women and 7.7% in men (P < 0.003).17 Curiously, these authors found early restenosis to be protective—patients with restenosis were statistically less likely to have late symptoms, stroke, or early death than were patients with normal postoperative duplex scans. Mackey and colleagues followed 348 patients after CEA and observed a 16% rate of 50% or greater restenosis at a mean 4-year follow-up.18 Like Bernstein and coworkers, these authors concluded that the stroke risk related to early restenosis was low. Without performing a formal cost-benefit analysis, this group suggested that routine duplex follow-up after CEA was difficult to justify.
In 1996, Ricotta and DeWeese published a single-center retrospective analysis focusing on progression of contralateral carotid disease in patients undergoing CEA.19 They reviewed 562 patients who underwent 660 operations over a 13-year period. Approximately 30% of these patients had greater than 50% diameter stenosis in the contralateral carotid artery at initial presentation, and about half of these underwent CEA during early follow-up. For patients with less than 50% contralateral carotid stenosis at presentation, they documented a 10% progression rate to greater than 50% stenosis at 4.5 years mean follow-up. They concluded that patients with minimal contralateral carotid stenosis and a widely patent ipsilateral carotid artery after CEA could be followed using duplex ultrasound at intervals of up to 2 years.
A single-center report by Roth and associates in 1999 assessed the value of duplex scanning during and after CEA.20 Duplex scans were performed intraoperatively and after operation at 3- to 6-month intervals for a mean follow-up of 27.4 months. Threshold criteria for a 50% to 74% stenosis included PSV greater than 125 cm/s, end-diastolic velocity (EDV) less than 125 cm/s, and an internal carotid artery to common carotid artery (ICA/CCA) PSV ratio greater than 2.5. Threshold criteria to diagnose a 75% to 99% stenosis included PSV greater than 300 cm/s, EDV greater than 125 cm/s, and ICA/CCA PSV ratio greater than 4.0. During follow-up, six arteries (2.7%) developed restenosis greater than 50%, but only one (<1%) developed restenosis greater than 75%, and this latter patient underwent reoperation. Similar to the observations of Ricotta and DeWeese, Roth and associates found a higher rate of progression to severe disease on the side contralateral to the CEA, with 12.7% of patients showing an increase in carotid stenosis by at least one duplex stenosis category during follow-up. Overall, these studies from the 1990s suggested that serial duplex scanning after CEA is more justified for surveillance of contralateral untreated disease than for ipsilateral recurrent stenosis.
These studies form the basis for current duplex follow-up algorithms after CEA. As a related observation, in view of the low morbidity associated with restenosis after CEA documented in these reports, it is noteworthy that a large number of carotid stents have been placed for recurrent stenosis. For instance, 34% of the 480 patients undergoing CAS in the Boston Scientific EPI: A Carotid Stenting Trial for High-Risk Surgical Patients (BEACH) trial of the Boston Scientific WALLSTENT were performed for restenosis after CEA.21
The technique of placing a patch for closure of the arteriotomy during CEA (patch angioplasty) likely has a significant impact on the development of restenosis. In a 1987 report, Ouriel and Green found that patch angioplasty was associated with a lower rate of early restenosis.22 In 1994, Myers and coworkers published a single-center prospective, randomized, controlled trial wherein they were unable to demonstrate superior long-term results with vein patch closure as compared with primary arteriotomy closure during CEA.23 However, by 2004, Bond and colleagues were able to identify seven randomized, controlled trials involving 1281 operations comparing routine patch closure with primary closure during CEA, and patch angioplasty was associated with a statistically significant reduction in risk for perioperative and late stroke.24 The strength of these data is such that the National Quality Forum has passed a quality measure supporting patch closure for conventional noneversion CEA.25
Ultrasound Findings
Duplex examinations performed on patients in the weeks or months after CEA will most often demonstrate a widely patent endarterectomy site (Fig. 10.2). The proximal initiation point and the distal end point of the endarterectomized segment are usually visible. The location of the proximal “shelf” is determined by surgical technique and the severity of disease in the CCA. The caliber of the lumen and its shape depend on whether primary arteriotomy closure, eversion endarterectomy, or conventional endarterectomy with patch angioplasty closure has been performed. B-mode and color flow imaging typically demonstrate wide patency, although there may be color flow swirling (flow separation) at the CEA site if a patch has been placed (Fig. 10.3). Minor flow disturbances may be seen at the endarterectomy distal end point, but ordinarily, there should be no significantly elevated velocities or extreme flow disturbance. Modest flow disturbances seen early after CEA may disappear on subsequent studies owing to natural vessel remodeling.
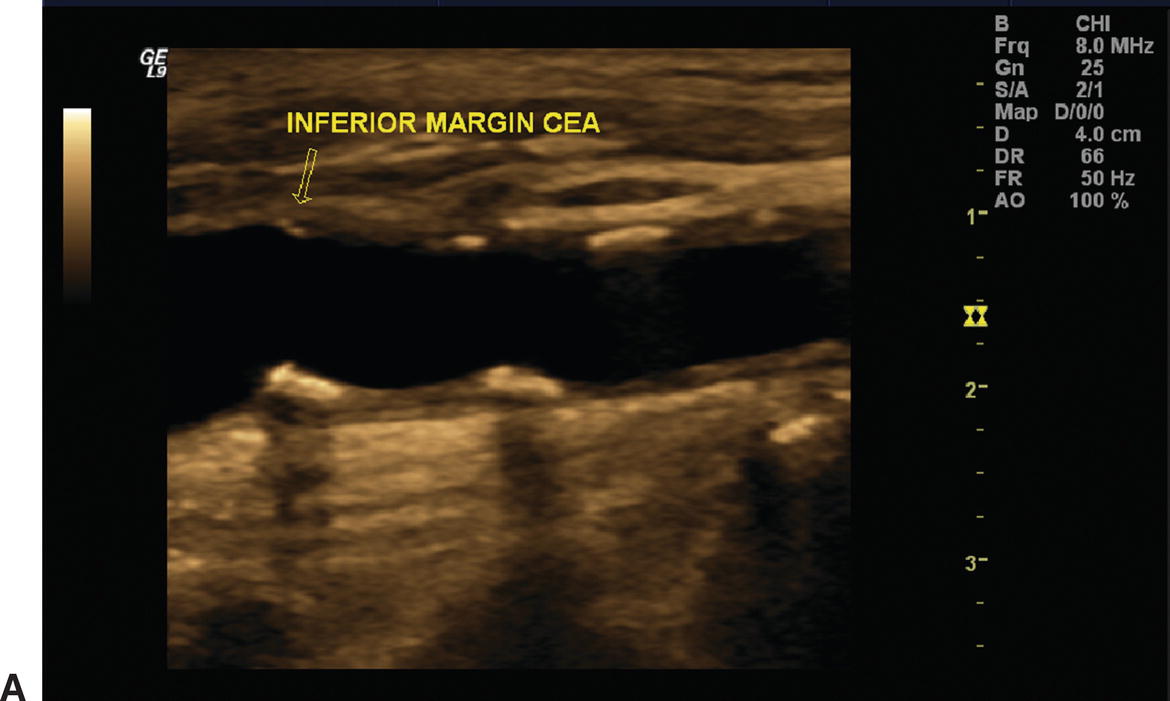
A,One month after carotid endarterectomy (CEA), modest amounts of plaque can be seen on this B-mode image in the common carotid artery proximal to the initiation point of the endarterectomy (arrow). B,B-mode image of a normal distal internal carotid artery (ICA) end point of a patched CEA 1 month postoperatively (arrow). The lumen appears widely patent.
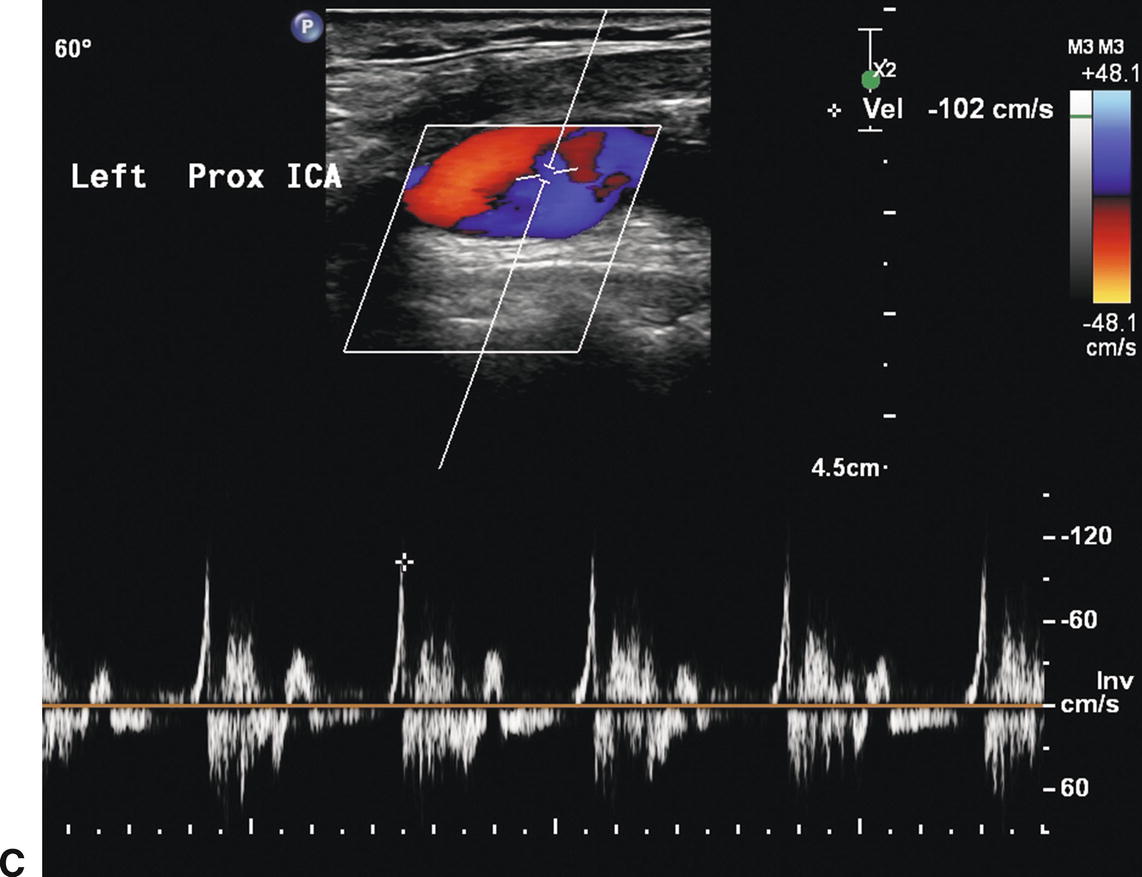
A,B-mode image of a patched internal carotid artery (ICA) 4 months after CEA. The widened lumen is clearly visible. B,Color flow image of the same patched ICA showing “swirling” or flow separation. C,Doppler spectral waveform from the patched ICA showing periods of forward and reverse flow during the cardiac cycle, characteristic of flow separation.
The endarterectomy suture line may be visible on B-mode imaging. Sutures appear as small, bright, regularly spaced echoes along the near wall of the vessel, as shown in Figure 10.4. Some surgeons apply stainless steel clips on small arteries and veins during the operation, and these small but highly echogenic objects may cause acoustic shadows that obscure portions of the underlying vessels. Flaps of tissue may be seen in the endarterectomized portion of the artery on intraoperative imaging (Fig. 10.5). Most large flaps that cause flow disturbances should be treated. The actual natural history of very small flaps in the endarterectomized segment remains poorly defined. Intraoperative assessment of CEA is discussed in Chapter 30.
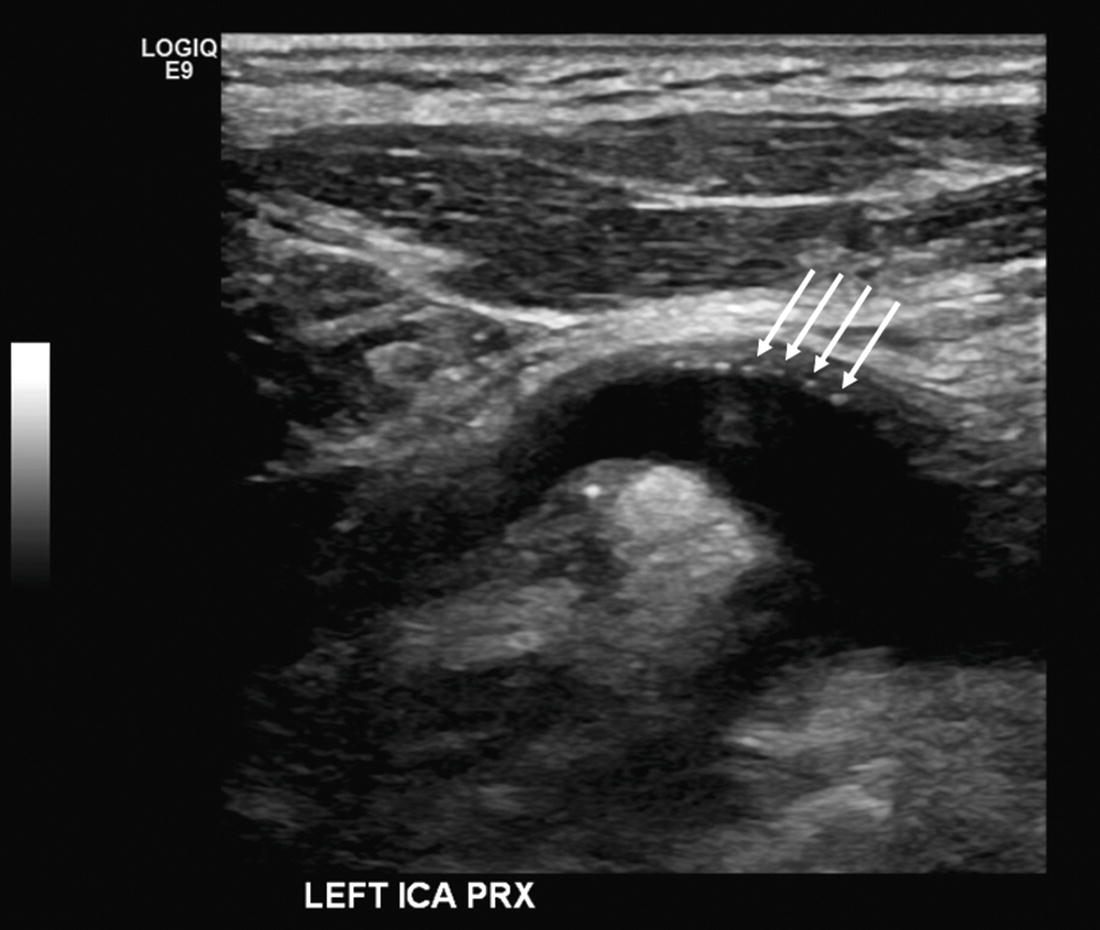
FIGURE 10.4. B-mode image of a patched internal carotid artery (ICA) showing sutures as bright “dots” on the near wall of the vessel (arrows).
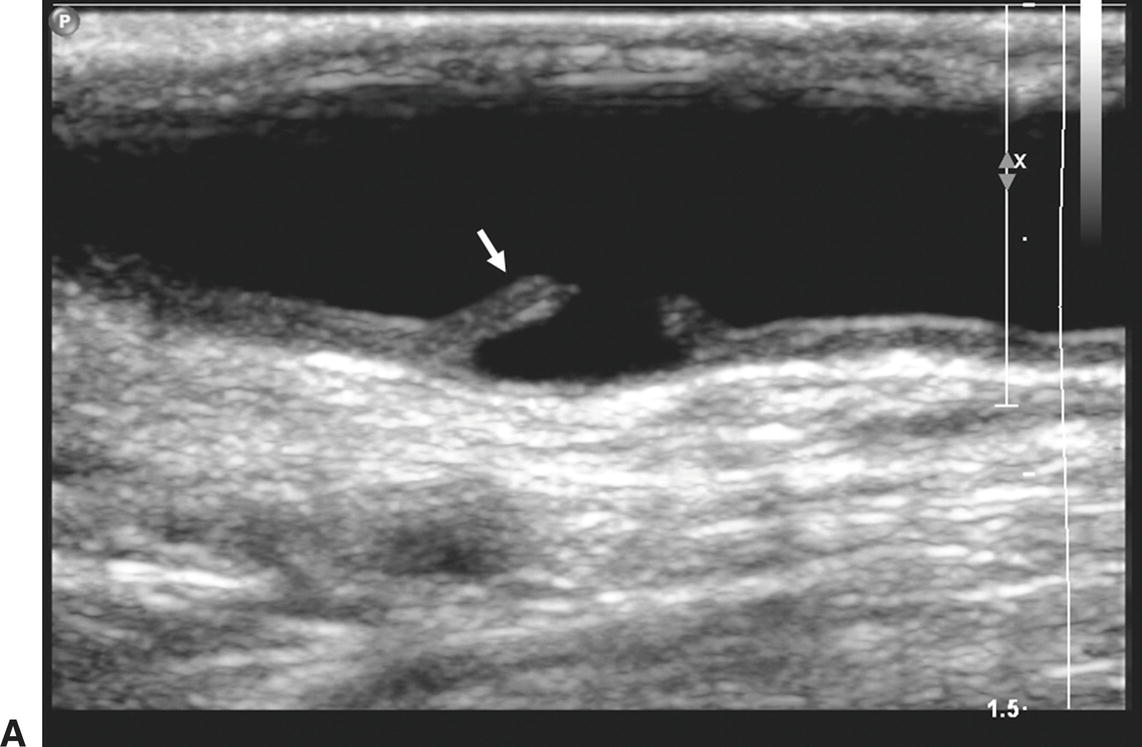
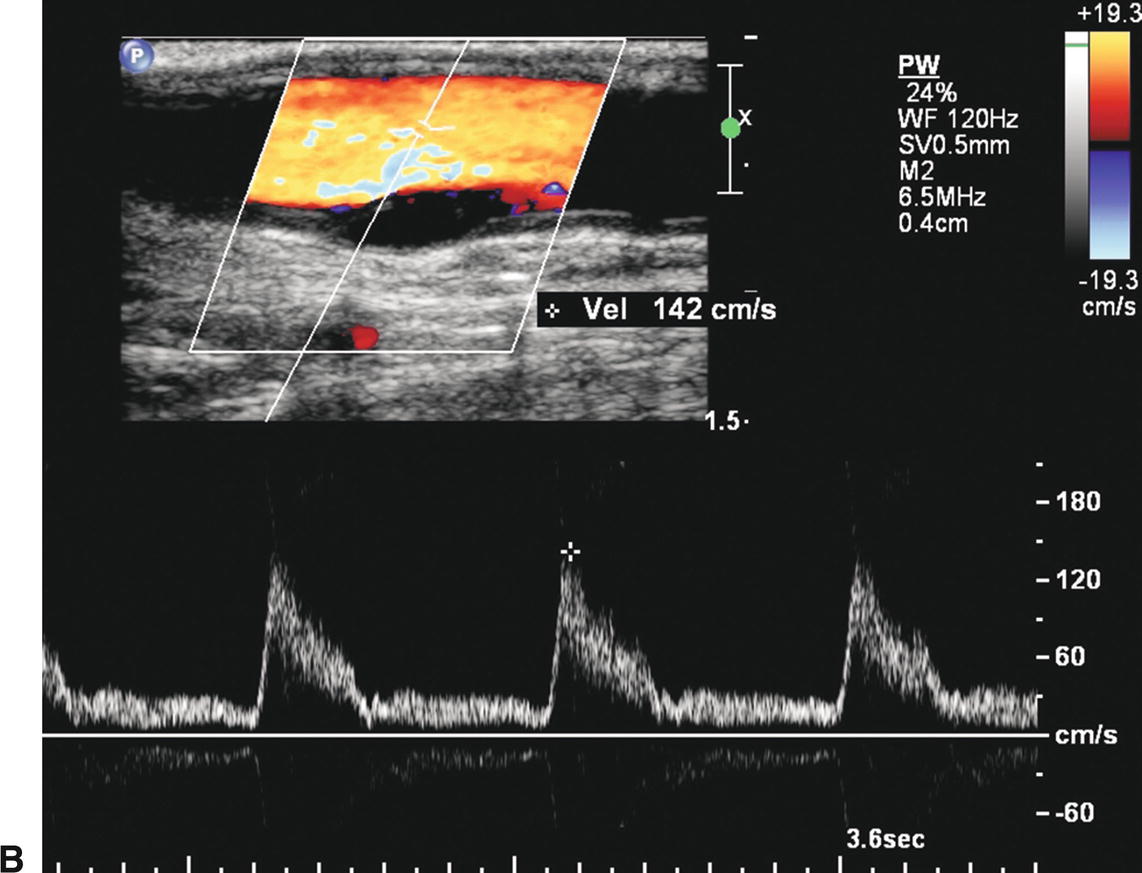
FIGURE 10.5. Intraoperative duplex assessment after carotid endarterectomy. A,Longitudinal B-mode image of a flap in the internal carotid artery (arrow). B,Color flow image of the same flap and a Doppler spectral waveform showing no significant flow disturbance associated with this finding.
Ultrasound visualization of a patch after CEA depends on the type of patch material used and the time interval after surgery. Polytetrafluoroethylene (PTFE) is often seen as a bright double-line interface on the near wall of the artery. Dacron patches are thick and also echogenic. If scanned during the first one or two days after surgery, the small amount of air trapped within the PTFE and Dacron material may cause acoustic shadowing and difficulty visualizing the vessel lumen. Autogenous saphenous vein and bovine pericardial patches may not be distinguishable from the native tissue, even in the early postoperative period, but the patched segment can be recognized by a bulging appearance over the endarterectomy site and the possible visualization of adjacent sutures (Figs. 10.3 and 10.4).
Restenosis that occurs in the endarterectomized segment during the first postoperative year is typically due to intimal hyperplasia. This is substantially different tissue than typical atherosclerotic plaque. Lacking any significant calcium deposits, the intimal hyperplastic lesion tends to be echolucent and commonly forms a long uniform narrowing (Fig. 10.6). Peak velocities may be extremely elevated throughout the stenotic segment. Restenosis that occurs 5 to 10 years postoperatively usually represents recurrent atherosclerotic plaque, particularly in an individual whose risk factors have not been successfully treated.
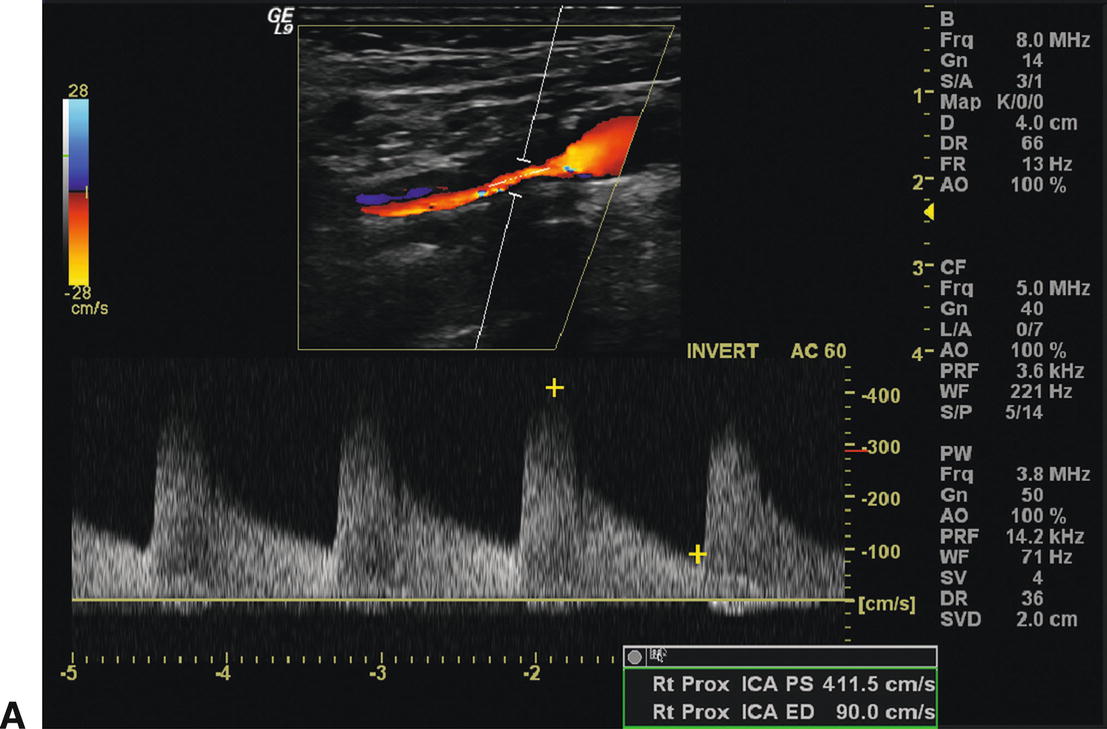
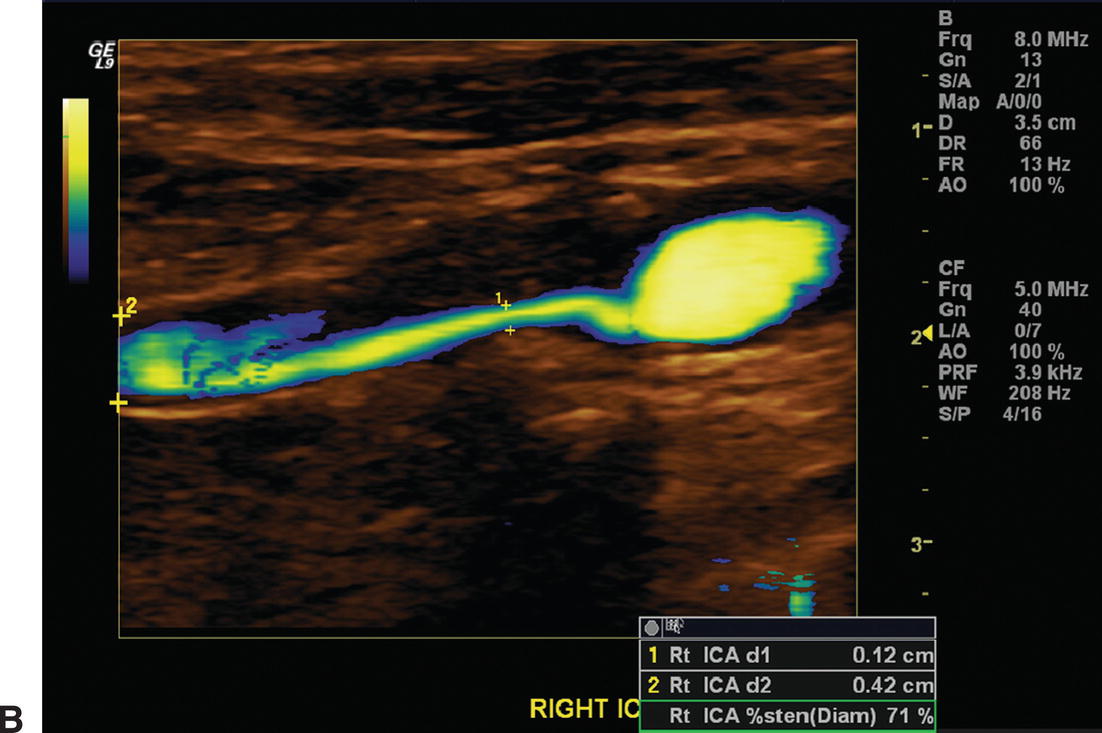
A,The color flow image shows a long segment of stenosis due to intimal hyperplasia in a right internal carotid artery 12 months after endarterectomy (top). Elevated peak systolic velocities (411 cm/s) and spectral broadening are apparent in the spectral waveform (bottom). B,Power Doppler image of the same intimal hyperplastic lesion seen in (A). The residual lumen appears to be 1.2 mm in diameter, although little literature support exists to assess the accuracy of this form of measurement.
Interpretation of Postoperative Velocity Changes
Reported experience supports the concept that classifying the severity of restenosis after CEA requires duplex criteria that are different from those for determining the severity of primary or native carotid artery disease. AbuRahma and associates reviewed 200 carotid operations performed between 2003 and 2005 with either PTFE or Dacron patch angioplasty closure, and the patients underwent duplex scans at 6-month intervals postoperatively, with 97% follow-up at a mean of 25 months.26 Conventional angiography or computed tomography angiography (CTA) were used as the “gold standard,” and the authors reported “very good” correlation between these two imaging modalities. These authors found that applying their standard PSV threshold of 140 cm/s to detect a 50% or greater stenosis resulted in a substantial incidence of false positives, meaning that the duplex diagnosis of a 50% or greater restenosis was not confirmed by angiography or CTA. This indicated that the standard PSV threshold for native carotid stenosis was too sensitive and not adequately specific for identification of restenosis after CEA. It was determined that an ICA PSV of greater than 213 cm/s was optimal by receiver operating characteristic (ROC) analysis for diagnosis of 50% or greater restenosis, with a sensitivity of 99% and a specificity of 100%. Similarly, this group’s native carotid PSV threshold for 70% or greater stenosis was overly sensitive for restenosis in patched carotid arteries, where the most accurate threshold was found to be a PSV of 274 cm/s or greater, providing 99% sensitivity and 91% specificity for detecting a 70% or greater restenosis as diagnosed by conventional angiography or CTA. AbuRahma and associates concluded that different carotid duplex velocity criteria should be used to detect restenosis after CEA when a patch closure has been performed.26
Although it may be true that intimal hyperplasia causing early restenosis in patched carotid arteries is less compliant and, therefore, results in a higher PSV at the same percentage of stenosis than does native atherosclerotic plaque, the alternative explanation relates to the duplex grading scales used for assessment of native carotid disease. A review of the literature demonstrates a wide range of apparently accurate duplex PSV thresholds for diagnosis of 70% or greater stenosis in native carotid arteries.27 The consensus conference document published in 2003 identified single-center “most accurate” PSV thresholds ranging from 130 to 325 cm/s.28 The highest PSV among those was from the vascular laboratory at Oregon Health & Science University.29 At Dartmouth University, a PSV of 340 cm/s was found to be the most accurate threshold for a 70% or greater stenosis in diseased native carotid arteries. Thus, the issue of variability persists in the search for the most accurate carotid duplex criteria for identifying recurrent stenosis after CEA with patch closure.
DUPLEX AFTER CAROTID ARTERY STENTING
The introduction of CAS into clinical practice again focused attention on the accuracy of duplex scanning for classifying the severity of carotid stenosis. The Centers for Medicare and Medicaid Services (CMS) approved coverage for CAS in 2005, but major restrictions were also imposed.30 The CMS National Coverage Determination (NCD) for CAS has been challenged several times, but it remains unchanged. As of March 2015, Medicare coverage for CAS is limited to individuals who suffer lateralizing hemispheric transient ischemic attacks or minor strokes. The beneficiary must also be considered high risk for standard surgical treatment with CEA, for either anatomic or physiologic reasons. Finally, in addition to these two criteria, Medicare CAS coverage is restricted to those patients who have an angiographically proven carotid stenosis of 70% or worse. CMS will also cover CAS when performed in accordance with FDA-approved investigational device exemption (IDE) clinical trials and FDA-approved postapproval studies.
All carotid duplex ultrasound stenosis assessments must be verified by carotid angiography prior to CAS. In its coverage decision memorandum, CMS has written: “The degree of carotid artery stenosis should be measured by duplex Doppler ultrasound or carotid artery angiography and recorded in the patient medical records. If the stenosis is measured by ultrasound prior to the procedure, then the degree of stenosis must be confirmed by angiography at the start of the procedure. If the stenosis is determined to be less than 70% by angiography, then CAS should not proceed.” Therefore, in order to avoid subjecting patients to unnecessary carotid angiography, it is increasingly important for all vascular laboratories to review the accuracy of their diagnostic parameters for advanced carotid stenosis.
Scanning the Stented Carotid Artery
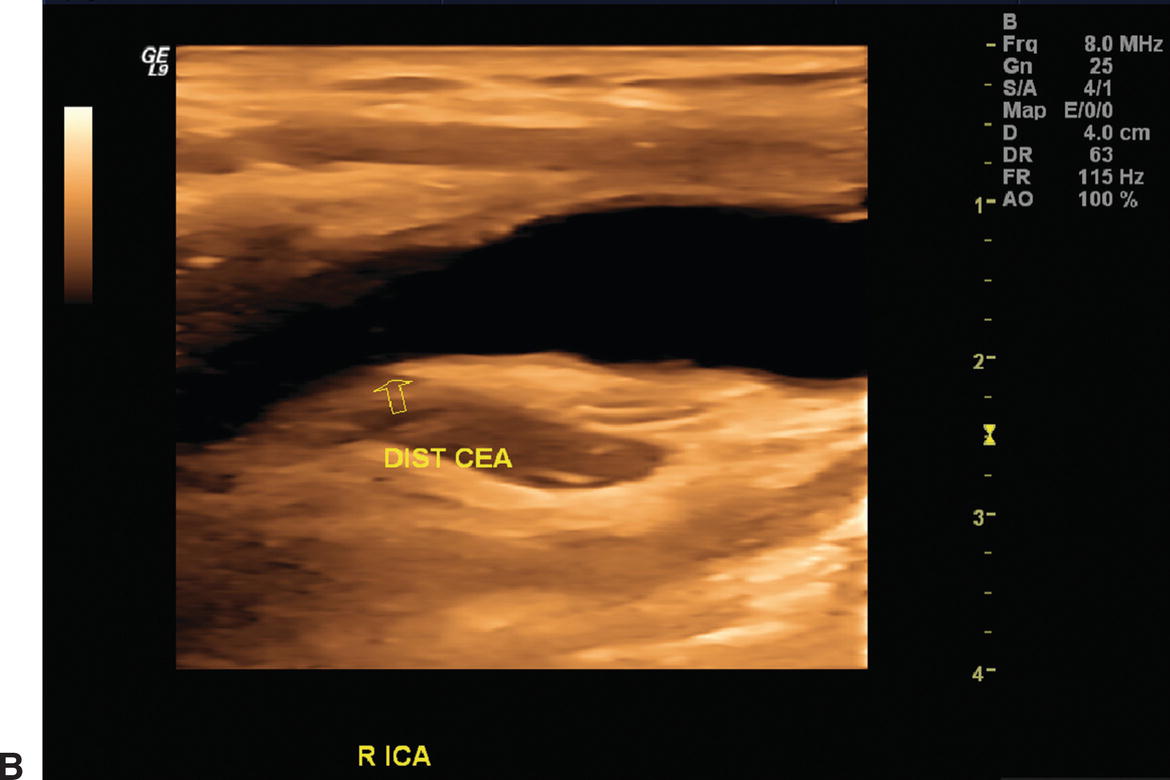
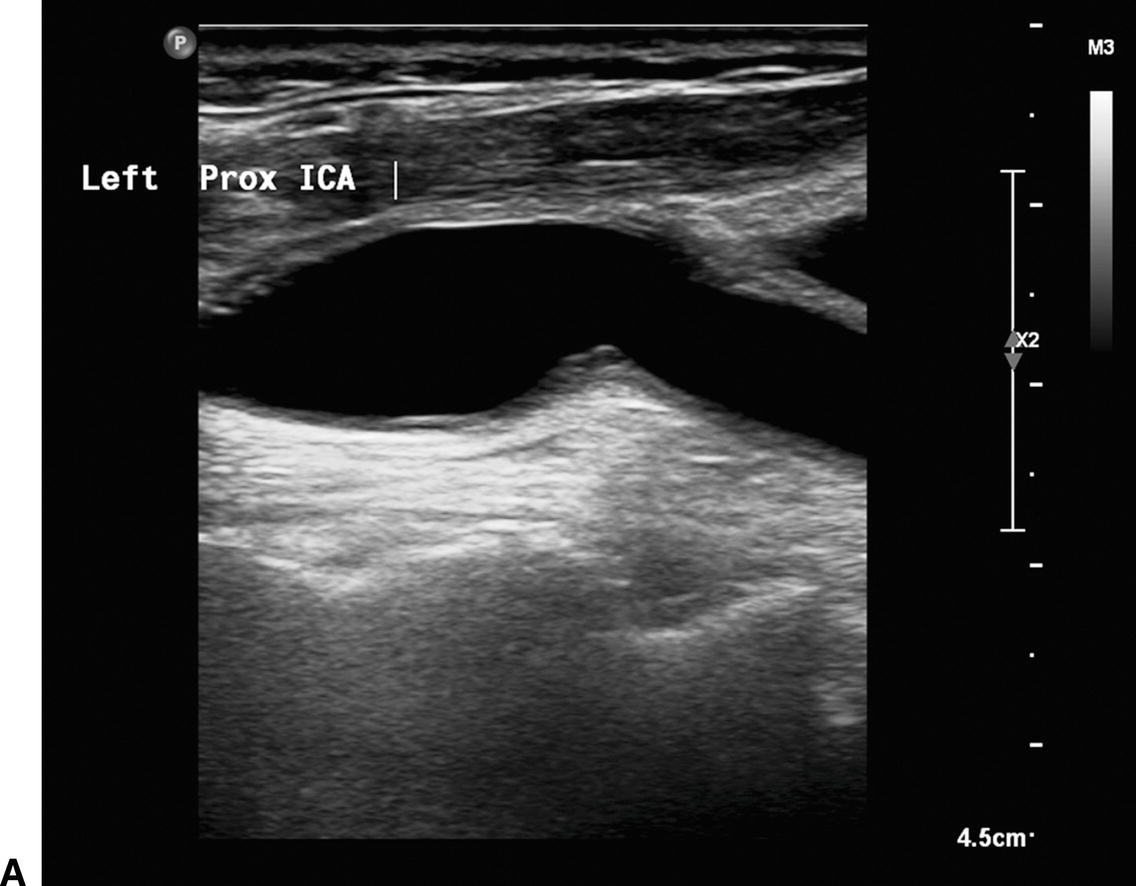
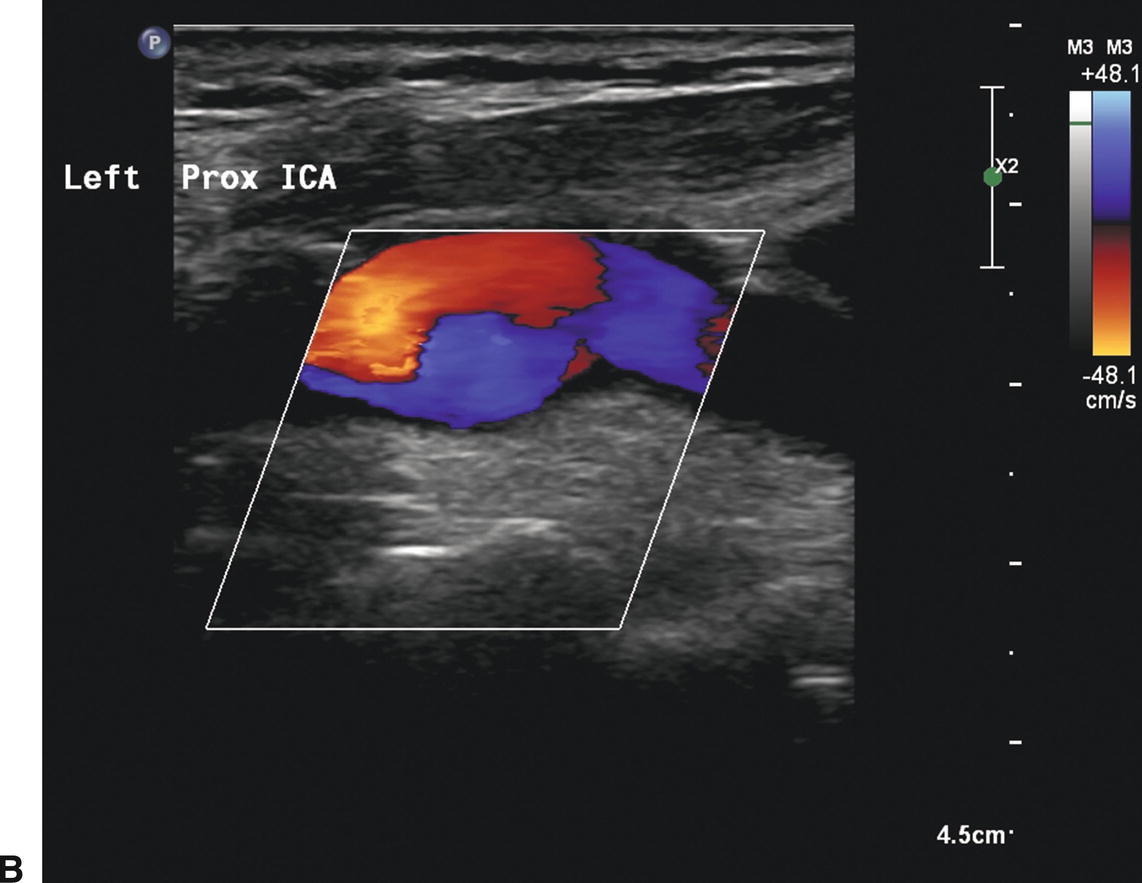
Restenosis after CAS appears to be infrequent. Hobson and coworkers31 followed 114 CAS procedures at 6-month intervals with a median follow-up of almost 2 years and identified 80% or greater diameter reduction in only 4 patients (3.8%). Iyer and colleagues21 found that 4.7% of CAS procedures in the BEACH trial were associated with a restenosis sufficiently severe to require reintervention. Gurm and associates32 reported that 2.4% of the CAS procedures in the original Stenting and Angioplasty with Protection in Patients at High Risk for Endarterectomy (SAPPHIRE) trial required target vessel revascularization at 3 years. Thus, like most patients who have undergone CEA, the carotid stent patient’s treated carotid artery is typically widely patent (Figs. 10.7 and 10.8). Most commonly, the proximal end of the stent lies in the distal CCA, with the distal end in the ICA and the stent traversing the origin of the external carotid artery. However, some patients receive stents that lie completely in the CCA, whereas a small minority undergo stent placement with a device located entirely in the ICA. Even when the external carotid origin is crossed by the stent, patency of this vessel is usually maintained by flow through the interstices of the stent (Fig. 10.9).
Many of the commonly used carotid stents are tapered (larger proximal diameter and smaller distal diameter) in order to more closely approximate the change in caliber that takes place from the CCA to the ICA (Fig. 10.10). The majority of patients receive only one stent. Stent deployment and apposition of the stent to the arterial wall can be assessed by B-mode imaging (Fig. 10.11). The presence of surrounding plaque, luminal narrowing, or intimal hyperplasia should also be noted. As shown in Figure 10.12, intimal hyperplastic lesions in carotid stents can be echolucent, and not well-visualized on B-mode imaging, making color flow imaging and Doppler spectral waveforms essential for diagnosis.
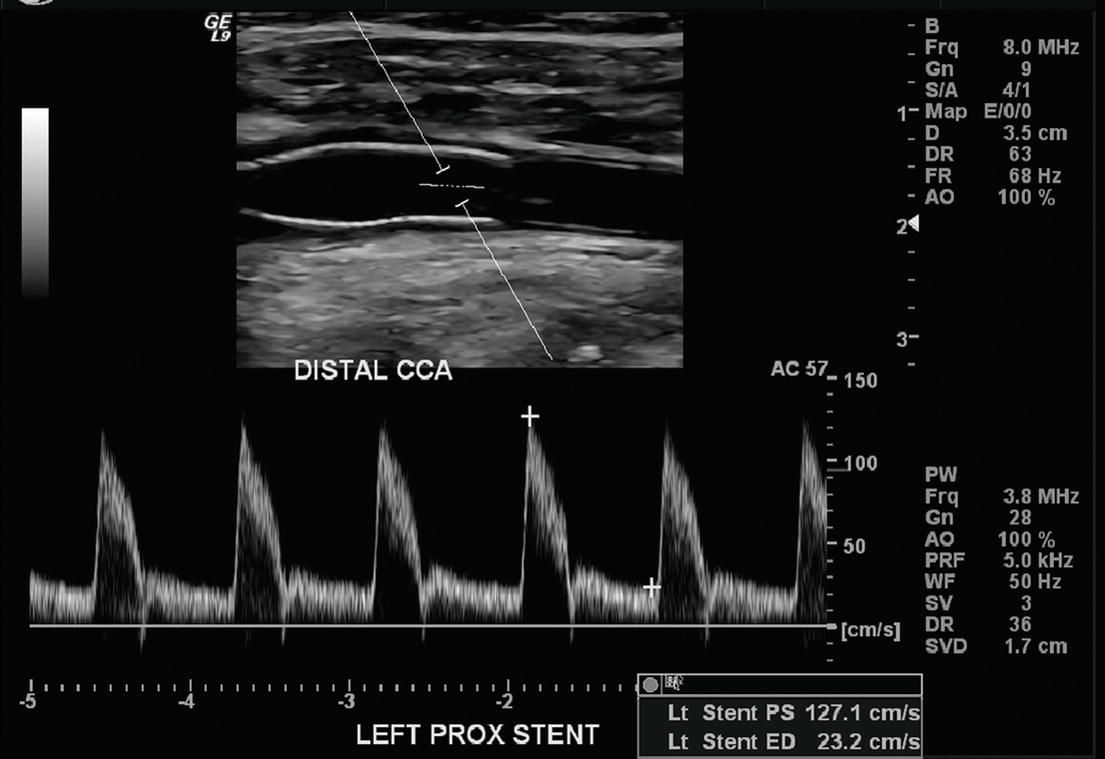
FIGURE 10.7. Top,B-mode image of a normal carotid stent with the proximal end in the common carotid artery (CCA). Bottom,Note the normal “narrow” Doppler spectral waveform with almost no spectral broadening.
Stay updated, free articles. Join our Telegram channel

Full access? Get Clinical Tree


