Focal Lung Disease
Although assessment of patients with focal lung abnormalities continues to represent an important problem in pulmonary diagnosis (1, 2, 3), the past decade has seen important developments both in hardware and in software applications that have transformed our approach to both the identification and especially the characterization of lung nodules. The introduction in particular of multidetector computed tomography (MDCT) scanners capable of high-resolution imaging of the entire thorax in a single breath-hold has revolutionized our evaluation of lung nodules. Of equal importance has been the development and continued clinical validation of 2-[fluorine-18]-fluoro-2-deoxy-D-glucose positron emission tomography (FDG-PET) scanning for providing uniquely physiologic data, further refining diagnosis. Finally, paralleling these developments has been the growing availability of advanced imaging workstations allowing routine use of increasingly sophisticated postprocessing techniques such as automated volumetric assessment as well as a potential role of computer-aided diagnosis (CAD) and characterization (CADx) to further refine and enlarge our diagnostic armamentarium.
Despite these technologic innovations, however, and considerable advances in biopsy techniques, controversy persists concerning optimal evaluation and management of these cases, with ongoing controversy regarding the definition of standard of care. For the purposes of this chapter, evaluation of pulmonary nodules is considered under the umbrella of focal lung disease, as many of the features pertinent to lung nodule evaluation also pertain to this more inclusive category. The topic of lung cancer screening is dealt with separately in Chapter 7. In an attempt to organize this vast topic, our approach is to consider three separate, albeit overlapping, categories: detection, characterization, and management.
Detection
Failure to recognize lung cancer on routine chest radiographs (CXRs) is one of the most frequent causes of missed diagnosis in radiology, frequently resulting in a significant delay in diagnosis (4). Quekel et al. (5) looked at CXRs retrospectively in 259 patients with proven non–small cell lung cancer (NSCLC) and found a 19% incidence of missed diagnosis. Those patients with missed lesions had significantly smaller nodules (median diameter 16 mm), with indistinct borders frequently obscured by overlying osseous structures. Most important, missed lesions led to a significant delay in diagnosis when compared with lesions initially correctly diagnosed (472 vs. 29 days, respectively), resulting in 43% of lesions being upstaged from TI to T2 lesions during the delay period.
From the outset, it has been appreciated that CT leads to the earlier identification of lung nodules, further
improved with the introduction of spiral CT (6, 7, 8, 9). With CT, the ability to detect lung nodules is contingent on a number of factors. These include variations between scanners and scan techniques, variations in nodule characteristics, and interobserver variability. Advantages first identified resulting from single-detector (SD) CT scanners included reduction in the time of examination as well as the ability to obtain overlapping thin CT sections without the need to obtain additional scans (10,11).
improved with the introduction of spiral CT (6, 7, 8, 9). With CT, the ability to detect lung nodules is contingent on a number of factors. These include variations between scanners and scan techniques, variations in nodule characteristics, and interobserver variability. Advantages first identified resulting from single-detector (SD) CT scanners included reduction in the time of examination as well as the ability to obtain overlapping thin CT sections without the need to obtain additional scans (10,11).
As spiral CT technology has evolved from SD to 4-, 16-, and 64-detector rows, the number of nodules that are routinely identified has significantly increased (Fig. 6-1). Although nodules have been reported to occur in up to 45% of individuals screened for lung cancer using single-slice low-dose computed tomography (LDCT) with 5-mm collimation (12), more recent reports using MDCT show that nodules may be routinely identified in greater than 60% of individuals (13,14). Similarly, McWilliams et al. (13), in a lung cancer CT screening study that compared the results of a total of 332 baseline CT scans performed with an SD CT scanner using 7-mm collimation with 229 studies performed either with a 4 or 8 MDCT scanner using 1.25-mm collimation, found that abnormal scans were reported twice as frequently with MDCT (60 vs. 36%, respectively, p <0.001).
Despite well-documented improvements in nodule detection with MDCT, paradoxically, missed nodules on CT remain a frequent occurrence (Fig. 6-2) (15, 16, 17, 18, 19, 20). Of particular concern is the potential for overlooking small lung cancers. Hazelrigg et al. (21), for example, in a study of 281 patients undergoing lung reduction surgery for emphysema, found that of 17 (22%) of 78 lung nodules subsequently proved to be malignant surgically, 14 retrospectively proved to have false-negative CT studies.
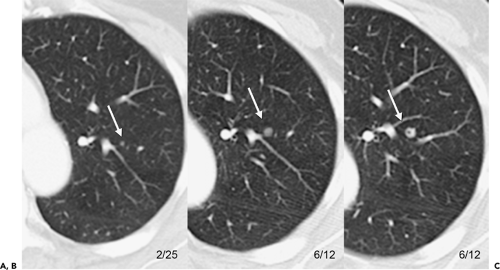 Figure 6-1 Improved nodule detection with multidetector computed tomography (MDCT). A: Target reconstructed 1-mm image through the left mid lung shows a subtle central lung nodule (arrow). This lesion would easily have been overlooked with routine thick-section axial images. B, C: Target reconstructed images at the same level as shown in A; several months later the presence of a malignant cavitary nodule is confirmed (arrows in B and C), in this case from squamous cell carcinoma of the head and neck. |
It is worth noting that the causes of missed nodules on CT are quite distinct from those identified as causes for missed nodules on routine CXRs. In a recent review of 40 NSCLCs seen only retrospectively between 1993 and 2001, the most common causes for missed cancers included upper lobe distribution (with right-sided lesions occurring in 45% compared with 28% on the left side), location in the apical and posterior segments or subsegments (60%), and obscuration by an overlying clavicle (22%) (22). The mean diameter of missed lesions in this study proved to be 1.9 cm, considerably larger than on CT.
Reasons for missing nodules on CT include both detection errors and misinterpretation. Causes of detection errors include factors related to scan technique (use of thin vs. thick sections) (23, 24, 25), contiguous versus overlapping sections (9,11), or data compression (26), for example; factors related to nodule characteristics (e.g., nodule density, location, relation to adjacent structures, and edge
characteristics) (27); and factors related to interobserver variability (20). In this latter category are “missed” nodules due to interpretative errors that occur because of differences among individual readers’ thresholds for dismissing abnormalities as “trivial” (19).
characteristics) (27); and factors related to interobserver variability (20). In this latter category are “missed” nodules due to interpretative errors that occur because of differences among individual readers’ thresholds for dismissing abnormalities as “trivial” (19).
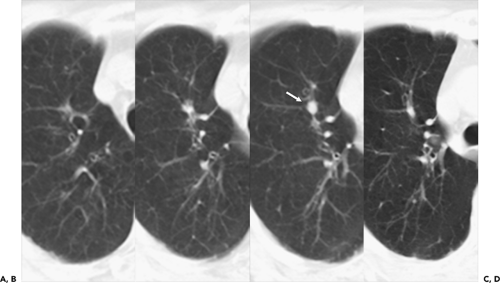 Figure 6-2 Missed lung cancer. A, B: Magnified contiguous views through the medial aspect of the right upper lobe shows a tiny, poorly marginated opacity barely discernible, not initially identified. C, D: Magnified views at the same level as A and B obtained approximately 3 months later show the presence of a rapidly growing lung nodule (arrow in C). Pathologically confirmed stage 1A lung cancer. |
This wide variety of causes is reflected in numerous published reports. Swensen et al. (15), in an evaluation of annual incidence screening CT scans, found that, in 26% of patients, missed nodules could be retrospectively identified (Fig. 6-2). Similar findings also have been reported by Heinschke et al. (18) for missed nodules on low-dose screening CT studies. Kakinuma et al. (19), in an evaluation of missed nodules in a screened population, demonstrated seven overlooked nodules that proved to lie adjacent to regions of the lung scarred by prior inflammation (n = 2), to have ground-glass attenuation (n = 3), or to be located adjacent to pulmonary vessels (n = 2). White et al. (17), in a retrospective review, demonstrated that nodules were often missed either when endobronchial or when located in the lower lobes. In the most detailed evaluation of the causes of missed nodules to date, Rusinek et al. (27) demonstrated reduced sensitivity for detecting simulated nodules on LDCT scans when central versus peripheral (58% vs. 74%, for nodules with and without vessels attachments, respectively). Not surprisingly, smaller nodules also proved more difficult to identify, with sensitivities for nodules measuring 3 mm, 5 mm, and 7 mm of 37%, 62%, and 80%, respectively.
In addition to limitations related to technique and nodule characteristics, problems with interobserver variability have also long been noted. In one early study, for example, the value of CT in staging 202 patients with Wilms’ tumors and normal CXRs was assessed by three independent observers (28). Although the three observers identified a total of 78 nodules, only 19 (24%) of these nodules were identified by all three readers. Of still greater concern, only 14 of the 202 patients actually developed documented pulmonary disease. Of these 14, only 5 had nodules identified by all three readers; furthermore, in five other cases, CT studies were interpreted as normal by all three readers.
Although differences in the level of reader expertise have often been cited to account for interobserver variability, this factor alone cannot account for the wide differences in readers’ interpretations. In a retrospective evaluation of 116 nodules comparing contiguous versus overlapping 8-mm sections using four reviewers of varying interpretative skill, for example, Buckley et al. (10) showed that, although overlapping 8-mm sections significantly improved sensitivity (p <0.055) and decreased the number of false-positive interpretations, nonetheless a total of 58 false-positive studies were still recorded by even the most experienced interpreters.
More recently, in a comparison of the sensitivity of single versus double readings of standard (SDCT) and LDCT MDCT studies, of 390 nodules identified in nine patients with documented pulmonary metastases, the average sensitivity for detection of nodules significantly increased with double readings (63% and 64% vs. 74% and 79% for standard-dose CT and LDCT studies, respectively) (20). As important, only 47% and 52% of nodules identified with LDCT and standard-dose CT, respectively, were concordantly identified by all readers.
In an attempt to improve nodule detection, interest has focused on the use of a number of alternative image processing techniques. The best documented of these makes use of contiguous or sliding maximum intensity projection (MIP) images reconstructed from sequential 1- to 3-mm source images (Fig. 6-3) (29,30). Unlike routine cine viewing (31,32), sliding MIPs take advantage of high-resolution data without requiring readers to scroll through hundreds of thin-section axial images as may routinely be reconstructed, especially with newer MDCT scanners (33). In a study comparing the number of pulmonary nodules identified by MIPs with the number identified by routine contiguous axial images, Diederich et al. (29) showed that MIPs using a slab thickness of 15 mm outperformed 5-mm axial image evaluation as well as improved readers’ confidence in identifying “definite” nodules. As documented by Gruden et al. (30), the addition of 8-mm axial MIP slabs reconstructed from 3.75-mm axial CT sections reconstructed at 3-mm intervals led to a significant improvement in the detection of central nodules, in particular, for all readers regardless of their level of expertise, and the detection of even peripheral nodules by less experienced readers. These data support the idea that newer methods of interrogating large datasets will be requisite to make optimal use of the volume of information now routinely available with MDCT. In this regard, as discussed in greater detail later in this chapter, considerable interest has focused on the use of CAD in detecting lung nodules (34).
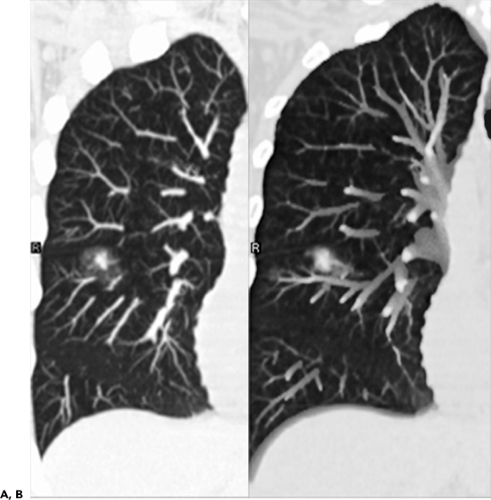 Figure 6-3 Advanced image processing: maximum intensity projection (MIP) images and volumetric renderings. A, B: Magnified 5-mm MIPs and volumetrically rendered coronal images through the right mid lung, respectively, show a nodule in the right lower lobe to good advantage. Compared with routine axial images, MIPs and volumetric rendered images allow rapid interrogation of large datasets routinely acquired with MDCT scanners. |
Magnetic Resonance Imaging
The potential for magnetic resonance (MR) to detect pulmonary nodules is limited because of inferior spatial
resolution as compared with CT. Nonetheless, MR does present some advantages that in select cases may allow identification of lesions with more certainty than CT. As noted by Müller et al. (35), in an early study of 25 patients evaluated with both CT and MR using T2-weighted sequences, whereas CT allowed more precise identification of small nodules, MR was superior for detecting lesions adjacent to blood vessels. Feuerstein et al. (36), in a prospective study comparing CT with MRI in the evaluation of 12 cases of suspected pulmonary metastases with surgical correlation, found that MR and CT were equivalent for classifying patients as having positive or negative status for metastatic disease: surprisingly, this also proved true for individual nodules as well. Given the greater contrast resolution of MR, it is perhaps not surprising that MR would perform so well, especially in the detection of central or perihilar nodules (37). As reported by Doppman et al. (38) in an early study, MR was shown to be of value in detecting small, centrally located adrenocorticotrophic hormone–producing bronchial carcinoid tumors. More recently, Schroderer et al. (39), comparing a two-dimensional (2D) half-Fourier single shot turbo spin-echo (HASTE) MR sequence with MDCT as a gold standard to evaluate 30 patients with known pulmonary metastases, reported MR sensitivity of 73% for lesions less than 3 mm, 86.3% for lesions between 3 and 5 mm, and 95.7% for lesions between 6 and 10 mm. Despite these findings, given the advantages of greater spatial resolution and the ability to detect calcification, it is likely that MDCT will remain the method of choice for detecting pulmonary nodules for the foreseeable future.
resolution as compared with CT. Nonetheless, MR does present some advantages that in select cases may allow identification of lesions with more certainty than CT. As noted by Müller et al. (35), in an early study of 25 patients evaluated with both CT and MR using T2-weighted sequences, whereas CT allowed more precise identification of small nodules, MR was superior for detecting lesions adjacent to blood vessels. Feuerstein et al. (36), in a prospective study comparing CT with MRI in the evaluation of 12 cases of suspected pulmonary metastases with surgical correlation, found that MR and CT were equivalent for classifying patients as having positive or negative status for metastatic disease: surprisingly, this also proved true for individual nodules as well. Given the greater contrast resolution of MR, it is perhaps not surprising that MR would perform so well, especially in the detection of central or perihilar nodules (37). As reported by Doppman et al. (38) in an early study, MR was shown to be of value in detecting small, centrally located adrenocorticotrophic hormone–producing bronchial carcinoid tumors. More recently, Schroderer et al. (39), comparing a two-dimensional (2D) half-Fourier single shot turbo spin-echo (HASTE) MR sequence with MDCT as a gold standard to evaluate 30 patients with known pulmonary metastases, reported MR sensitivity of 73% for lesions less than 3 mm, 86.3% for lesions between 3 and 5 mm, and 95.7% for lesions between 6 and 10 mm. Despite these findings, given the advantages of greater spatial resolution and the ability to detect calcification, it is likely that MDCT will remain the method of choice for detecting pulmonary nodules for the foreseeable future.
Characterization
Although differentiating benign from malignant nodules remains problematic, recent improvements in morphologic classification, contrast-enhanced densitometry, techniques for more accurate assessment of nodule growth, and especially use of FDG-PET scanning have redefined our approach to the problem of the indeterminate lung nodule.
Definition
Various authors have applied a wide range of restrictions on what constitutes a solitary nodule. However, any patient whose CXR shows a single rounded or ovoid lesion in the lung parenchyma less than 3 cm, which is not associated with atelectasis or pneumonia, must be considered to have a solitary pulmonary nodule (SPN). The term coin lesion was suggested by O’Brien et al. (40) to describe a focal mass. The term enjoyed a short-lived popularity but has since been disparaged because the description implies a flattened object instead of a spherical mass. SPN should be considered the most appropriate designated name for such lesions (41,42).
Clinical Evaluation
In the evaluation of pulmonary nodules, a number of clinical and historical data should be considered (43). In addition to age and smoking history, these include occupational exposure, especially to asbestos, as well as the presence of coexisting parenchymal disease, for example, idiopathic pulmonary fibrosis (IPF); a known prior malignancy; geographic considerations, including travel history; and results of diagnostic tests, especially skin testing (1, 2, 3).
Of these, probably the most reliable is assessment of age. SPNs are almost invariably benign in patients younger than 30 years. Taylor et al. (44) resected 81 nodules in patients aged 20 to 29 years and found 1 bronchogenic carcinoma, 1 “bronchial adenoma,” and 79 benign lesions, including 67 granulomas. Thus, unless there is a known primary malignancy, solitary lesions in patients younger than 30 years may be presumed to be benign, although definitive diagnosis may still be requisite. In distinction, pulmonary malignancies should not be considered rare in the 30- to 39-year-old age group. Among 39 lesions resected in this age group, Davis et al. (45), found 9 bronchogenic carcinomas. At age 40 and beyond, there is greater probability of malignancy in any newly discovered SPN. Given that nearly 90% of these lesions may prove resectable, early diagnosis remains essential.
SPNs are a common finding on routine CXRs in adults. Although traditionally the vast majority of such incidentally detected lesions are benign (46,47), lung cancer, particularly early treatable lesions, often manifests as a peripheral pulmonary nodule, especially in asymptomatic patients (41). In an extensive review of 1,267 lung cancers by Theros (48), 507, or 40% of cases, initially presented as peripheral lung masses. Not surprisingly, considerably higher prevalence of malignant nodules has been reported in clinical studies of patients specifically referred for nodule evaluation. In this setting, estimates of the prevalence of cancer may be as high as 70%, presumably reflecting differences due to referral bias (49).
Nearly as important as age as a predictor of malignancy is smoking history. Stitik and Tockman (50), in an early surveillance study of male smokers, found that 72% of the cancers detected in asymptomatic subjects were peripheral nodules. It should be noted that these data do not take into account the recently documented increase in the prevalence of adenocarcinoma, in particular, developing in women as a consequence of changed cigarette smoking demographics (51). The use of chest radiography for evaluating asymptomatic smokers has been most recently assessed in a large-scale screening study—the Prostate, Lung, Colorectal and Ovarian (PLCO) Cancer Screening Trial (52). Altogether, a total of 77,465 individuals aged 55 to 74 years without prior history of malignancy (including smokers, prior smokers, and never smokers) were evaluated in this study with a single-view
posteroanterior (PA) CXR. Of these, 5,991 (8.9%) were interpreted as suspicious for cancer (9.6% for men; 8.2% for women), with the highest rates recorded for older individuals and smokers (52). Of these, 206 (3.4%) subsequently underwent biopsy, with 126 (61%) shown to have lung cancer, 44% of which were stage 1 NSCLCs. Although, overall, 1.9 lung cancers were detected per 1,000 screens, the rate clearly reflected smoking status, with current smokers, former smokers, and nonsmokers having rates of 6.3, 4.9, and 0.4 lung cancers detected per 1,000 screens, respectively. In all, nonsmokers accounted for 11% of lung cancers detected, including 12 adenocarcinomas and 2 carcinoid tumors. All save 2 of these were identified in women. As discussed in depth in Chapter 7, it should be noted that, although most lesions in this study proved to be potentially resectable, the value of screening (both radiographic and CT) remains to be determined.
posteroanterior (PA) CXR. Of these, 5,991 (8.9%) were interpreted as suspicious for cancer (9.6% for men; 8.2% for women), with the highest rates recorded for older individuals and smokers (52). Of these, 206 (3.4%) subsequently underwent biopsy, with 126 (61%) shown to have lung cancer, 44% of which were stage 1 NSCLCs. Although, overall, 1.9 lung cancers were detected per 1,000 screens, the rate clearly reflected smoking status, with current smokers, former smokers, and nonsmokers having rates of 6.3, 4.9, and 0.4 lung cancers detected per 1,000 screens, respectively. In all, nonsmokers accounted for 11% of lung cancers detected, including 12 adenocarcinomas and 2 carcinoid tumors. All save 2 of these were identified in women. As discussed in depth in Chapter 7, it should be noted that, although most lesions in this study proved to be potentially resectable, the value of screening (both radiographic and CT) remains to be determined.
Patients with a history of extrathoracic malignancies clearly pose a particular diagnostic problem, especially given the prevalence of small, less than 10-mm, nodules in the general public. These are difficult to perform biopsy on percutaneously and may be difficult to palpate at surgery, especially when central. In this context, clinical correlation can be of value. The propensity of certain tumors to metastasize to the lungs, in particular, varies and should be taken into account. Gilbert and Kagan (55), for example, have studied the estimated incidence of lung metastases for various primary neoplasms at presentation and autopsy. In their study, those tumors most likely to metastasize to the lung included choriocarcinoma, renal cell carcinoma, and bone and soft tissue sarcomas, in particular. A similar propensity for sarcomas, as compared with carcinomas, to metastasize to the lungs has been documented by Peuchot and Libshitz (54).
Morphologic Evaluation
By virtue of unobstructed visualization of the lungs and improved contrast resolution compared with routine CXRs, CT not only allows exquisite definition of the density, shape, and edge characteristics of focal lung lesions but also enables assessment of the relationship between lesions and surrounding structures, including airways, vessels, and pleural surfaces. As a consequence, CT has become the standard method for initial characterization of lesions either suspected or seen on corresponding CXRs. Acknowledging that optimal evaluation of the malignant versus benign potential of focal lesions requires assessing all pertinent imaging features in concert, for the purposes of this chapter the following features pertaining to nodule morphology are discussed independently: nodule density, edge characteristics, size, and location. Subsequent sections focus on the use of both CT and MR contrast enhancement, FDG-PET imaging, and techniques for measuring nodule growth.
Density
Optimal evaluation of nodules requires determination of nodule density, including differentiating between subsolid and solid nodules, as well as identifying the presence and pattern of calcifications, fat, air, and fluid (Table 6-1).
Subsolid Versus Solid Lung Nodules
Largely the result of early lung cancer screening trials coupled with the widespread availability of MDCT scanners capable of providing contiguous high-resolution images throughout the thorax in a single breath-hold period, it is now appreciated that noncalcified pulmonary nodules are best characterized as either subsolid or solid in appearance (55). Subsolid nodules may be further divided into pure ground-glass nodules (focal densities in which underlying lung morphology is preserved) and mixed solid/ground-glass nodules.
To date, numerous reports have shown that there is a close but imperfect correlation between pure ground-glass lesions and either atypical adenomatous hyperplasia (AAH)
or true bronchoalveolar cell carcinoma (BAC), corresponding to Noguchi classification types A and B (Fig. 6-4) (56, 57, 58, 59, 60, 61, 62, 63, 64). As discussed in greater detail in Chapter 7, Noguchi et al. (65) proposed a new classification of adenocarcinomas based on a review of pathologic features of 236 cases of adenocarcinomas less than 2 cm. Briefly, types A and B correspond to true BACs characterized by pure lepidic growth in the absence of active fibroblastic proliferation, whereas type C corresponds to a mixed-type adenocarcinoma [as defined by the new World Health Organization (WHO) classification] (66), defined as having bronchoalveolar features as well as active fibroblastic proliferation. As originally defined, types A, B, and C together were referred to as “replacement tumors” and ostensibly represented progression from truly localized tumors to a more invasive form. Types D to F, in distinction, represent progressively more invasive, poorly differentiated adenocarcinomas without BAC features and likely arose de novo (65,67). Using this classification, Noguchi found significant differences in prognosis, with types A and B having a 100% 5-year survival; type C tumors, with a higher percentage of nodal and distal metastases, having a 75% 5-year survival; and types D to F having a still worse prognosis, with 5-year survivals of approximately 50%.
or true bronchoalveolar cell carcinoma (BAC), corresponding to Noguchi classification types A and B (Fig. 6-4) (56, 57, 58, 59, 60, 61, 62, 63, 64). As discussed in greater detail in Chapter 7, Noguchi et al. (65) proposed a new classification of adenocarcinomas based on a review of pathologic features of 236 cases of adenocarcinomas less than 2 cm. Briefly, types A and B correspond to true BACs characterized by pure lepidic growth in the absence of active fibroblastic proliferation, whereas type C corresponds to a mixed-type adenocarcinoma [as defined by the new World Health Organization (WHO) classification] (66), defined as having bronchoalveolar features as well as active fibroblastic proliferation. As originally defined, types A, B, and C together were referred to as “replacement tumors” and ostensibly represented progression from truly localized tumors to a more invasive form. Types D to F, in distinction, represent progressively more invasive, poorly differentiated adenocarcinomas without BAC features and likely arose de novo (65,67). Using this classification, Noguchi found significant differences in prognosis, with types A and B having a 100% 5-year survival; type C tumors, with a higher percentage of nodal and distal metastases, having a 75% 5-year survival; and types D to F having a still worse prognosis, with 5-year survivals of approximately 50%.
Table 6-1 Computed Tomography Densitometry in Evaluation of Focal Lung Disease | ||||||
|---|---|---|---|---|---|---|
|
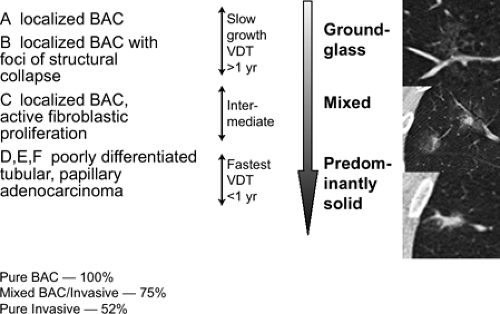 Figure 6-4 Adenocarcinoma: CT-pathologic correlations. This figure shows the relationship between the Noguchi classification of primary adenocarcinomas of the lung and the corresponding CT appearances of these lesions. AAH, atypical adenomatous hyperplasia; BAC, bronchoalveolar cell carcinoma. Note that as lesions become more invasive, their doubling times become shorter, and their CT appearance changes from pure ground-glass opacities to mixed ground-glass/solid lesions and predominantly solid lesions, respectively. As noted in the figure, pure BAC has a 100% 5-year survival, decreasing to 52% for purely invasive adenocarcinomas. |
To date, numerous studies have positively correlated CT findings with Noguchi’s classification. Kim et al. (67a), for example, in a study of 224 patients (132 with BAC, 92 with adenocarcinoma), showed that the extent of ground-glass opacity identified by CT was greater in BAC than in other adenocarcinomas (p <0.001). Small ground-glass lesions, in particular, are likely to represent either foci of AAH or pure BACs (Figs. 6-5 and 6-6). Nakata et al. (68) showed that only 7% of tumors less than 1 cm with a pure ground-glass pattern proved to be mixed adenocarcinomas; the remaining were all BACs.
Mirtcheva et al. (61), correlating CT with pathologic findings in 29 patients (15 with Noguchi type A and B tumors, 14 with type C tumors), also reported close correlation between the appearance of lesions on CT and their pathologic appearance. Specifically using a classification of ground-glass opacities suggested by Gaeta et al. (69), these authors noted the finding of lesions appearing as pure ground-glass opacities, with or without air bronchograms or with surrounding ground-glass “halos,” were predictive of type A and B BACs, whereas mixed solid/ground-glass lesions (Fig. 6-7) or those with superimposed reticulation (Fig. 6-8) were highly predictive of invasive (type C) adenocarcinomas (61).
Not surprisingly, these authors and others have also reported good correlation between the extent of ground-glass attenuation and prognosis (Figs. 6-6, 6-7, 6-8, 6-9, 6-10) (70, 71, 72). Takashima et al. (72), for example, in a study correlating lesion size, percentage of ground-glass opacity, and air bronchograms with clinical data and pathologic findings in 52 consecutive patients with adenocarcinoma with BAC components less than 3 cm, documented a significant difference in prognosis based on the extent of ground-glass attenuation (p = 0.043) as well as the presence of an air bronchogram within the tumor (p = 0.003).
Although more controversial, several reports to date have shown that serial CT studies are of value by confirming that there is progression of disease from pure ground-glass opacities to more complex mixed solid/ground-glass lesions (Fig. 6-9) (61,73). In one study evaluating serial CT findings in 73 patients with a spectrum of adenocarcinomas, a significant linear trend was noted confirming progression from AAH, through type A and B, to type C adenocarcinomas, with lesions first presenting as focal ground-glass opacities, subsequently increasing
in size and density with the appearance of solid components (74).
in size and density with the appearance of solid components (74).
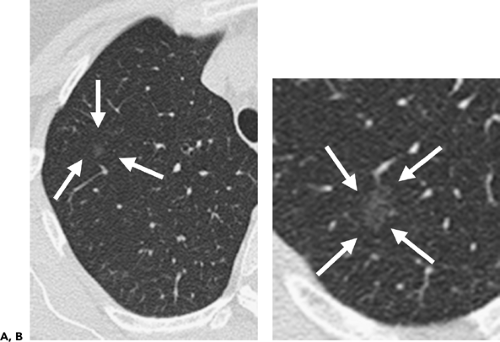 Figure 6-5 Adenocarcinoma: CT-pathologic correlations. A, B: Magnified 1-mm sections through the right upper lobe in two different patients show characteristic appearance of a pure ground-glass opacity. The former is presumed to be a focus of atypical adenomatous hyperplasia (AAH) (arrows in A), whereas the latter is one of many lesions identified in a patient with documented multifocal bronchoalveolar cell carcinoma (BAC) (arrows in B). Not surprisingly, these lesions are generally only identifiable when contiguous high-resolution 0.75- to 1-mm images are acquired. Distinction between AAH and pure BAC based solely on their CT appearances is problematic and is even difficult when evaluated histologically (Fig. 6-6). In general, lesions less than 5 mm are assumed to represent AAH, whereas lesions greater than 1 cm almost always represent BAC. Lesions intermediate in size are indeterminate and require close monitoring, frequently over several years. |
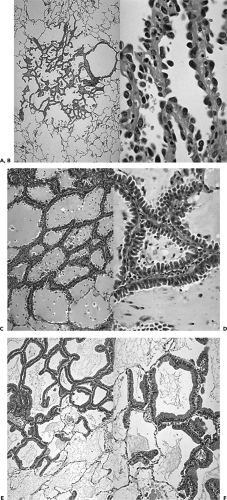 Figure 6-6 The spectrum of adenocarcinomas of the lung: pathologic appearances. See Color Figure 6-6A,B,C,D,E,F. Low- and high-powered magnified views show characteristic appearance of atypical adenomatous hyperplasia (AAH) (A and B), mucinous bronchoalveolar cell carcinoma (BAC) (C and D), and nonmucinous BAC (E and F), respectively. It is apparent why accurate identification of these lesions requires the entire specimen to be histologically evaluated, making both transbronchial and transthoracic needle aspiration or biopsy of only limited value. (Courtesy of William Travis, MD, Memorial Sloan Kettering Hospital, New York, New York.) |
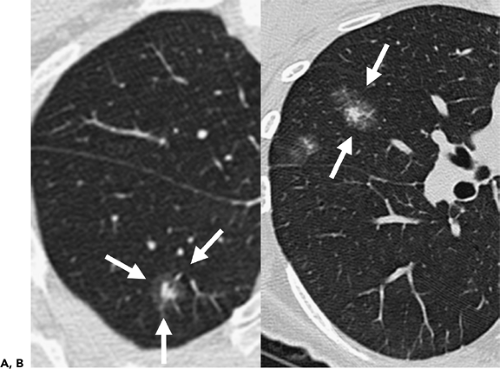 Figure 6-7 Adenocarcinoma: CT-pathologic correlations. (A and B) Shown are 5-mm and 1-mm magnified views of two different patients, respectively, illustrating the characteristic appearance of mixed ground-glass/solid lesions (arrows). This appearance typically correlates well with Noguchi type C bronchoalveolar cell carcinoma (BAC) or World Health Organization (WHO) classification invasive mixed adenocarcinoma. |
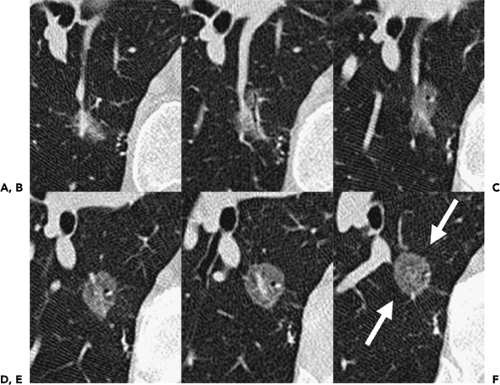 Figure 6-8 Adenocarcinoma: CT-pathologic correlations. A–F: Sequential magnified 1-mm sections through the medial aspect of the superior segment of the right lower lobe show characteristic appearance of a mixed ground-glass/solid lesion with so-called reticular features (arrows in F), appearing as a fine linear mesh within which vessels and airways can still be identified. This appearance typically correlates with at least a Noguchi type C bronchoalveolar carcinoma. |
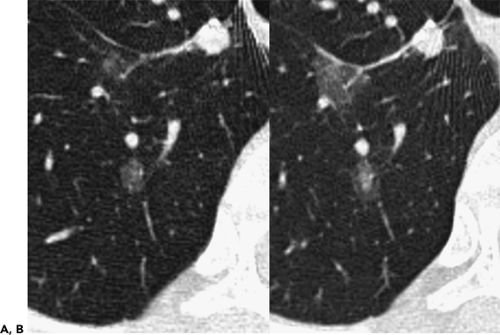 Figure 6-9 Adenocarcinoma: disease progression. A: Magnified 1-mm section through the medial aspect of the right lung shows two discrete ground-glass opacities in this patient with documented multifocal bronchoalveolar cell carcinoma. B: Magnified view at the same level as shown in A, 6 months later, shows clear progression of disease with both lesions enlarging, with evidence of a solid component now apparent in the more posterior lesion. Progression from pure ground-glass lesions to mixed ground-glass/solid lesions is consistent with evolution from pure bronchoalveolar cell carcinoma (BAC) to more invasive adenocarcinoma. |
It should be emphasized that, although pure ground-glass opacities are likely to represent either AAH or BAC, not all such lesions prove malignant (Fig. 6-11). In one study of 10 pure ground-glass opacities followed by serial CT examinations for a median period of 32 months and shown to enlarge, 3 proved to be due to lymphoproliferative disease and 1 proved to be due to focal fibrosis (60). Similarly, the finding of a mixed part solid–part ground-glass or solid lesion, although more likely to represent a mixed adenocarcinoma, may in fact represent virtually any type of lung cancer, including small cell lung cancer.
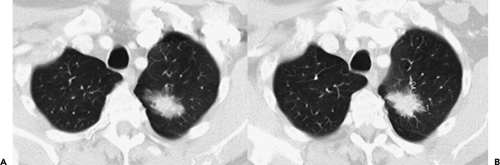 Figure 6-10 Adenocarcinoma: correlation of CT appearance and prognosis. A, B: Magnified view through the medial aspect of the left upper lobe shows a predominantly solid lesion with only a minimal ground-glass component. This appearance correlates with a poorer prognosis when compared with adenocarcinomas appearing either as pure ground-glass or mixed ground-glass/solid lesions, with a greater propensity for nodal and distant metastases to be present at the time of diagnosis. |
Calcification
It is well documented that the radiographic presence of calcification within a pulmonary lesion is generally a reliable sign that a lesion is benign (46,47). The best documentation of the nature of calcification within pulmonary nodules was carried out at the Mayo Clinic and reported in a series of articles in the 1950s (75, 76, 77, 78). In addition to confirming a strong correlation between radiographic and/or tomographic evidence of calcification and benign disease, these authors also defined characteristic patterns of calcification. Based on specimen radiography obtained on a total of 207 solitary pulmonary masses, four different patterns of benign calcification were identified (Fig. 6-12): (a) a laminated pattern with calcium deposited in concentric layers,
between rings of fibrous tissue; (b) a dense central calcified nidus; (c) diffuse and/or irregular or nodular (so-called popcorn) calcifications; and (d) eccentric, single or multiple punctuate calcifications. With minor variation, these guidelines for pattern recognition remain in effect. Although the four patterns cited adequately categorize the range of heterogeneous calcifications encountered, it should be emphasized that for small nodules, particularly those that are 1 cm or less, the commonest CT finding is diffuse homogeneous calcification.
between rings of fibrous tissue; (b) a dense central calcified nidus; (c) diffuse and/or irregular or nodular (so-called popcorn) calcifications; and (d) eccentric, single or multiple punctuate calcifications. With minor variation, these guidelines for pattern recognition remain in effect. Although the four patterns cited adequately categorize the range of heterogeneous calcifications encountered, it should be emphasized that for small nodules, particularly those that are 1 cm or less, the commonest CT finding is diffuse homogeneous calcification.
 Figure 6-11 Focal inflammation simulating adenocarcinoma. A, B: Sequential magnified 1-mm images through the right upper lobe show a characteristic-appearing ground-glass nodule initially diagnosed as consistent with probable bronchoalveolar cell carcinoma (BAC). C, D: Sequential magnified 1-mm images through the right upper lobe at the same level as shown in A and B, obtained 3 months later, show near complete resolution of this lesion, now presumed to represent focal nonspecific inflammation. Although there is extremely close correlation between subsolid nodules and adenocarcinoma (Figs. 6-6, 6-7, 6-8, 6-9, 6-10), the diagnosis of malignancy should not be assumed unless lesions remain stable for at least 3 to 6 months. |
The concept of using CT to identify otherwise radiographically occult calcifications within pulmonary nodules was first published by Siegelman et al., in 1980 (79). In this initial series, 91 patients without radiographic or
tomographic evidence of calcification were evaluated with thin-section CT and assigned a representative CT number based on an average of continuous pixels measured within the estimated center of the lesion. These authors reported that although all 45 primary neoplasms and 13 metastases had representative CT numbers less than 164 Hounsfield units (HU), 20 of 33 benign lesions proved to have representative CT numbers greater than 164 HU. If the correct diagnosis of a benign lesion is considered a true positive and the designation of a malignancy as benign is considered a false positive, then the overall sensitivity of CT in this initial study proved to be 59%, with a sensitivity of 73% for lesions 1 cm or less in diameter and a specificity of 100% (79).
tomographic evidence of calcification were evaluated with thin-section CT and assigned a representative CT number based on an average of continuous pixels measured within the estimated center of the lesion. These authors reported that although all 45 primary neoplasms and 13 metastases had representative CT numbers less than 164 Hounsfield units (HU), 20 of 33 benign lesions proved to have representative CT numbers greater than 164 HU. If the correct diagnosis of a benign lesion is considered a true positive and the designation of a malignancy as benign is considered a false positive, then the overall sensitivity of CT in this initial study proved to be 59%, with a sensitivity of 73% for lesions 1 cm or less in diameter and a specificity of 100% (79).
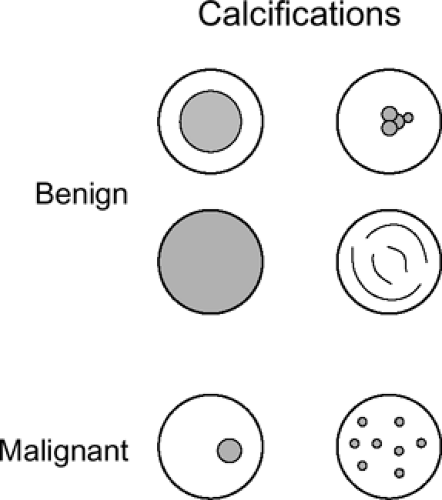 Figure 6-12 Patterns of calcification. Central, diffuse, laminated or curvilinear, and popcornlike calcification patterns are characteristic of benign nodules, whereas eccentric or multiple coarse calcifications are more often seen in malignant nodules. |
The density of a lesion, as measured by the degree to which it attenuates a collimated beam of x-rays, is an innate property of its tissue content. However, the determination of a reliable measurement in HU is subject to extensive variation. Measurements vary as a function of partial volume averaging, the reconstruction algorithm, true slice thickness, the size of the lesion, kilovoltage, and beam-hardening artifacts (80). The use of CT to evaluate nodules is now well established, as problems related to standardization of tissue attenuation measurements have been notably lessened, in particular, by algorithms to correct beam-hardening artifacts (81). It is generally held that in the majority of cases, calcified lesions are readily recognized by “obvious” high-attenuation values without the use of specific HU thresholds or the need for a reference phantom. As a consequence, it is mandatory that studies be performed with close attention to scan technique (Fig. 6-13). Although thin-section CT suffices in the majority of cases, in questionable instances, an adequate study requires that contiguous images through nodules be obtained with slice collimation less than half the diameter of the nodule to eliminate partial volume averaging, as even with the use of MDCT only a few sections will truly be representative. For small lesions, attenuation values will be overestimated by an edge-enhancing (sharp) algorithm and underestimated by a smoothing algorithm (80). Selection of a high-spatial-frequency reconstruction algorithm, in particular, may artificially create the erroneous impression of calcification within lesions, especially along their edge (82). As discussed in the section on contrast enhancement, this same logic applies to the timed evaluation of nodules following administration of intravenous contrast media. This technical consideration should not obscure the fact that 1-mm sections frequently disclose the presence of calcification when thicker 7- to 10-mm sections do not.
Primary lung malignancies may contain areas of calcification or ossification (Fig. 6-14). Theros (48), for example, found 7 examples of radiologically detected calcification in 1,267 lung cancers, a prevalence of approximately 1%. O’Keefe et al. (78), using radiographs of surgical lung specimens, found calcification in 8 (15%) of 52 resected primary lung cancers. With the addition of CT, the likelihood of detecting calcification within tumors has increased (83,84). As documented in one study, 53 (10.6%) of 500 consecutive patients with provisional diagnoses of lung cancer were found to have calcification on CT (83). Calcification within tumors may result for a number of reasons. These include (a) tumor engulfing previous calcification, as may occur with a preexisting granuloma; (b) dystrophic calcification, occurring in areas of tumor necrosis; and (c) primary tumor calcification, as may be seen in particular within mucinous adenocarcinomas. Radiographically, calcification within lung neoplasms typically appears stippled or eccentric and usually occurs in large central lesions (78). In their study of 53 patients with histologically verified calcification compared to a control group of 15 patients, Grewal and Austin (84a) recorded a mean diameter of 6.2 ± 3 cm for calcified neoplasms versus 4.4 ± 2.3 cm for noncalcified tumors, with 33 (85%) of the calcified tumors measuring more than 3 cm. In a smaller study, Mahoney et al. (84) also noted a propensity for calcification to occur in larger lesions: of 20 lesions, 15 (75%) were 5 cm or greater, whereas only 3 were 2 cm or smaller. Although a number of different patterns of calcification have been noted in these studies, including peripheral, central, diffuse, and amorphous, to date no study has shown any consistent correlation between patterns of calcification and histologic subtype. Indeed, virtually all primary lung cancers, including small cell carcinoma, may have areas of calcification identified on CT scans (83, 84, 85, 86, 87).
In addition to bronchogenic carcinoma, calcification has been identified in other primary lung tumors (88). By far the commonest of these are central carcinoid tumors (Fig. 6-15) (83,87,89,90). Classified as part of the spectrum
of neuroendocrine lung neoplasms, carcinoids are further characterized as either typical or atypical (91). These tumors tend to exhibit variable growth patterns. Most arise as endobronchial obstructing lesions, resulting on occasion in an appearance of focal mucoid impaction; alternatively, they may extend extraluminally, resulting in so-called iceberg lesions (Fig. 6-16). Unlike typical carcinoids, atypical carcinoids show a marked propensity to metastasize early, especially to regional lymph nodes. A typical triad of features has been described for central carcinoid tumors and includes a well-defined round or slightly lobulated lesion that abuts or narrows a central airway in which eccentric calcifications can be identified (Fig. 6-16). In addition, these lesions are characteristically extremely vascular and therefore show marked contrast enhancement following intravenous contrast administration. Although accurate preoperative evaluation requires precise definition of both the intraluminal and the extraluminal components of these tumors, recognition of the vascular nature of these lesions is also of obvious value, especially prior to bronchoscopy, given the propensity of these lesions to hemorrhage, sometimes massively, when biopsy is performed.
of neuroendocrine lung neoplasms, carcinoids are further characterized as either typical or atypical (91). These tumors tend to exhibit variable growth patterns. Most arise as endobronchial obstructing lesions, resulting on occasion in an appearance of focal mucoid impaction; alternatively, they may extend extraluminally, resulting in so-called iceberg lesions (Fig. 6-16). Unlike typical carcinoids, atypical carcinoids show a marked propensity to metastasize early, especially to regional lymph nodes. A typical triad of features has been described for central carcinoid tumors and includes a well-defined round or slightly lobulated lesion that abuts or narrows a central airway in which eccentric calcifications can be identified (Fig. 6-16). In addition, these lesions are characteristically extremely vascular and therefore show marked contrast enhancement following intravenous contrast administration. Although accurate preoperative evaluation requires precise definition of both the intraluminal and the extraluminal components of these tumors, recognition of the vascular nature of these lesions is also of obvious value, especially prior to bronchoscopy, given the propensity of these lesions to hemorrhage, sometimes massively, when biopsy is performed.
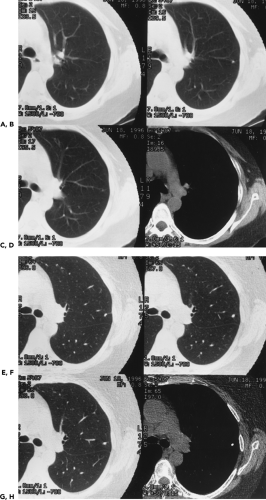 Figure 6-13 CT densitometry: 1-mm versus 7-mm section. A–C: Sequential 7-mm helical sections through the left upper lobe reconstructed every 6 mm show a small nodule in the left upper lobe. D, Identical section as in B, imaged with narrow windows, shows no obvious calcifications within the nodule. E–G: Sequential 1-mm helical images through the same portion of the left upper lobe as in A–C again show a small peripheral lung nodule. H: Identical image as in F, imaged with narrow windows, clearly shows this lesion to be densely calcified. This case illustrates that 1-mm sections are often necessary to perform adequate CT densitometry. Helical acquisition is especially helpful for evaluating very small nodules, as it markedly simplifies acquisition of sections through the center of lesions. |
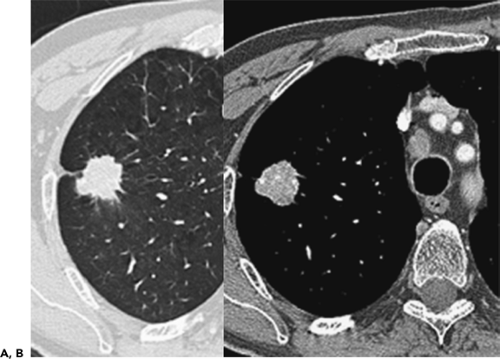 Figure 6-14 Tumoral calcification. A, B: Magnified views through the right upper lobe imaged with wide and narrow windows, respectively, show a spiculated irregular peripheral lesion within which punctate calcifications can be identified. Note that in this case there is also evidence of enlarged mediastinal nodes. The presence of calcifications per se is not a reliable sign of benign disease. |
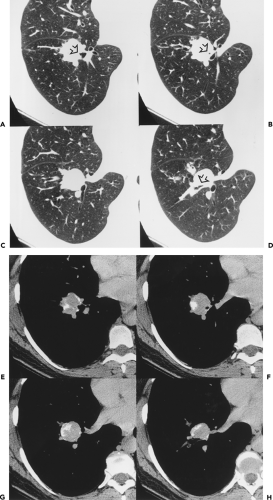 Figure 6-15 Carcinoid tumor. A–D: Sequential 1-mm sections show a well-defined central mass in the lower portion of the right hilum causing marked compression of the basilar segmental airways (arrows in A, B, and D). E–H: Identical sections as shown in A–D, imaged with mediastinal windows, show the presence of peripheral calcification. This constellation of findings is characteristic of a carcinoid tumor, subsequently verified surgically. |
In a retrospective study of 31 patients with documented carcinoids (27 typical, 4 atypical), Zweibel et al. (89) found that 18 (58%) were central, whereas 13 (42%) were peripheral in location. Calcification was identified in 7 (39%) central lesions but was seen in only 1 (8%) peripheral lesion. In a similar study of 12 pulmonary carcinoids, Magid et al. (92) also noted a propensity for central tumors to preferentially calcify. In our judgment, the triad of a well-defined central lesion abutting or narrowing an adjacent bronchus with eccentric areas of calcification is all but pathognomonic of this diagnosis (93). The one exception is the rare case of a central, endobronchial hamartoma (see Fig. 5-25).
Despite the fact that most calcified parenchymal neoplasms are identifiable as such with CT, it should be emphasized that malignant lesions may still mimic the appearance of benign calcified granulomas. In addition to the well-described finding of calcified metastases from osteogenic sarcomas and chondrosarcomas, adenocarcinomas, both primary and metastatic, not infrequently are calcified. Review of previous published studies confirms that primary and metastatic adenocarcinoma remains the lesion most likely to be misinterpreted as benign (85, 86, 87,94).
Although routine axial CT images are now the accepted gold standard for evaluating the presence of calcifications within nodules, it is worth noting that two alternative approaches have also been advocated. The first involves the use of dual kVp to analyze nodules as an alternate method for detecting calcium (95). Although the necessity for images to be obtained at precisely the same level for
comparison purposes has, to date, proved a major limitation to this technique (96), the recent introduction of a dual source CT scanner raises the distinct possibility that this approach may supersede traditional CT analysis. The second involves the use of dual-energy digital subtraction radiography (97). Briefly, dual-subtraction chest radiography makes use of the fact that structures containing calcium selectively attenuate lower energy photons in the x-ray beam, allowing identification of calcified nodules, otherwise indistinguishable from noncalcified nodules by routine radiographic techniques. Although the use of this technique is not currently widespread, commercially available digital radiographic systems are now in use, making this a potentially attractive alternative to CT.
comparison purposes has, to date, proved a major limitation to this technique (96), the recent introduction of a dual source CT scanner raises the distinct possibility that this approach may supersede traditional CT analysis. The second involves the use of dual-energy digital subtraction radiography (97). Briefly, dual-subtraction chest radiography makes use of the fact that structures containing calcium selectively attenuate lower energy photons in the x-ray beam, allowing identification of calcified nodules, otherwise indistinguishable from noncalcified nodules by routine radiographic techniques. Although the use of this technique is not currently widespread, commercially available digital radiographic systems are now in use, making this a potentially attractive alternative to CT.
Fat
The presence of fat within the parenchyma is indicative of one of two diagnoses: hamartoma (Figs. 6-17, 6-18, 6-19) or exogenous lipoid pneumonia (Figs. 6-20 and 6-21). Hamartomas, the third commonest cause of a SPN, are considered benign neoplasms that originate in fibrous connective tissue beneath the mucous membrane of the bronchial wall (98,99). These lesions contain mixtures of myxomatous connective tissue, cartilage, epithelial-lined clefts, and variable amounts of fat, smooth muscle, marrow, and bone (100). Fat is a key element; if one combines three reported series with data on histology, 37 of 68 (54%) of the lesions contain fat (101, 102, 103). Calcification is more common in large lesions, occurring in less than 10% of lesions smaller than 2 cm, one third of tumors 3 to 4 cm in diameter, and 75% of lesions larger than 5 cm (104). Cartilage usually predominates, but occasionally fat or myxomatous connective tissue may be most prominent.
Hamartomas may be diagnosed when they are manifest on CT as lesions that contain fat, or fat plus calcium, and have a smooth contour and sharp outline (87,98). In a report of 47 lesions studied by CT, 30 (63.8%) contained fat only (n = 18), calcium and fat (n = 10), or calcium alone (n = 2) (98). The remaining lesions were diagnosed as indeterminate and managed with surgery or lung biopsy (98). In our experience, lung cancers never manifest as smoothly marginated lesions containing fat. Use of CT to definitively diagnose pulmonary hamartomas requires the same attention to scan technique as discussed previously pertaining to CT identification of calcifications: namely, that contiguous (and/or overlapping) thin sections less than half the diameter of the nodule be acquired reconstructed with a soft tissue algorithm to obviate potential misdiagnoses due to partial volume averaging either from adjacent lung parenchyma or from subtle cavitation resulting in the spurious appearance of HU units in the range of fat.
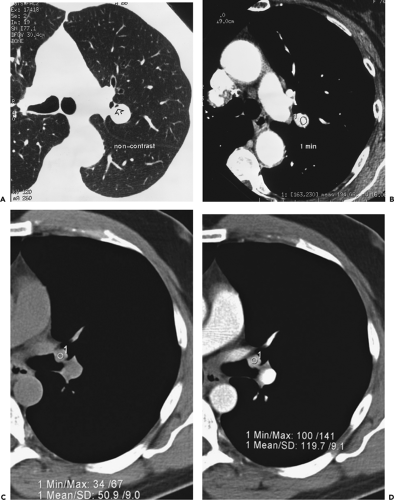 Figure 6-16 Hilar carcinoid: evaluation with contrast enhancement. A, B: Enlargement of 3-mm section acquired helically through the left hilum, imaged with wide and narrow windows, respectively, 1 minute after the administration of intravenous contrast media shows a left hilar mass causing slight compression of the adjacent bronchus (arrow in A). Note that with mediastinal windowing this mass has the same density as the adjacent left pulmonary artery and aorta, measuring 163 HU, indicative of an extremely vascular lesion. This degree of enhancement within a central mass abutting a bronchus is characteristic of a carcinoid tumor, subsequently verified at surgery. C, D: Magnified images from a different patient than shown in A and B, first without (C) and then following a bolus of intravenous contrast media (D), again demonstrate that carcinoid tumors are highly vascular and enhance following intravenous contrast administration. (A, B from Costello P, Naidich DP. Protocols for helical CT of the chest. In: Silverman PM, ed. Helical (spiral) computed tomography. A practical approach to clinical protocols. Philadelphia: Lippincott–Raven; 1998:65–101 , with permission.) |
It is worth emphasizing that, despite their benign nature, hamartomas grow, albeit slowly. Bateson and Abbott (104), for example, noted slow growth in 40 of 45 patients with available serial chest roentgenograms. In one study of 11 cases that exhibited enlargement, recognizable changes were present only in those studied for at least 3 years (105).
Fluid
A number of focal parenchymal lesions are distinguished by the presence of fluid. Included in this group are lung abscesses (Fig. 6-22), mucoid impaction of the airways (Fig. 6-23), and, rarely, intrapulmonary bronchogenic cysts (106) (Table 6-1) (Fig. 6-24). Even when surrounded by extensive consolidation or within atelectatic lung, abscesses characteristically appear well defined and smooth walled prior to the development of bronchial or pleural communications following the administration of intravenous contrast media and consequently are generally easily differentiated from tumors with CT. Similarly, mucoid impaction of the airways is easily identifiable by the presence of characteristic focal fluid-filled, nonenhancing branching structures, frequently associated with peripheral areas of emphysema (Fig. 6-23). Less commonly, central endobronchial tumors may present with focal mucoid impaction. In these cases, the use of a bolus of intravenous contrast may be of help in differentiating the central enhancing tumor from peripheral fluid-filled airways. Care should be taken to ensure that tumor has not invaded the airways directly by measuring attenuation values within these areas both prior to and following the injection of contrast media. Alternatively, differentiation of tumor from fluid-filled airways may be obtained with T2-weighted MR images (Fig. 6-25) (107,108).
Air
CT is exquisitely sensitive to the presence of air, and it is not surprising that subtle cavitation within nodules is easily identified when otherwise radiographically occult (Figs. 6-26, 6-27, 6-28). In addition to assessing the relationship between cavities and airways and surrounding parenchyma, CT allows precise evaluation of the thickness of cavity walls as well as the presence of intracavitary filling defects and/or air-fluid levels. As reported by Woodring et al. (109), the most important of these is
assessment of cavity wall thickness. Of 65 solitary lung cavities initially assessed by these authors using plain radiographs, all lesions in which the thickest part of the cavity wall was 1 mm were benign. In distinction, of those with greatest wall thickness measuring between 5 and 15 mm, 51% were benign; of those over 15 mm, 95% were malignant. In a follow-up prospective study of 61 additional patients reported by these same authors, 19 (95%) of 20 cavities with a maximum wall thickness of 4 mm again proved benign; whereas 16 (84.2%) of 19 cavities with maximum wall thickness of 16 mm proved malignant (110). In our experience, although thin-walled cavities are almost always benign, thick-walled cavities are usually of indeterminate etiology (Fig. 6-26).
assessment of cavity wall thickness. Of 65 solitary lung cavities initially assessed by these authors using plain radiographs, all lesions in which the thickest part of the cavity wall was 1 mm were benign. In distinction, of those with greatest wall thickness measuring between 5 and 15 mm, 51% were benign; of those over 15 mm, 95% were malignant. In a follow-up prospective study of 61 additional patients reported by these same authors, 19 (95%) of 20 cavities with a maximum wall thickness of 4 mm again proved benign; whereas 16 (84.2%) of 19 cavities with maximum wall thickness of 16 mm proved malignant (110). In our experience, although thin-walled cavities are almost always benign, thick-walled cavities are usually of indeterminate etiology (Fig. 6-26).
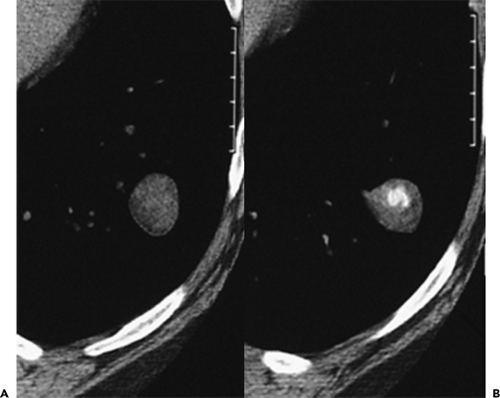 Figure 6-17 Hamartoma. A, B: Sequential magnified 1-mm sections through a well-defined nodule in the left lower lobe show both dense laminated calcifications and a small quantity of fat. This combination is diagnostic of a pulmonary hamartoma. |
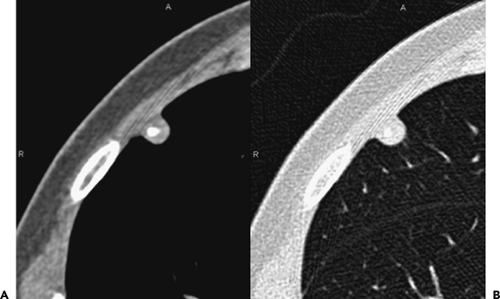 Figure 6-18 Hamartoma. A, B: Magnified images through the right upper lobe imaged with narrow and wide windows, respectively, show a well-defined subpleural nodule within which calcification and a small quantity of fat can be identified, consistent with the diagnosis of a pulmonary hamartoma (compare with Fig. 6-17). |
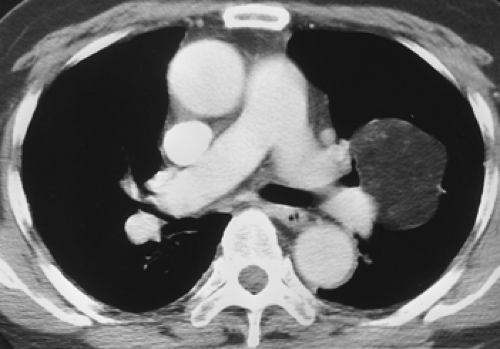 Figure 6-19 Hamartoma. Contrast-enhanced CT section shows a giant fat-containing hamartoma within the left upper lobe. In this case partial volume averaging is not a significant concern. |
As important as assessing the thickness of the wall of cavities is the finding of bubblelike lucencies within focal lesions. Gaeta et al. (111), in a review of thin-section CT in 11 patients with nodular BAC, reported 2 lesions with serpentine radiolucencies that subsequently were shown histologically to represent air-containing glandular spaces within the tumor (Fig. 6-8). Kuhlman et al. (112), in a study of 30 patients with documented focal BACs, similarly described a pattern they interpreted as suggestive of pseudocavitation in 18 cases. Defined as small oval areas of lucency appearing in or around pulmonary masses, this appearance was interpreted as consistent with residual dilated bronchioles and expanded air spaces, the result of the distinctive propensity of these tumors to extend along alveolar walls without distortion of the underlying architecture. As noted by Zwirewich et al. (113), bubblelike lucencies are seen more commonly in BAC (50%) than in acinar adenocarcinoma (31%) or other lung tumors (11%), making this sign highly suggestive of BAC (113).
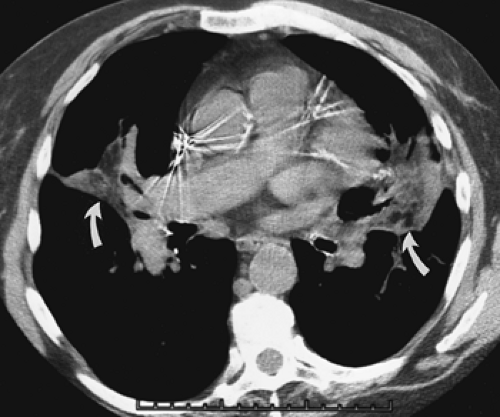 Figure 6-20 Lipoid pneumonia. CT section through the midportions of both lungs shows bilateral ill-defined areas of parenchymal consolidation within which there is unmistakable evidence of fat density (arrows). |
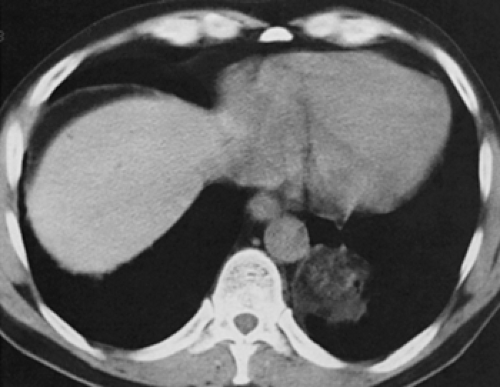 Figure 6-21 Lipoid pneumonia: left lower lobe mass in an elderly patient using oily drops for nasal dryness. Note focal infiltrate with large areas of low attenuation in the range of fatty tissues typical of this entity. (Case courtesy of Dr. Norman Ettenger, Bronx VA Hospital, New York, New York.) |
Contour and Edge Characteristics
Malignant nodules are much more likely to have an irregular contour or spiculated margins (Figs. 6-10, 6-14, and 6-29) (113,114). In one study using high-resolution images to evaluate 104 consecutive patients with focal lung lesions, not only was spiculation per se a significant predictor of malignancy but so, too, was the finding of spicules extending to the pleural surface as well as the greater length of spicules (114). Benign lesions, on the other hand, much more commonly exhibit a round or oval contour and a sharply defined edge. This has proved true both for primary and metastatic nodules. In patients with known neoplasms and multiple pulmonary nodules, for example, Gross et al. (115) found that metastatic lesions on CT are more likely to be spherical or ovoid, whereas linear, triangular, irregularly
shaped, or multiple ill-defined lesions, especially when centrally located, are less likely to represent metastases. These authors also found that if noncalcified, round lesions larger than 2.5 cm were present or if more than 10 lesions were visualized in any one patient, the likelihood of metastatic disease was very high.
shaped, or multiple ill-defined lesions, especially when centrally located, are less likely to represent metastases. These authors also found that if noncalcified, round lesions larger than 2.5 cm were present or if more than 10 lesions were visualized in any one patient, the likelihood of metastatic disease was very high.
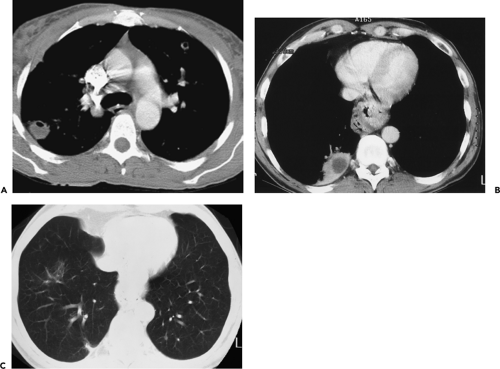 Figure 6-22 Lung abscess. A: Contrast-enhanced CT section at the level of the carina shows a well-defined fluid-filled lesion within which a small quantity of air can be identified in an immunocompromised patient. Note the presence of a similar-appearing smaller lesion in the left upper lobe. In the appropriate clinical setting, the finding of a well-defined, thin-walled fluid-filled lesion is characteristic of a lung abscess. B: Contrast-enhanced CT section in a different patient than shown in A shows a focal area of peripheral consolidation in the posterobasilar segment of the right lower lobe within which there is a sharply defined rounded area of lucency measuring in the range of fluid (HU not shown). The finding of a sharply defined fluid collection distinguishes a lung abscess from necrotic tumor, the margins of which are never as sharply defined. This image also emphasizes the need to evaluate complex parenchymal disease following intravenous contrast administration. (C) Section at the same level as B, following a 6-week course of antibiotic therapy, shows that the previous abscess has almost completely resolved, leaving behind only an ill-defined linear scar to mark the spot. |
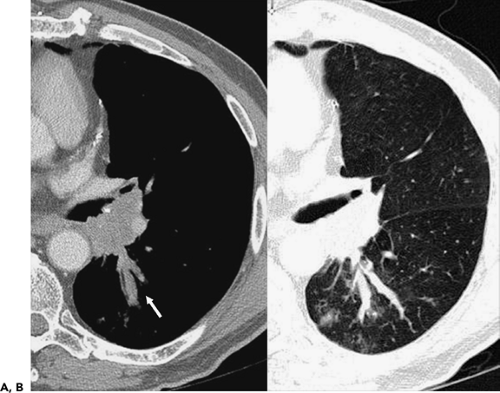 Figure 6-23 Mucoid impaction. A, B: Magnified images through the left hilum following intravenous contrast administration show extensive tumor obstructing the origin of the left lower lobe bronchus. Note extensive mucoid impaction in the proximal portions of the superior segmental bronchi, identifiable as linear branching structures extending posteriorly from the left hilum (arrow). (See also Fig. 5-70.) |
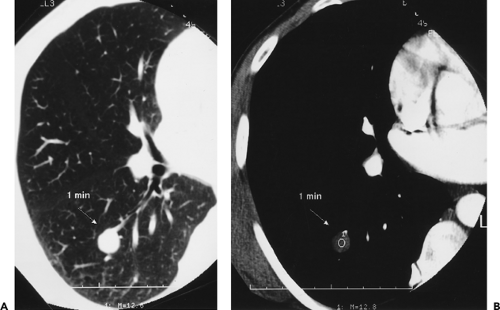 Figure 6-24 Intrapulmonary bronchogenic cyst. A, B: Identical sections imaged with wide and narrow windows, respectively, show a well-defined peripheral nodule in the superior segment of the right lower lobe in close proximity to a subsegmental bronchus. Note that one minute following a bolus of intravenous contrast media, this lesion is uniform in appearance and measures 12 HU, indicating that it is within the range of fluid. Subsequent images obtained at 2, 3, and 4 minutes failed to show any significant enhancement, suggesting the possibility of an intraparenchymal cyst or abscess. At transthoracic needle biopsy, approximately 2 mL of clear sterile fluid was aspirated. At thoracotomy this lesion proved to have cartilage in the wall, confirming the diagnosis of an intrapulmonary bronchogenic cyst. (From Costello P, Naidich DP. Protocols for helical CT of the chest. In: Silverman PM, ed. Helical (spiral) computed tomography. A practical approach to clinical protocols. Philadelphia: Lippincott–Raven; 1998:65–101 , with permission.) |
Nonetheless, although the contour and shape of lesions may provide some indication as to the likelihood of malignancy, it is not unusual both for primary lung neoplasms and, in particular, a solitary metastasis to present with smooth, sharply marginated contours. Similarly, although less common, benign lesions may
appear spiculated (Fig. 6-29). Hirakata et al. (116), in a study of 87 metastatic lesions identified at autopsy, including 43 nodules less than 5 mm, found 38% of nodules to be well defined with smooth margins, using high-resolution computed tomography (HRCT), whereas 16% had poorly defined smooth margins and 30% had poorly defined, irregular margins. Well-defined lesions correlated with the presence of tumor displacing surrounding normal structures by uniform expansion, whereas irregular margins correlated with proliferation of tumor into the
adjacent interstitium. Less well appreciated is the fact that benign lesions may also have spiculated margins, further limiting the usefulness of this sign.
 Figure 6-25 Hilar carcinoid: differentiation between tumor and fluid-filled airways. A: Contrast-enhanced CT section at the level of the inferior pulmonary veins shows a discrete mass in the right hilum, easily differentiated from adjacent obstructed airways. B–E: Sequential gadolinium-enhanced MR images corresponding to the same approximate level as shown in A also show the presence of a central tumor causing obstruction of the adjacent fluid-filled airways. In this case, identification of central tumor is equally well established using either contrast-enhanced CT or MRI. |
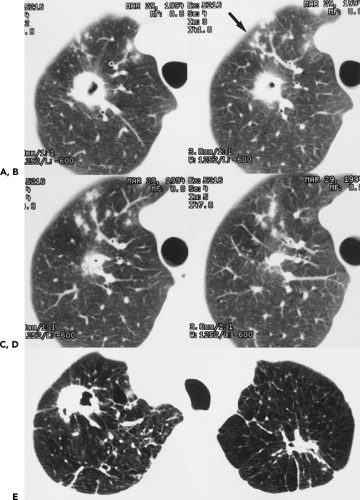 Figure 6-26 Thick-walled cavities: differential diagnosis. A–D: Sequential high resolution sections through the right upper lobe show a thick-walled cavity associated with adjacent nodules with a tree-in-bud configuration (arrow in B). This constellation of findings is strongly suggestive of active tuberculosis, subsequently verified at bronchoscopy. E: CT section in a different patient than in A–D also shows bilateral irregular thick-walled cavities. In this case, the lesion in the right upper lobe proved to be a cavitary lung cancer, whereas the lesion in the left upper lobe proved to be caused by tuberculosis (biopsy proved). As shown in these cases, the presence of a thick-walled cavity in itself is nonspecific. |
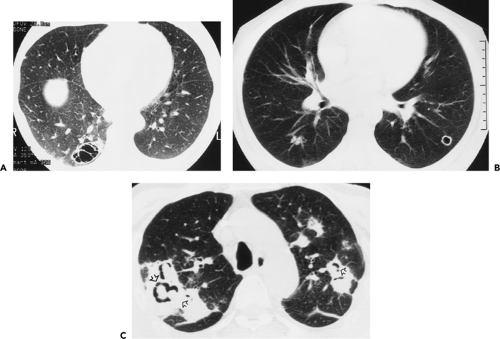 Figure 6-27 Cavitation: benign disease. A: High-resolution CT section shows a multiseptate, thin-walled cavity in the posterobasilar segment of the right lower lobe, associated with minimal eccentric consolidation and ground-glass attenuation. The findings were consistent with clinically documented cryptococcal infection. B: High-resolution CT section shows a sharply defined, thin-walled cavity in the left lower lobe in an acquired immunodeficiency syndrome (AIDS) patient, subsequently documented to have atypical mycobacterial infection (MAI). Note as well the presence of a focal area of mucoid impaction in the right lower lobe. The finding of thin-walled cavities, with or without septations, is a reliable sign of benignity. C: CT section through the distal trachea shows multiple thick-walled cavities in this patient with prior treated tuberculosis. Within the cavities are nodular filling defects (arrows), findings consistent with superimposed fungal infection, in this case caused by Aspergillus species. |
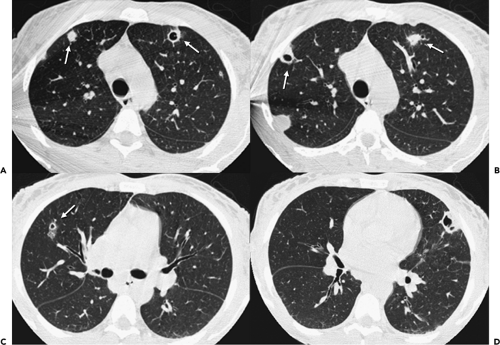 Figure 6-28 Cavitary disease: septic emboli. A–D: CT sections through the lungs, beginning at the level of the aortic arch and extending to the middle lobe bronchus, show numerous predominantly peripheral/subpleural nodules in varying stages of cavitation, characteristic of septic pulmonary emboli (arrows in A–C). Note that some of these lesions lie adjacent to pulmonary vessels, suggestive evidence of their hematologic origin. |
Surprisingly, given the importance usually attributed to the edges of lesions, significant interobserver variability in the assessment of this sign has also been reported. In a study characterizing nodules in 66 patients, the largest discrepancy between four board-certified readers was in classification of nodule contour (94). This suggests that accurate evaluation of this sign may require a more precise definition or perhaps the use of a more quantitative assessment (117,118).
Size
The likelihood of malignancy in an indeterminate pulmonary nodule detected by chest roentgenography is a direct function of the size of the lesion. This principle was well established in the years preceding the advent of CT. Thus, Steele et al. (41), in a study of 756 resected asymptomatic SPNs, noted a benign-to-malignant ratio of 13:1 in a group of 112 lesions 1 cm or less versus a ratio of 1:4 in 144 lesions greater than 3.0 cm in diameter (41).
The size of a lung nodule identified with CT is also a good indicator of the likelihood of malignancy, especially when interpreted in association with lesion density. This is especially true for small nodules (less than 10 mm) identified on CT. As documented in a number of recent reports, the likelihood of a nodule less than 4 mm incidentally identified on CT being malignant is exceedingly small, regardless of whether or not it is subsolid or solid in appearance (119, 120, 121). Only rarely will such lesions prove malignant (Figs. 6-1 and 6-2). In a recent retrospective review of 2,987 prevalence LDCT screening studies, for example, 0 of 378 nodules less than 5 mm proved to be malignant on yearly follow-up studies, whereas in this same study 13 of 328 nodules between 5 and 9 mm proved malignant on subsequent examination (122). In distinction, nodules between 4 and 10 mm incidentally identified with CT should be considered indeterminate,
whereas lesions larger than 10 mm are best considered malignant until proven otherwise (123). The incidence of malignancy in a lung lesion larger than 3 cm is so great that all these lesions should be surgically resected unless medically contraindicated.
whereas lesions larger than 10 mm are best considered malignant until proven otherwise (123). The incidence of malignancy in a lung lesion larger than 3 cm is so great that all these lesions should be surgically resected unless medically contraindicated.
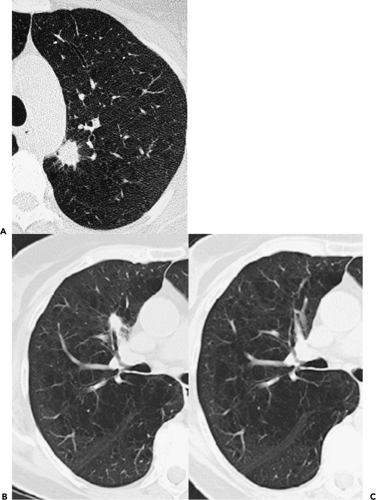 Figure 6-29 Nodule characterization: spiculation. A: Magnified view at the level of the posterior aspect of the aortic arch shows an irregular, spiculated lesion, the appearance of which is highly suggestive of a primary lung neoplasm, subsequently surgically verified as non–small cell lung cancer. B: Magnified section through the right upper lobe in a different patient than A shows a similar-appearing spiculated nodule seemingly partially obstructing the medial branch of the anterior segmental bronchus, consistent with a presumed prior lung neoplasm. C: Follow-up CT study several weeks later, without therapy, obtained prior to diagnostic bronchoscopy shows that the previous lesion is no longer identifiable, consistent with a benign, presumably inflammatory, etiology. Although spiculation is highly suggestive of a malignant etiology, in any individual case it remains an unreliable finding in itself. |
Although size has proved to be a statistically significant discriminator between benign and malignant lesions, especially in a screened population, the potential for tiny nodules to be malignant cannot be entirely ignored, especially in symptomatic patients. In one retrospective study of 64 patients with nodules less than 1 cm subsequently evaluated by video-assisted thoracoscopy (VATS), reported by Munden et al. (124), 38 (57%) nodules proved to be neoplastic, including 37 nodules in patients without prior history of malignancy. Strikingly, in 8 cases with nodules less than 5 mm (so-called ditzels), 6 of 8 proved malignant, whereas 2 proved to be due to intrapulmonary lymph nodes.
It should be emphasized that the likelihood of small (<1 cm) nodules being malignant will also be influenced by the presence of additional lesions. Yuan et al. (125), in a retrospective review of preoperative CT scans in 223 patients, evaluated the probability of malignancy occurring in small nodules less than 1 cm coexisting with potentially operable lung cancers. Areas of evaluation included nodule size and location and the clinical stage of the primary tumors. A total of 71 coexisting nodules were identified in 58 (26%) patients, of which 18 (25%) proved malignant. Although the probability of malignancy was greater in nodules located within primary tumor lobes, four (57%) coexisting synchronous cancers were identified in lobes other than those containing the dominant lesion. The likelihood of malignancy also proved to be less in patients with clinical stage 1A disease.
Although there is little dispute regarding the relationship between size and the likelihood of malignancy, there is controversy regarding the significance of size as an indicator of cancer stage. Although it has been argued that size is not an accurate reflection of likely tumor stage (126), recent data strongly suggest that a stage-size relationship exists, in particular in a screened population. Among 464 diagnosed lung cancers in 28,689 screened individuals, including 84% surgically staged and the remainder evaluated with follow-up imaging studies, the percentage of cases with no metastases (N0M0) was 91% for lesions 15 mm or less, 83% for lesions 16 to 25 mm, and 68% for lesions between 26 and 35 mm (18,127).
Stay updated, free articles. Join our Telegram channel

Full access? Get Clinical Tree


