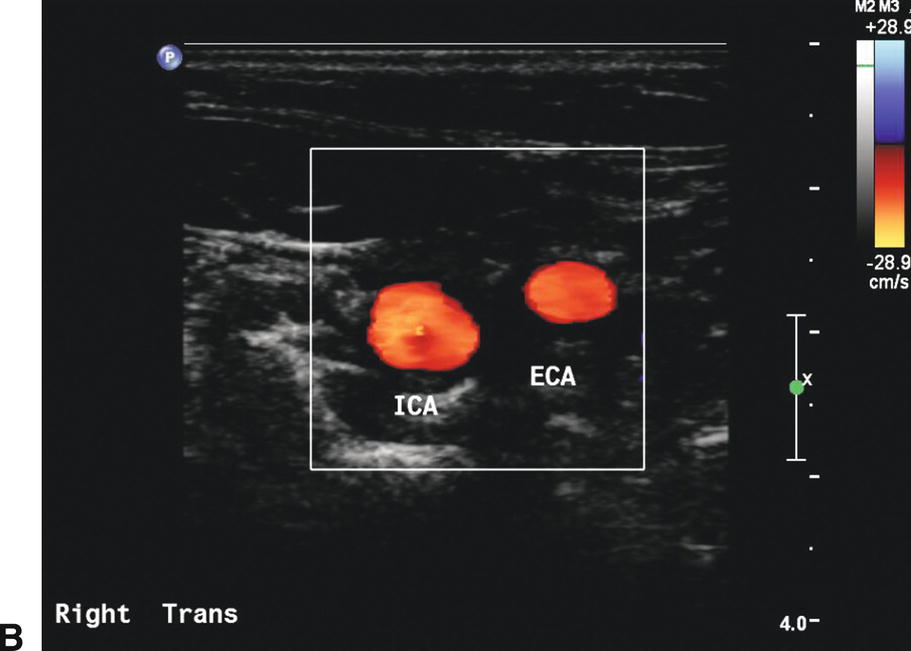
FIGURE 8.1. Transverse or cross-sectional images. A,B-mode image shows an eccentric plaque in the mid common carotid artery (CCA; arrow). B,Color-flow image of the carotid bifurcation shows the internal carotid artery (ICA) is larger in caliber than the external carotid artery (ECA).
Most of the carotid duplex scan is accomplished using a longitudinal view, which permits the most favorable Doppler angles for recording velocity data and for color Doppler imaging. Using the longitudinal orientation, the pulsed Doppler sample volume is swept continuously throughout the length of the vessels, especially in the area of the bifurcation, searching for areas of increased velocity or flow disturbance. Spot-checking velocity information or sampling sporadically from random locations is poor technique and should be avoided. Neither the B-mode nor the color Doppler image will reliably pinpoint the area of maximal velocity or flow disturbance. Gray-scale and color or power Doppler images alert the examiner to the presence of plaque in the arterial wall that may preclude penetration of the vessel by ultrasound (Fig. 8.2). Color Doppler and B-mode images are helpful primarily for localizing a particular area of interest that needs more specific, in-depth investigation with the pulsed Doppler sample volume (Fig. 8.3).
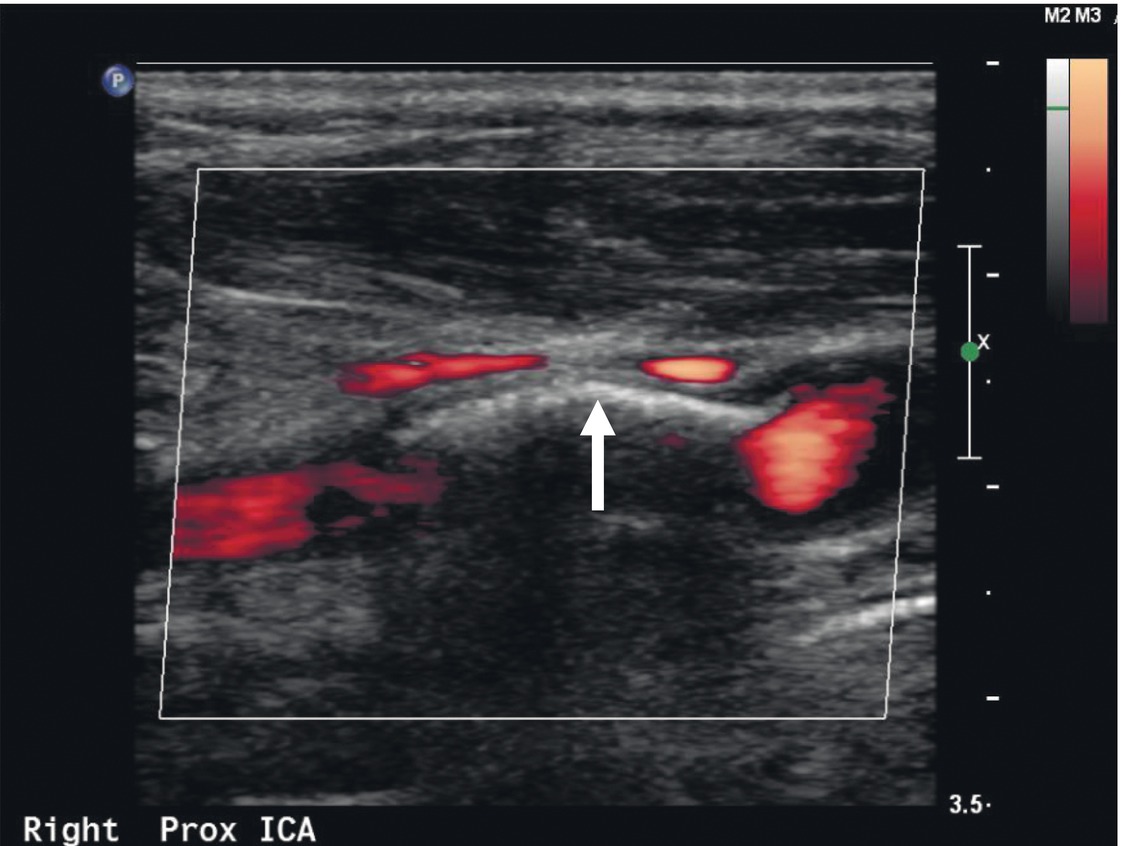
FIGURE 8.2. Calcific plaque in the arterial wall (arrow) precludes penetration of the vessel by ultrasound in this power Doppler image, resulting in acoustic shadowing and a “color void.” In some cases, it may be possible to obtain a Doppler signal by varying the angle of the scan head. Some information on the possible presence of stenosis in the area of a color void can also be obtained by analysis of the Doppler spectral waveforms immediately proximal and distal to the shadowed segment.
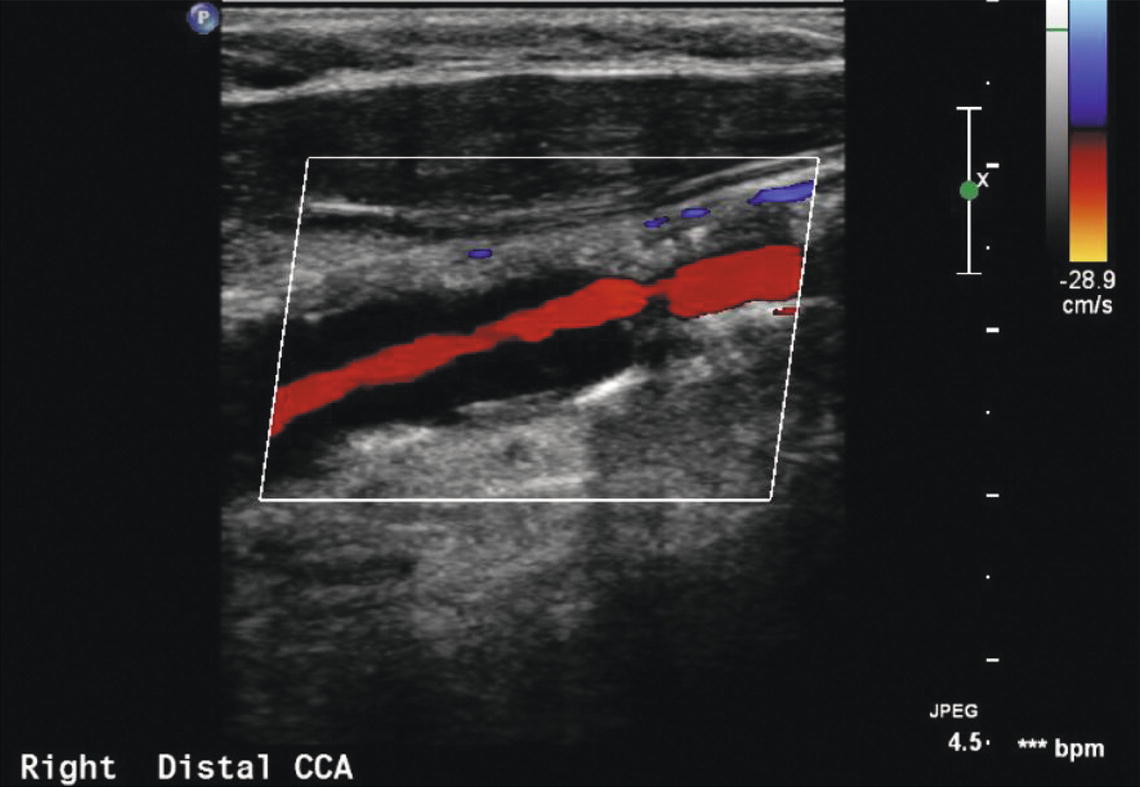
FIGURE 8.3. Color Doppler clearly indicates compromise of the arterial lumen in this common carotid artery (CCA) but is generally not as accurate as spectral waveform analysis in quantifying the degree of stenosis.
The value of detailed characterization of carotid plaque composition and surface features by gray-scale imaging in routine clinical practice is controversial. It is common for interpreting physicians to comment on the ultrasound characteristics and surface features of a significant carotid plaque. Retrospective analyses suggest that plaques that are predominantly echolucent or irregular are more likely to be associated with neurologic symptoms than predominately echo-dense or smooth plaques.2–5 However, thus far, this research is largely qualitative, and although advances in imaging technology can now provide very detailed gray-scale images (Figs. 8.4 and 8.5), there are still no definite therapeutic recommendations that can be made based on ultrasound plaque characteristics alone.
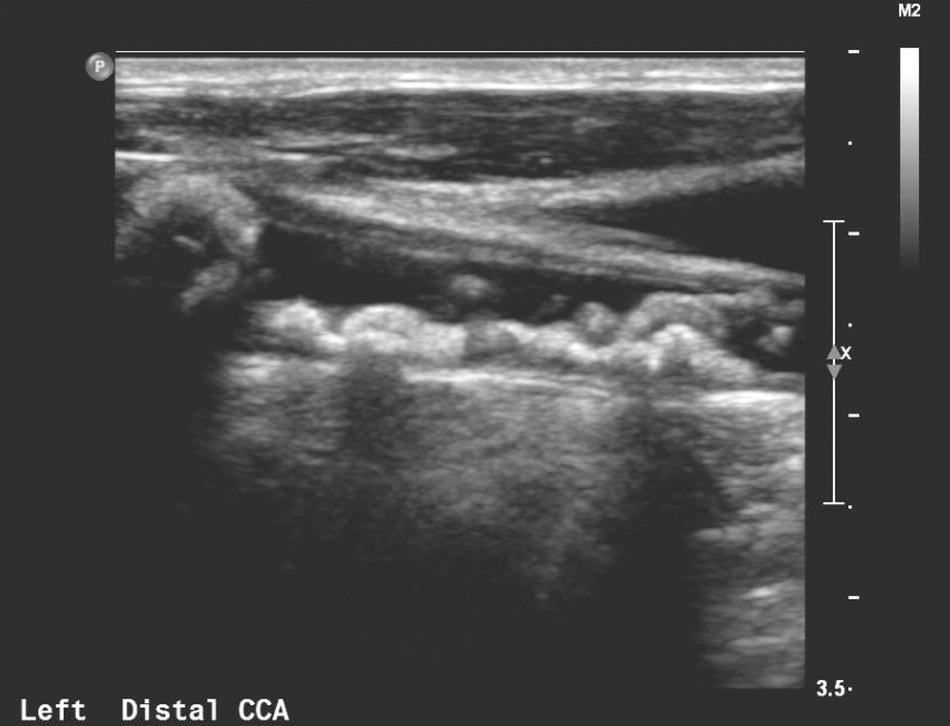
FIGURE 8.4. This gray-scale image demonstrates bulky plaque with irregular surface characteristics in the distal common carotid artery (CCA).
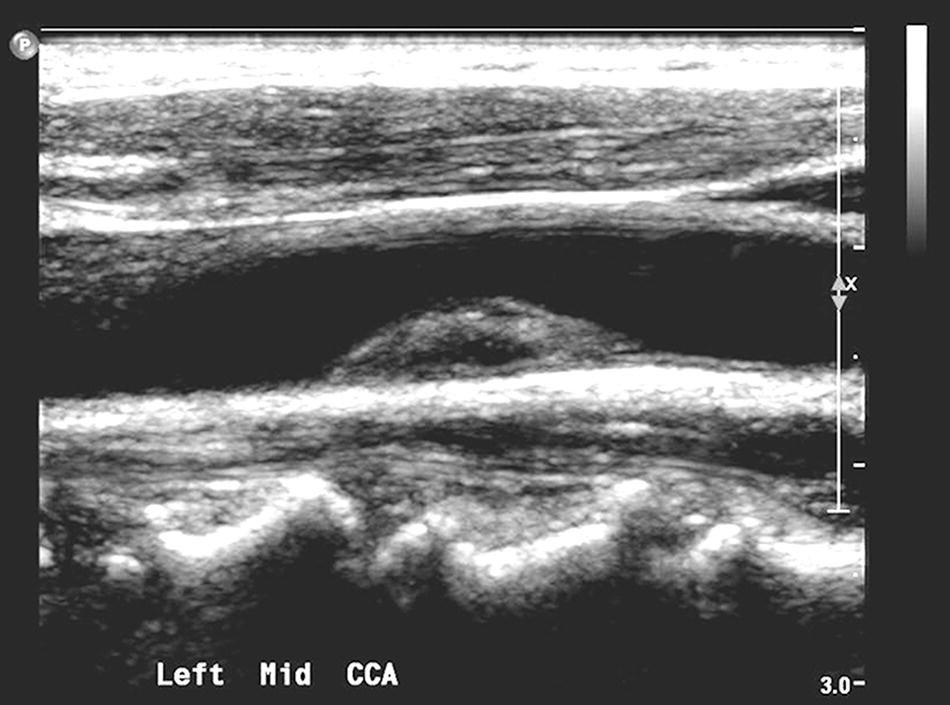
FIGURE 8.5. This gray-scale image shows a heterogeneous plaque in the mid common carotid artery (CCA) with an echolucent center and generally smooth surface.
Ultrasound beam angles for optimal B-mode images are different from those required for obtaining Doppler spectral waveforms. Maximal ultrasound reflection occurs when the ultrasound beam is perpendicular to the surface being imaged. The optimal B-mode imaging angle is therefore 90 degrees to the surface of the artery. The angle that produces the highest Doppler frequency shift is 0 degrees or parallel to the direction of flow. However, it is difficult to achieve Doppler angles parallel to flow in the cervical cerebrovascular vessels, and angles up to 60 degrees between the vessel axis and the Doppler beam are acceptable. Angles greater than 60 degrees introduce errors into measuring Doppler frequency shifts that may be clinically significant and should be avoided. Therefore, the same view used to obtain an optimal Doppler signal may not yield the highest resolution B-mode image. The physical principles of vascular imaging with ultrasound are discussed in detail in Chapter 7. Most ultrasound instruments have fixed B-mode imaging elements with a steerable Doppler beam, and the operator manipulates the scan head to individually optimize the angles for each modality. Some ultrasound instruments allow the operator to electronically steer the B-mode image and Doppler beam independently, allowing optimization of both modalities simultaneously. Every effort should be made to create the optimal angles for B-mode imaging and Doppler spectral waveform analysis.
CAROTID FLOW PATTERNS
Normal Common and Internal Carotid Arteries
Doppler spectral waveforms are obtained from the CCA, ICA, the origin of the external carotid artery (ECA), and the proximal vertebral artery. As previously mentioned, a continuous or “point-to-point” sampling technique should be used to examine the CCA and ICA. Spectral waveforms are also obtained from any site of suspected abnormality suggested by gray-scale or color Doppler images. Evaluation of the subclavian arteries, as discussed in Chapter 14, is performed as a routine component of the carotid duplex scan in many laboratories but can also be done selectively.
In normal individuals, 70% to 80% of the CCA flow volume enters the low-resistance ICA, and therefore, flow in the CCA typically shows a low-resistance pattern with a rapid systolic upstroke and forward flow throughout diastole (Fig. 8.6). When evaluating the CCA, a spectral waveform should be obtained from the most proximal CCA segment accessible to the scan head. For calculating velocity ratios between the ICA and the CCA (ICA/CCA ratio), the CCA peak systolic velocity (PSV) should be measured in the mid-neck approximately 3 cm proximal to the bifurcation where the vessel is straight and free of significant occlusive disease. Comparison of CCA waveforms from the two sides of the neck should reveal similar PSV and end-diastolic flow velocities.
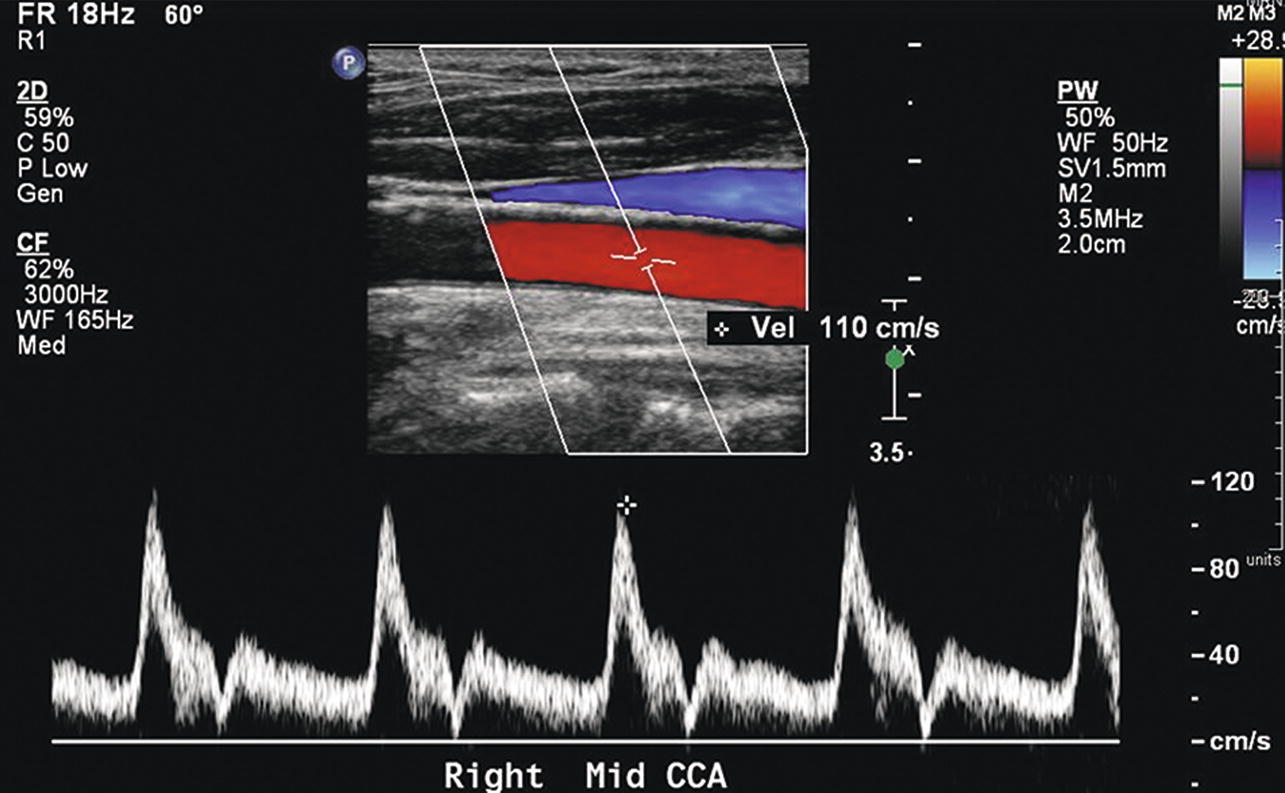
FIGURE 8.6. Normal common carotid artery (CCA) color Doppler image and spectral waveform, with a rapid systolic upstroke and forward flow throughout diastole. There is also a clear “window” under the systolic peak, indicating laminar or nondisturbed flow. The relatively high diastolic flow velocity represents the low resistance of the internal carotid circulation, whereas the transient low-velocity “valley” (near the baseline) in late systole is a feature of the normal external carotid flow pattern. Peak systolic velocity is 110 cm/s.
Spectral waveforms are recorded routinely from the proximal, mid, and distal cervical ICA segments. The normal ICA flow pattern is characteristic of a low-resistance artery, with a rapid systolic upstroke, continued forward flow throughout diastole, and relatively high diastolic velocities (Fig. 8.7). The normal proximal ICA often includes a dilation or “bulb” of variable size that tapers gradually toward the mid and distal segments (Fig. 8.8). The unidirectional flow pattern described previously is normally found in the carotid bulb along the flow divider of the bifurcation. However, there is transient reversal of flow at peak systole near the center stream and at the outer wall opposite the flow divider. This area of reversed flow is often seen in color Doppler images (Fig. 8.9). As discussed in Chapter 5, this complex flow pattern is referred to as an area of boundary layer separation or flow separation. Flow velocities along the outer wall in the separation zone may drop to zero at the end of diastole (Fig. 8.10). These normal flow patterns are used in conjunction with the absence of visible plaque on the B-mode image to identify a normal carotid bulb. Flow patterns in the carotid bulb may extend to the mid-ICA and can be apparent in waveforms obtained at that level. The distal ICA includes the segment at least 3 cm above the carotid bifurcation. Atherosclerosis usually develops within 2 cm of the bifurcation and rarely is limited to the distal ICA. However, there are a few conditions, such as fibromuscular dysplasia, in which velocity increases are localized to the distal ICA without the presence of proximal ICA plaque (Fig. 8.11).6
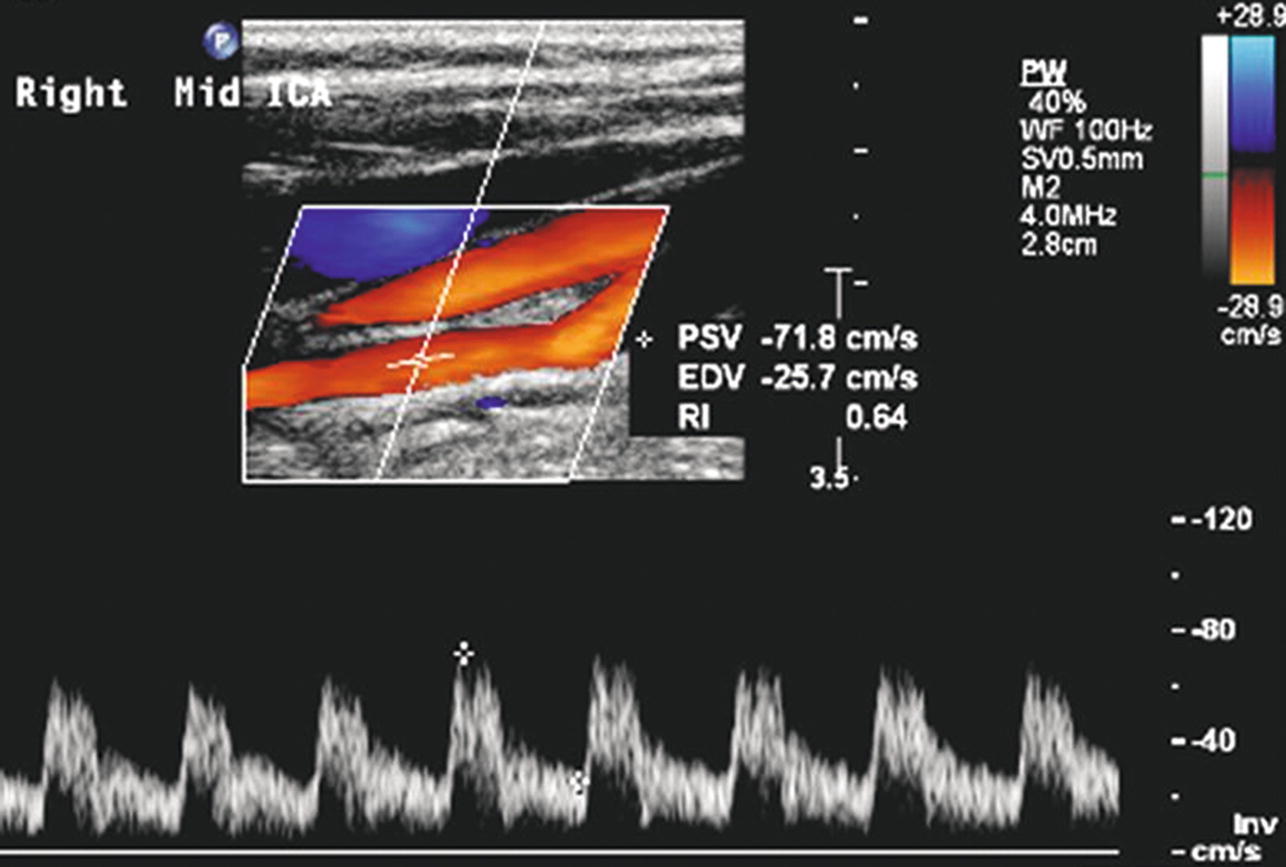
FIGURE 8.7. Normal mid internal carotid artery (ICA) color Doppler image and spectral waveform, with a rapid systolic upstroke, continued forward flow throughout diastole, and relatively high diastolic velocities. As in the normal CCA (see Fig. 8.6), there is a clear “window” under the systolic peak, indicating laminar flow. This is a typical low-resistance arterial flow pattern. Peak systolic velocity (PSV) is 72 cm/s, with end-diastolic velocity (EDV) of 26 cm/s.
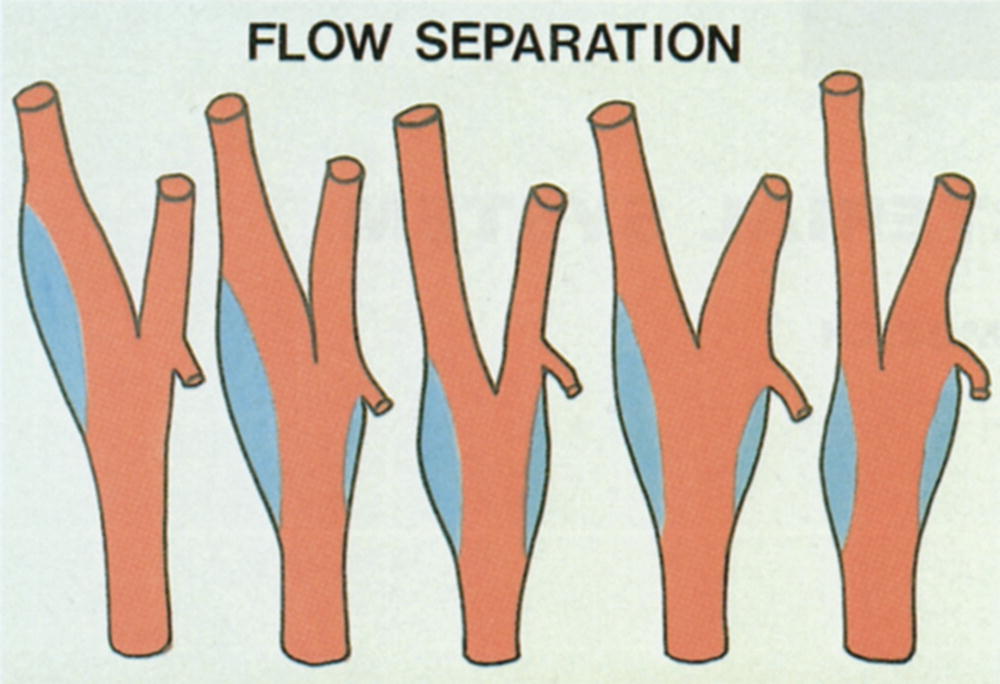
FIGURE 8.8. Illustration of variations in the location and extent of the carotid bulb. The most common configurations are the two at the left of the figure. The blue areas represent regions of flow separation (see text).
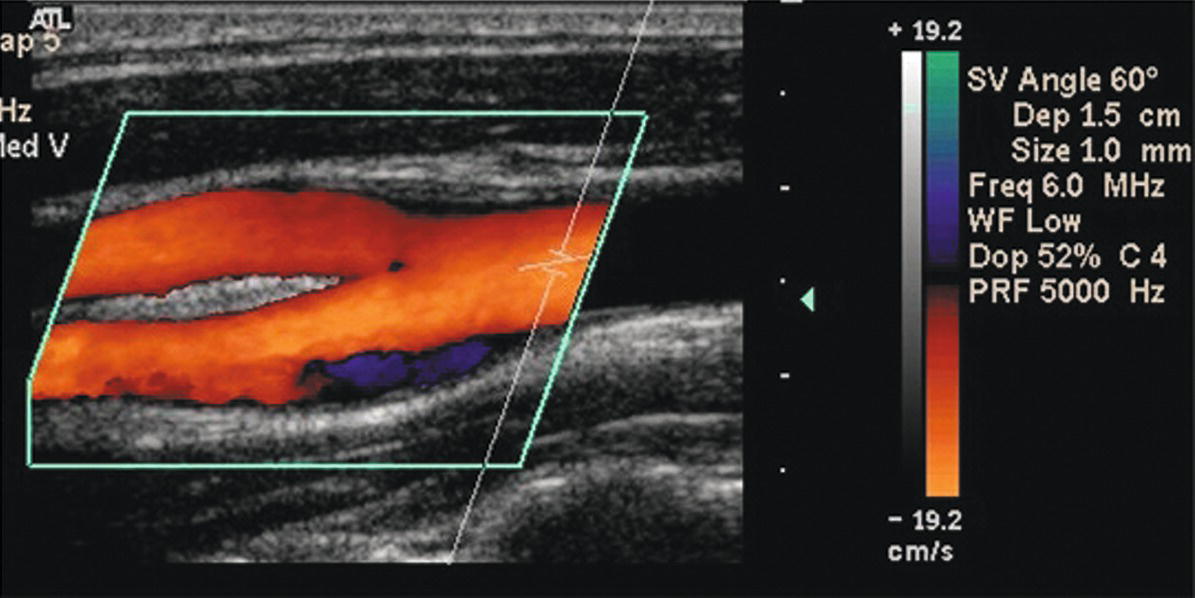
FIGURE 8.9. Color Doppler image of a normal CCA bifurcation. The area of flow reversal (dark blue) along the outer wall of the bulb is a normal finding and indicates an absence of plaque. This is referred to as an area of flow separation (see text).
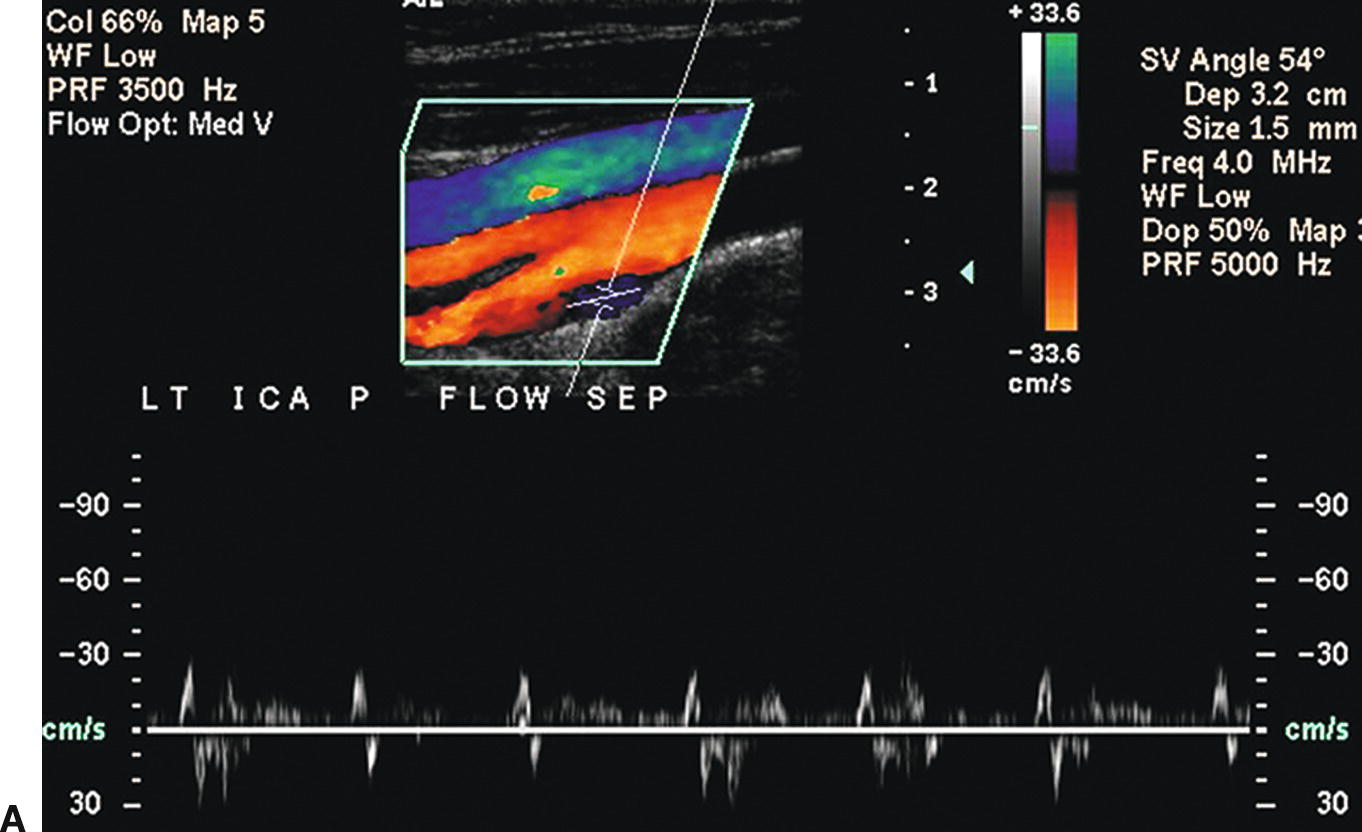
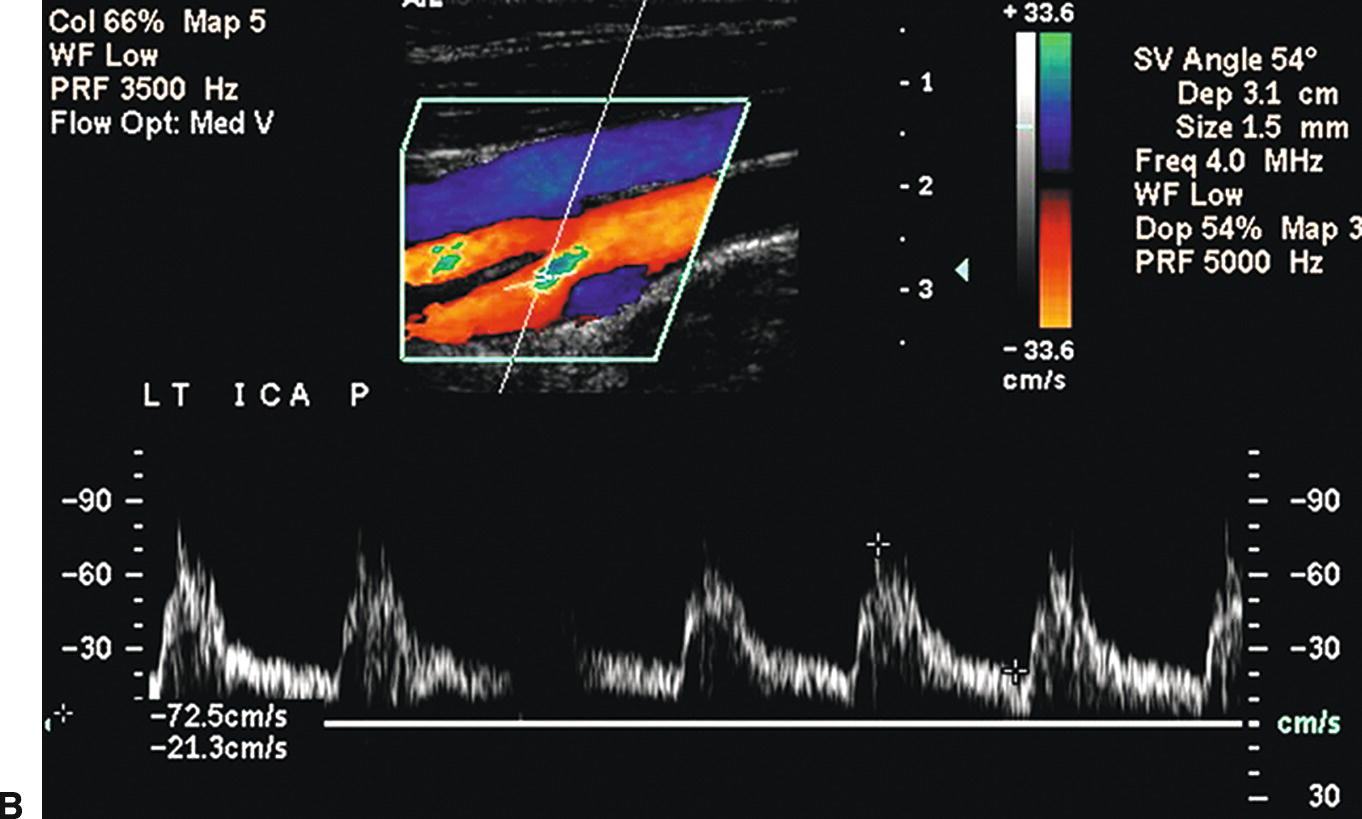
FIGURE 8.10. A,Color Doppler image and spectral waveform of a normal carotid bulb with the sample volume placed near the outer wall in the region of flow separation. The spectral waveform shows relatively low velocities with periods of forward and reverse flow during the cardiac cycle. B,The sample volume has been moved to a location near the inner wall or flow divider where there are higher velocities and a unidirectional flow pattern, typical of a normal internal carotid artery (ICA) (see Fig. 8.7).
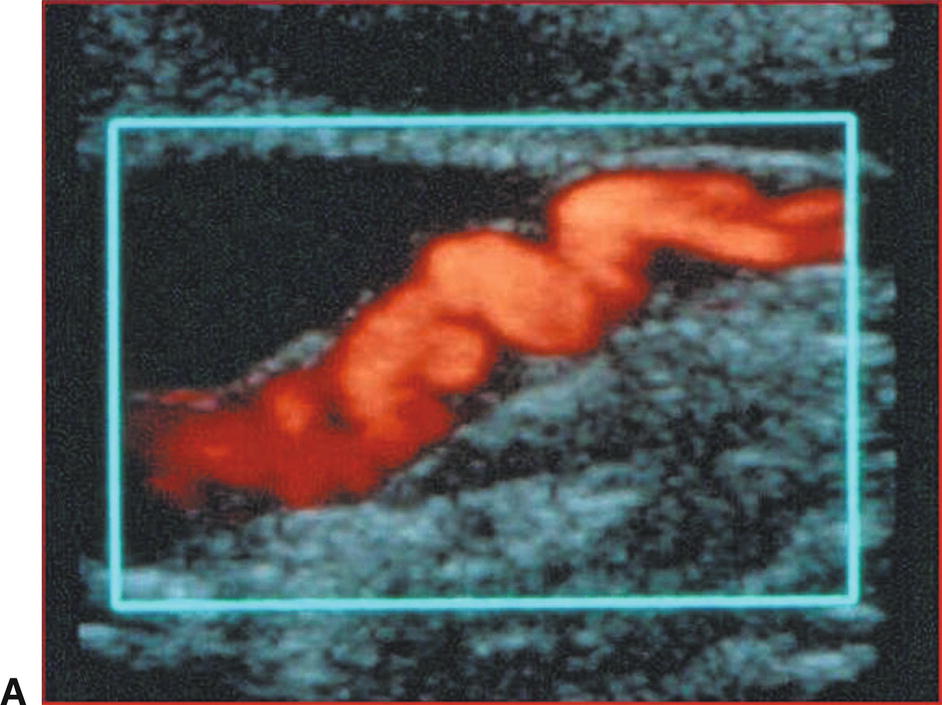
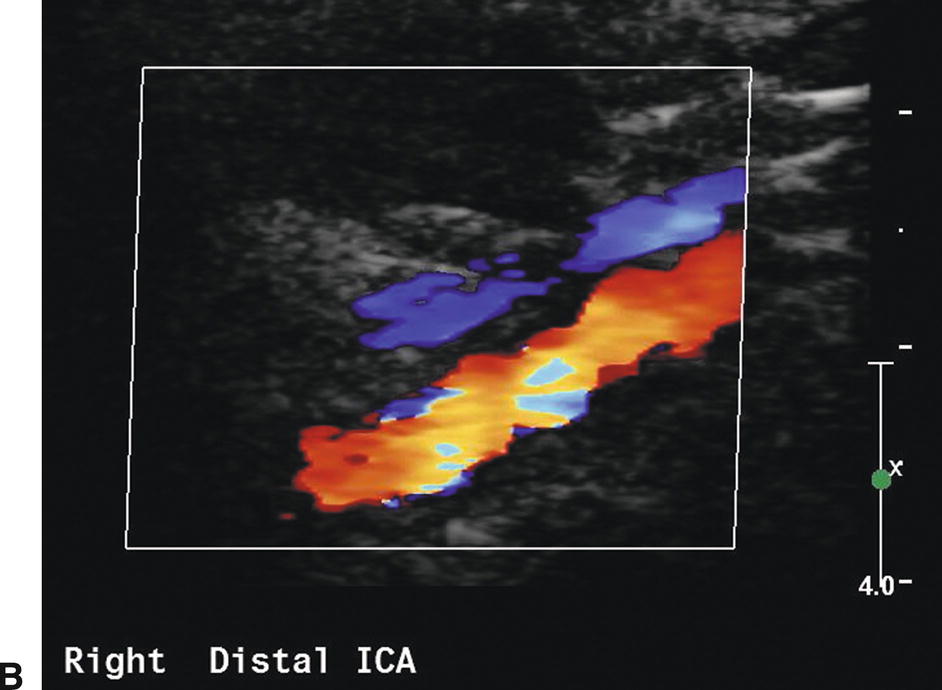
FIGURE 8.11. A,Power Doppler image of the distal cervical ICA in a patient with fibromuscular dysplasia. B,Color Doppler image of the distal cervical internal carotid artery (ICA) in another patient with fibromuscular dysplasia. In both images, there is localized irregularity of the arterial wall, resulting in focal areas of velocity increase.
Flow Patterns with Carotid Stenosis
Detecting carotid stenosis with Doppler spectral waveforms focuses on three areas: the prestenotic region, the site of stenosis, and the poststenotic region. Although the most important Doppler findings are observed by sampling at the stenotic site, the pre- and poststenotic regions also provide valuable diagnostic information (Fig. 8.12). Complete characterization of carotid stenosis involves a combination of Doppler spectral waveform analysis, color Doppler, gray-scale (B-mode) imaging, and, in selected cases, power Doppler. However, spectral analysis is the predominant modality for quantification of carotid stenosis. In most cases, color Doppler imaging is not the primary means for assessing the severity of an ICA stenosis. An exception is in distinguishing ICA occlusion from a high-grade stenosis, in which color or power Doppler may identify very low velocity flow in the area of the stenosis that cannot be detected by conventional pulsed Doppler.
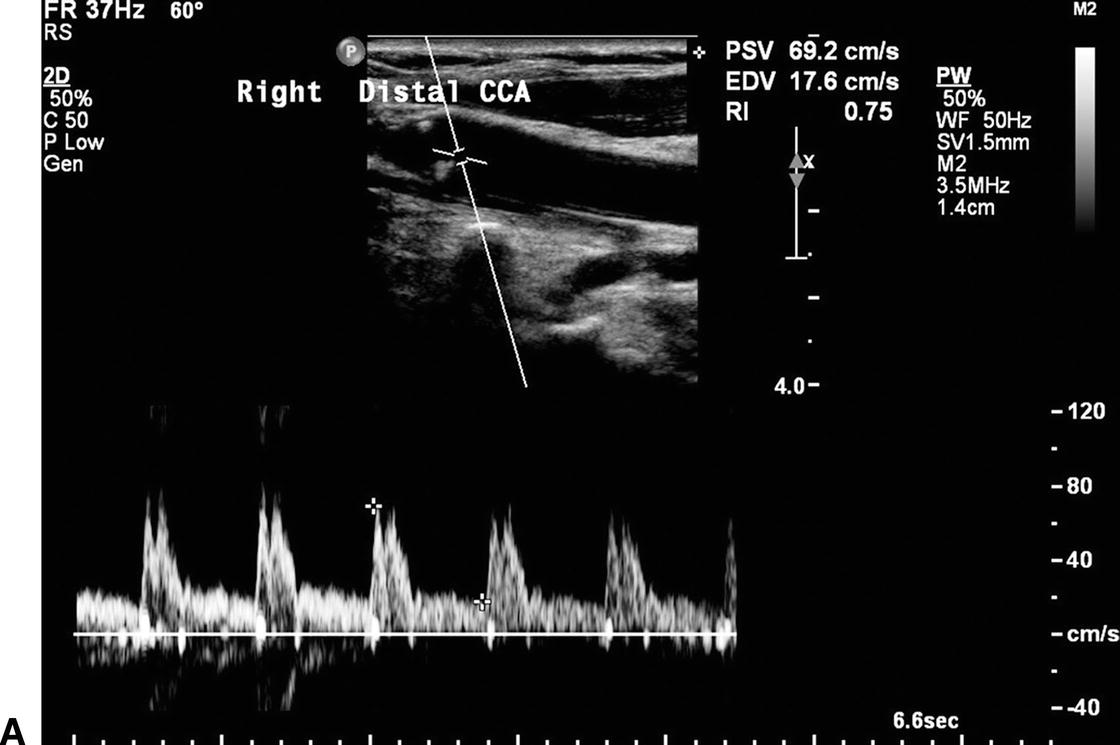
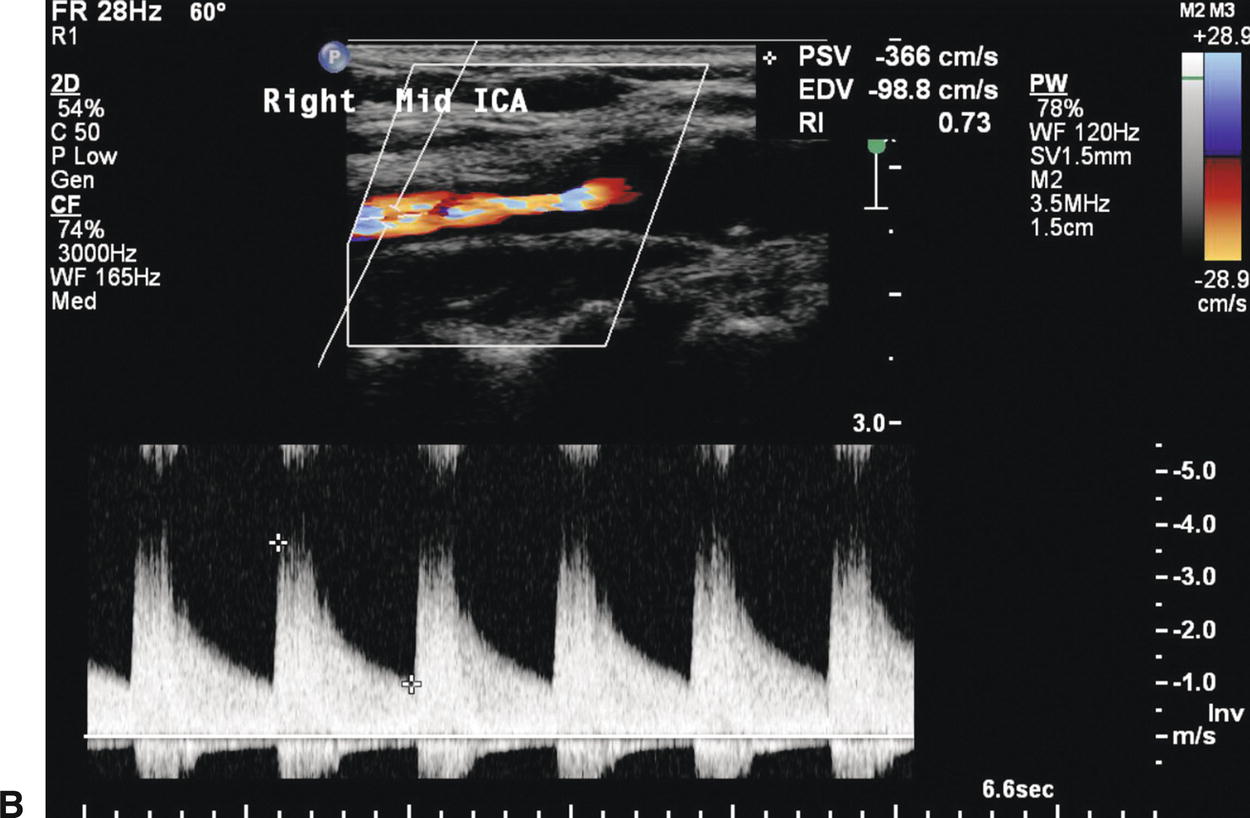
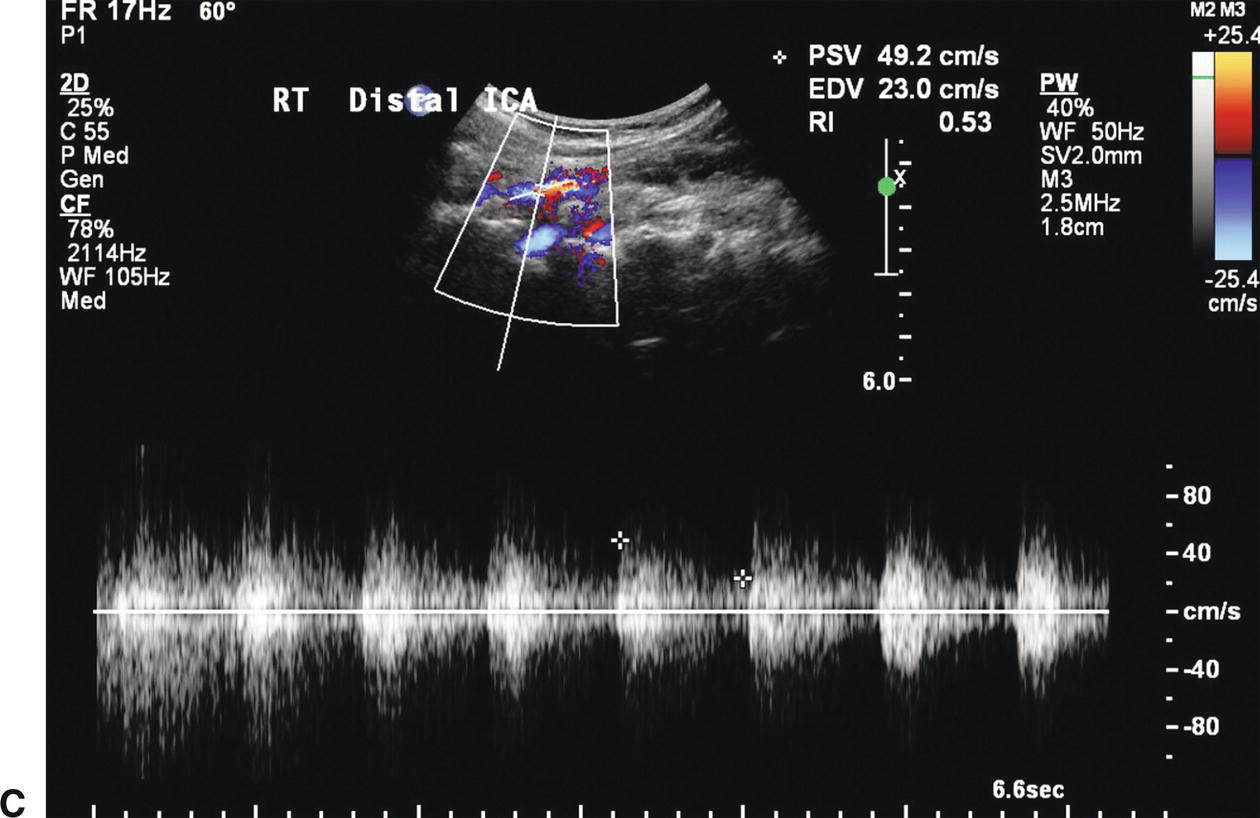
FIGURE 8.12. Information on the presence and severity of a carotid stenosis is obtained by sampling flow from the prestenotic region, the site of stenosis, and the poststenotic region. A,The flow pattern proximal to a severe stenosis depends on the intervening branches and collaterals. This spectral waveform from a distal common carotid artery (CCA) proximal to a stenotic internal carotid artery (ICA) shows a relatively low peak systolic velocity (PSV) of 69 cm/s, but the flow pattern is otherwise normal due to the patent ispilateral ECA. B,The PSV within the mid ICA stenosis is increased to 366 cm/s. C,The poststenotic spectral waveform taken from the distal ICA shows turbulent flow (spectral broadening) with a decreased PSV of 49 cm/s.
The pulsed Doppler spectral waveforms and color Doppler findings should be cross-checked for concordance. If there is disagreement between the impressions obtained with the color and the pulsed Doppler examinations (i.e., color Doppler suggests high-grade stenosis but velocities are only moderately elevated), the findings of both should be reviewed to resolve the discrepancy.
Common Carotid Artery
In the majority of cases, carotid stenosis or occlusion occurs in the proximal ICA. Consequently, the CCA exhibits flow patterns typical of a prestenotic region. In the presence of a very high-grade ICA stenosis or occlusion, outflow is primarily through the high-resistance ECA circulation. In this situation, the CCA spectral waveform takes on the high-resistance flow characteristics of the ECA (Fig. 8.13), with flow velocity going to zero (or close to zero) at end-diastole.7 In addition, the PSV and the overall flow velocity may be substantially lower than normal owing to reduced flow volume in the CCA. By observing these changes in the CCA flow pattern, one can often predict the presence of high-grade stenosis or occlusion of the ICA. For this and other reasons, it is good practice to begin the interpretation of carotid ultrasound studies by comparing the CCA Doppler spectral waveforms side to side.
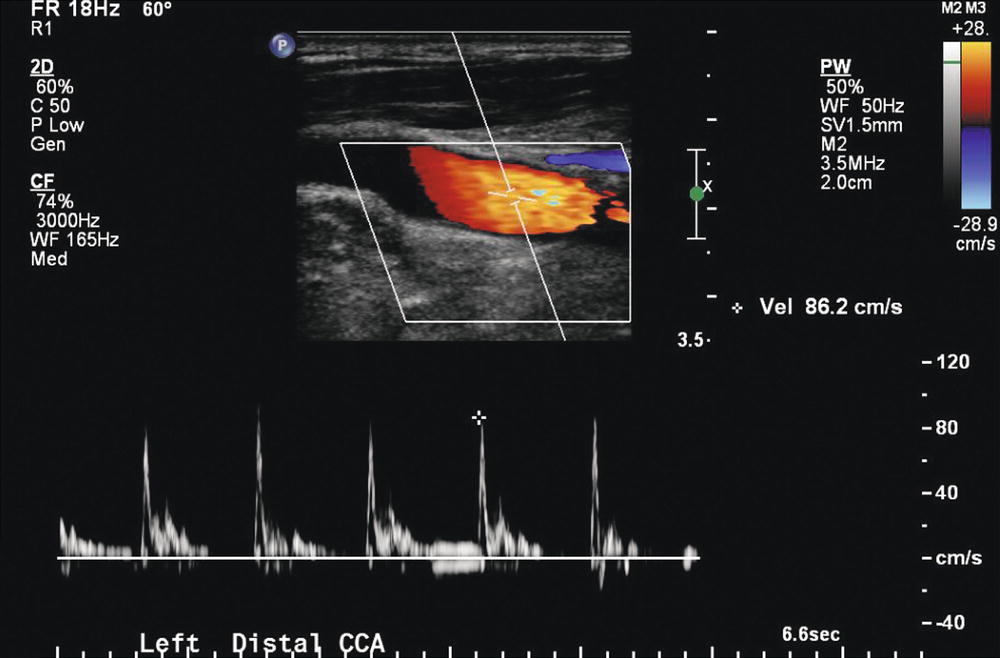
FIGURE 8.13. Distal left common carotid artery (CCA) waveform in a patient with left ICA occlusion. When the ICA is occluded, the CCA waveform takes on the high-resistance flow pattern of an ECA. There may be a phase of reversed flow in late systole/early diastole and flow to, or nearly to, the zero flow baseline at end-diastole.
The CCA contralateral to a high-grade ICA stenosis or occlusion may demonstrate an increased flow velocity with particular elevation of the end-diastolic velocity (EDV). These changes represent a compensatory increase in blood flow as the nonobstructed ICA provides collateral flow to the contralateral cerebral hemisphere through the circle of Willis (see Chapter 9). This compensatory increase in flow can be substantial, and flow velocities related to a stenosis may be artificially elevated on the side with high-volume flow.1
In the presence of a significant stenosis at the origin of the CCA or innominate artery, the ipsilateral CCA waveform may be dampened, with low overall PSV and a slower rise to peak systole when compared with the contralateral CCA waveform (Fig. 8.14). In such cases, the cervical CCA represents the poststenotic region, rather than the prestenotic region as occurs with ICA stenosis. It is very important to recognize the CCA flow pattern caused by a proximal stenosis, because it is often the only indication of clinically significant carotid occlusive disease that may be treatable. The CCA waveform changes associated with proximal stenosis are also important diagnostically because the overall reduction in flow velocity may artificially lower velocities in an ipsilateral ICA stenosis, leading to underestimation of the severity of that lesion. In some cases of proximal CCA or innominate artery stenosis, the ipsilateral CCA waveform may exhibit poststenotic turbulence low in the neck, representing disturbed flow distal to the more proximal stenosis.
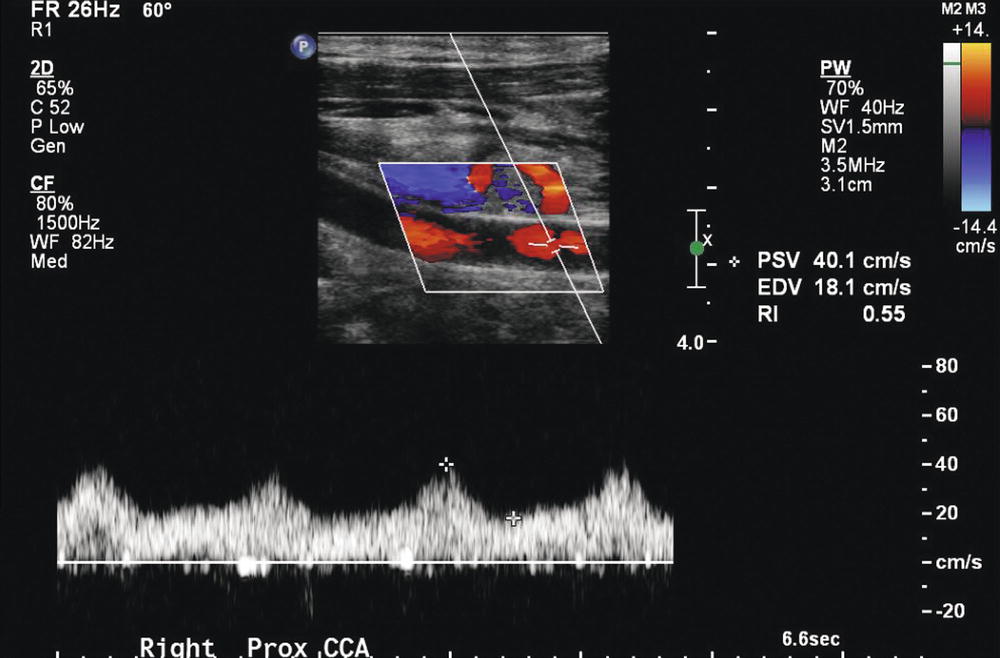
FIGURE 8.14. Right common carotid artery (CCA) waveform in a patient with a high-grade innominate artery stenosis. In the presence of a significant stenosis at the origin of the CCA or in the innominate artery, the ipsilateral CCA waveform may be dampened, with low peak velocities and a slower rise to peak systole than those found in the contralateral CCA waveform. This waveform is severely dampened with a decreased PSV of 40 cm/s.
Internal Carotid Artery
The normal ICA spectral waveform is indicative of high-volume flow in a low-resistance vascular bed. The systolic upstroke is rapid, PSV is less than 125 cm/s, and forward flow is maintained throughout diastole.8 In the absence of plaque, there is generally a clear “window” under the systolic peak of the spectral waveform because there is little turbulent flow, as shown in Figure 8.7. On color Doppler, the presence of color shifts, indicating high-velocity flow, and color mosaics, indicating poststenotic turbulence, aids in selecting potential areas for examination with the pulsed Doppler. Lack of diastolic flow in an ICA indicates distal cervical ICA high-grade stenosis or intracranial stenosis or occlusion (Fig. 8.15).
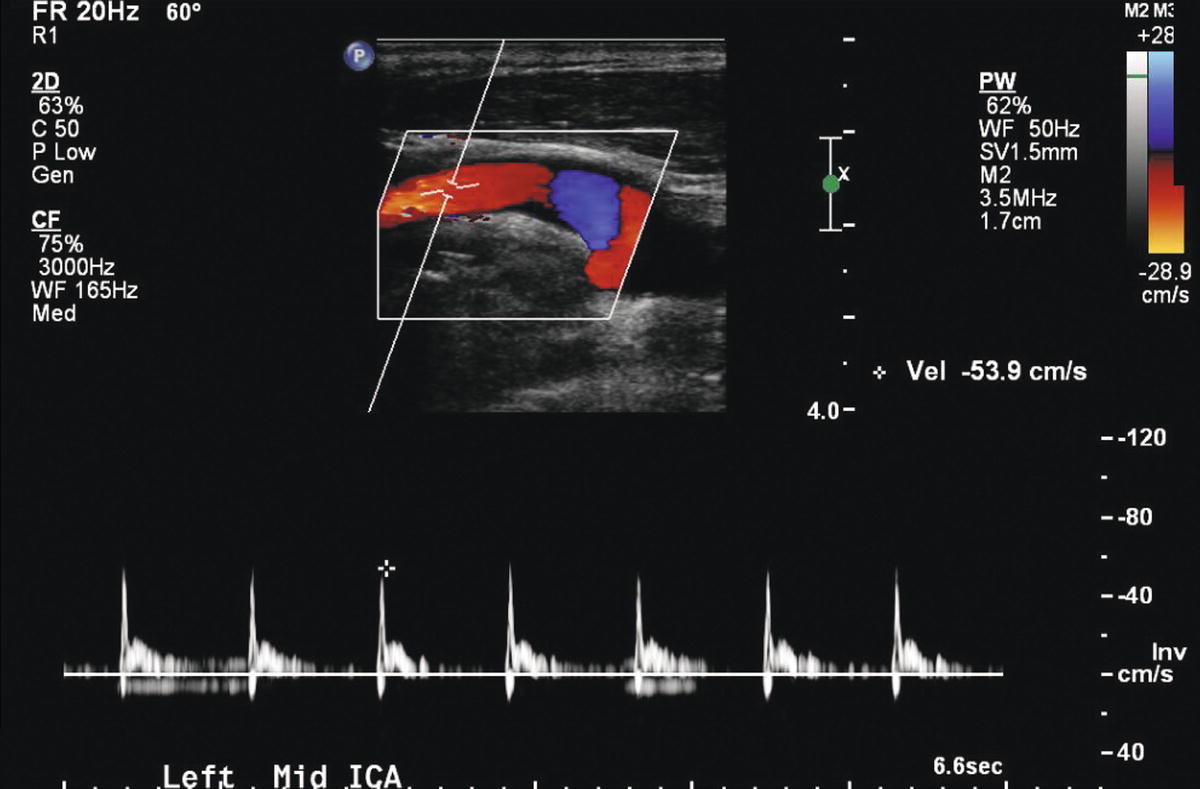
FIGURE 8.15. This internal carotid artery (ICA) spectral waveform shows a high-resistance pattern with absent diastolic flow in a patient with a left hemispheric stroke and acute occlusion of the ipsilateral anterior and middle cerebral arteries.
Hemodynamic quantification of ICA stenosis severity is primarily achieved by analysis of Doppler spectral waveforms and measurements of PSV and EDV, or comparisons of PSV in the ICA with those in the CCA (ICA/CCA ratio). As a stenosis develops, the PSV becomes elevated first, making PSV the principal measure of stenosis severity. The increase in EDV lags behind PSV as stenosis severity progresses, but EDV rises rapidly as the stenosis becomes severe (diameter reductions of ≥60%). Thus, elevation of EDV is a good marker for high-grade ICA stenosis (Fig. 8.16).9 The ICA/CCA ratio is also a very important measure of stenosis severity.10 Because it is a ratio, it compensates for abnormally high- and low-flow states that may skew the PSV and EDV upward or downward.
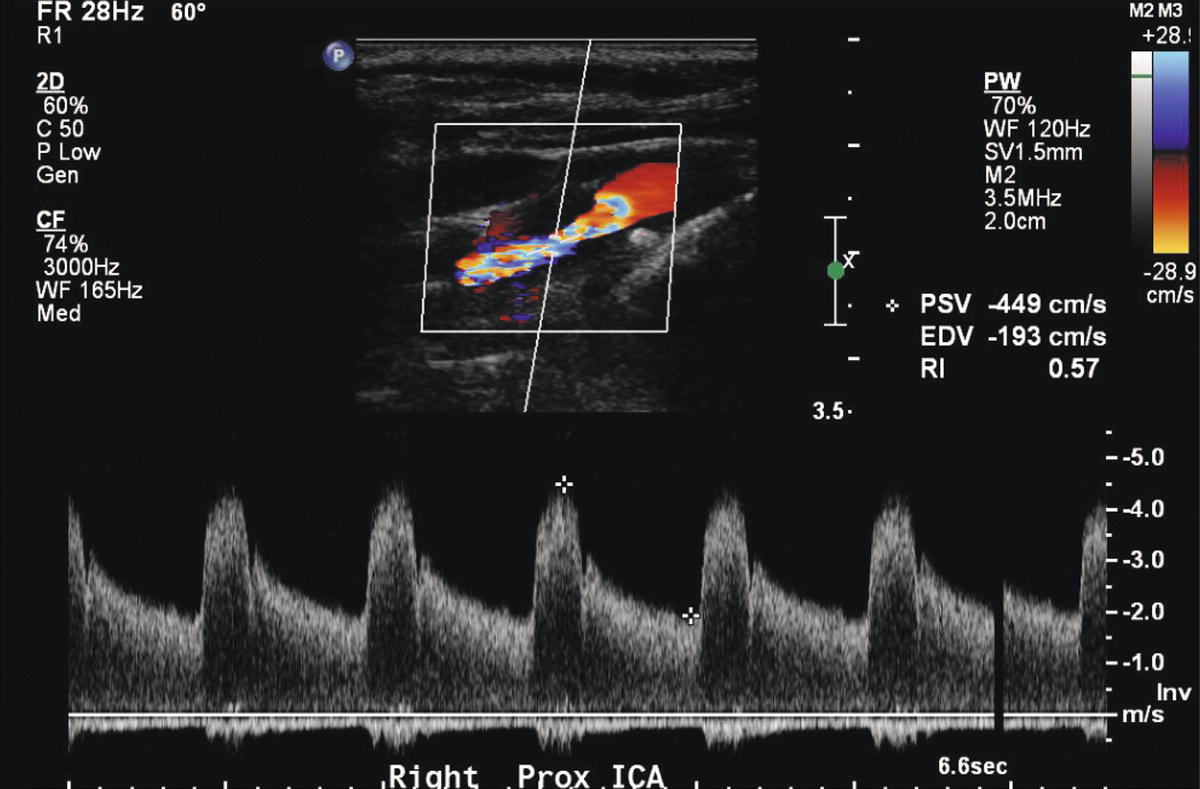
FIGURE 8.16. Color Doppler image and spectral waveform from a severe, 80% to 99% internal carotid artery (ICA) stenosis. The color shifts indicate a high velocity jet and the spectral waveform shows an increased peak systolic velocity (PSV) of 449 cm/s and markedly elevated end-diastolic velocity (EDV) of 193 cm/s. See Table 8.1 for velocity criteria.
To accurately measure flow velocity and classify stenosis severity, the pulsed Doppler sample volume must be placed within the area of greatest stenosis. Color Doppler imaging has demonstrated that the orientation of the stenotic jet within a stenosis is frequently not parallel to the longitudinal axis of the vessel. This finding has resulted in controversy with regard to the proper technique of Doppler angle adjustment for obtaining velocity waveforms at sites of stenosis. In areas of mild to moderate stenosis, a Doppler angle of 60 degrees to the long axis of the vessel is recommended. However, in areas of more severe stenosis, the Doppler angle of 60 degrees should be defined by the long axis of the stenotic flow jet, as demonstrated by color Doppler.
The pulsed Doppler sample volume size should be kept as small as possible, usually 1.5 mm, to detect discrete changes in flow velocity. This is important because the highest velocities may be localized to a small area in the flow jet that emanates from the stenosis. A large sample volume that incorporates flow from many points within the vessel in the generation of spectral waveforms may give the false impression of disturbed flow, potentially leading to the misdiagnosis of moderate disease in an otherwise normal vessel. In practice, the sonographer identifies the area of stenosis and carefully sweeps a small sample volume through until the point of highest velocity is found.
Damping of Doppler spectral waveforms may be seen in the region distal to a carotid stenosis when the lesion is severe and flow reducing. The most common waveform abnormality seen distal to a carotid stenosis is spectral broadening caused by disturbed blood flow or frank turbulence. At best, a poststenotic flow disturbance is a qualitative measure of arterial stenosis; nevertheless, its detection is important. With proper gain settings, spectral broadening or “filling-in” of the Doppler spectral waveform generally indicates the presence of carotid stenosis with a diameter reduction of at least 50%. However, this level of disturbed flow occasionally can be seen with nonstenotic disease. Diagnostically, the most significant poststenotic flow disturbance produces simultaneous forward and reverse spectral waveform components, accompanied by poor definition of the upper spectral waveform border. Such disturbed flow implies the presence of severe carotid stenosis. Severely disturbed flow distal to a highly calcified plaque may be the only substantial evidence for the presence of clinically significant stenosis if calcification prevents direct insonation of the stenotic site.
Vertebral Artery
On rare occasions, a stenosis may be found in the cervical portion of the vertebral artery associated with cervical osteoarthritis. However, the origin of the vertebral from the subclavian artery is by far the most common site of disease in the vertebral artery. The vertebral artery origin lies deep in the base of the neck and may be difficult to access with ultrasound. Mean vertebral artery diameter is about 4 mm, but the vertebral arteries are frequently asymmetrical in size with one (most commonly the left) being larger than the other.
The vertebral artery is most commonly interrogated with ultrasound farther distally in the neck, from an anteroposterior window, as it passes through the transverse processes of the cervical spine. The transverse processes serve as a reference to ensure that the vertebral artery is actually under examination, as illustrated in Figure 8.17. The artery is usually visualized deeper but adjacent to the vertebral vein. Color Doppler is helpful to locate the vessel. A spectral waveform from the vertebral artery in the mid-neck provides information about direction of flow, waveform shape, and velocity, but it does not always rule out stenotic disease at the origin. The normal vertebral artery waveform is similar to that of the ICA, with PSV in the range of 20 to 40 cm/s and diastolic flow well above the baseline.11 However, velocities up to 80 to 90 cm/s are frequently seen without apparent clinical importance and may represent collateral flow through a dominant vertebral artery or a small but otherwise normal vertebral artery. Evaluation of disturbed flow distally may help determine which elevated velocities are associated with a vertebral artery stenosis and which are not. Velocity patterns are usually similar in the two vertebral arteries, but systolic and diastolic velocities may differ if vertebral artery diameters are asymmetrical. For this reason, if there is concern for stenosis based on an elevated PSV in a vertebral artery, recording of vertebral artery diameters is important.
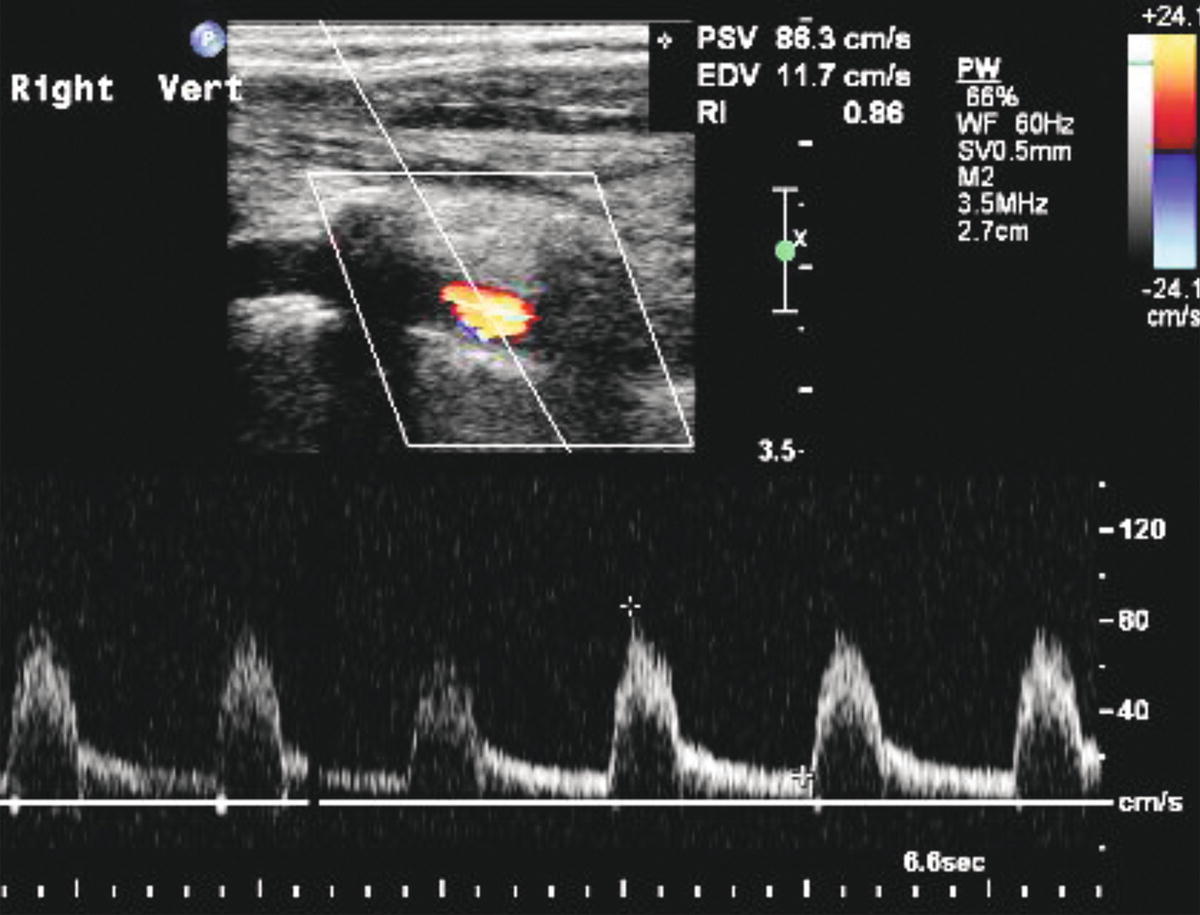
FIGURE 8.17. Color Doppler image and spectral waveform from a normal vertebral artery showing the “color voids” secondary to the transverse processes of the cervical vertebrae that serve as a reference to ensure that the vertebral artery is the vessel under examination. The spectral waveform shows a low-resistance flow pattern with a peak systolic velocity (PSV) of 88 cm/s.
Stay updated, free articles. Join our Telegram channel

Full access? Get Clinical Tree


