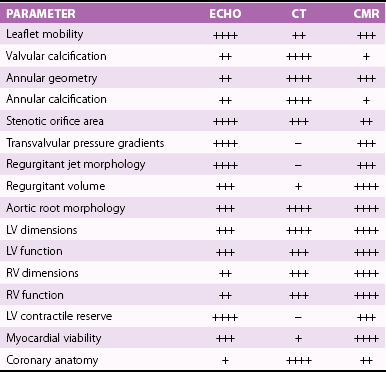
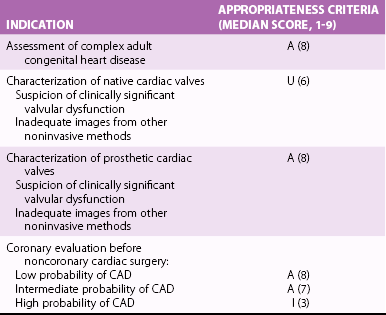
Chapter 8 Cardiac magnetic resonance (CMR) and computed tomography (CT) imaging provide complementary information about valve anatomy and hemodynamic function that could be relevant for management decisions in selected patients. In addition, patients undergoing CMR and CT for a variety of indications are often incidentally found to have unsuspected valve disease. This chapter reviews the principles and use of these imaging techniques as applied to the evaluation of the cardiac valves. Indications for, relative utility of, and appropriate use criteria of CT and CMR for the evaluation of patients with valvular heart disease are listed in Tables 8-1 to 8-3. TABLE 8-1 Comparison of Echocardiography, CT, and CMR for Characterizing Cardiovascular Structural and Functional Parameters in Valvular Disease * *Ratings: −, unable; +, very limited; ++, marginal; +++, adequate; ++++, excellent. TABLE 8-2 CT and CMR Methods for Evaluating Stenotic and Regurgitant Lesions TABLE 8-3 Criteria for Appropriate Use of CMR in Patients with Valvular Heart Disease A, appropriate; CMR, cardiac magnetic resonance; LV, left ventricular; RV, right ventricular. From Hendel RC, Patel MR, Kramer CM, et al. ACCF/ACR/SCCT/SCMR/ASNC/NASCI/SCAI/SIR 2006 appropriateness criteria for cardiac computed tomography and cardiac magnetic resonance imaging. J Am Coll Cardiol 2006;48:1475–97. In patients with chronic valvular disease, changes in left ventricular (LV) size, mass, and function are critical for establishing the timing of surgical intervention. CMR is a superior method for quantifying LV volumes, ejection fraction, and mass. Cine (bright-blood) ECG-gated two-dimensional images may be obtained in any of the conventional two-chamber, three-chamber, or four-chamber long-axis or cross-sectional short-axis planes. For the purpose of quantification, a stack of 10 to 20 contiguous 5- to 10-mm-thick short-axis images are acquired from the base to the apex of the left ventricle, during breath-holding. 1 These images may be then traced offline in a dedicated computer workstation. Volumetric quantification is based on the Simpson rule, for which the volume of the left ventricle equals the sum of the 10 to 20 cross-sectional discs. LV mass is calculated by subtracting the endocardially from the epicardially traced volumes and multiplying by a muscle weight–specific constant. CMR yields more accurate values than angiographic or echocardiographic planar imaging methods, especially when the ventricular shape deviates from the normal geometric model, because in the latter methods, fewer images are used and most of the data are interpolated.2,3 In addition, CMR is superior for visualization of the true LV apex, which is often outside the acoustic echocardiographic windows. Several studies have validated CMR measurements of LV volumes, mass, and function using quantitative reference techniques, such as indicator dilution, radionuclide angiography, and studies of postmortem examination.4–6 CMR is the best method for longitudinal follow-up of LV mass and volumes to determine the effect of therapeutic interventions owing to its excellent interstudy reproducibility with an intertest variability less than 5%.7–10 CMR has been used to evaluate sequential changes in LV and right ventricular (RV) geometry in response to chronic mitral regurgitation. 11 CMR is been used increasingly in clinical trials, allowing reduction in the sample size required to detect a difference between treatment arms.12–14 CMR is also useful for calculating LV wall stress using measurements of wall thickness and chamber dimensions in conjunction with cuff blood pressures and a carotid pulse tracing. Increased wall stress in patients with chronic valvular regurgitation has been shown to predict adverse events and deterioration of LV function. 15 CT also allows accurate quantification of LV volumes, ejection fraction, and mass.16,17 In fact, early studies suggested that EBCT was a reference standard for evaluation of other methods of calculating LV volumes in patients with valvular heart disease. 18 The main advantage of CT is its isotropic, submillimeter spatial resolution, which allows easy, direct 3D volumetric assessment, in many cases with the use of automated border detection algorithms. However, the limited temporal resolution of CT may result in overestimation of the true end-systolic volume, particularly in patients with elevated heart rate. Moreover, the rapid infusion of contrast material and use of beta-blockers may result in slightly larger LV volumes and reduced ejection fractions. In many patients with valvular disease, in particular those with AS, diastolic dysfunction is an important contributor to symptoms and prognosis. CMR has been used to evaluate diastolic filling on the basis of regional myocardial diastolic velocities and strain. 19 In addition, the 3D pattern of LV filling and pulmonary venous flow has been evaluated with phase-contrast velocity–encoded data.20,21 In patients with LV hypertrophy due to AS, CMR-determined early filling and atrial contraction velocities have been shown to correlate with Doppler echocardiographic measurements and have shown a higher atrial contribution to ventricular filling in the patients than in control subjects. 22 CMR is the most reliable way to assess regional and global RV function quantitatively.23,24 Furthermore, CMR may give an unrestricted view of the RV outflow tract. The end-diastolic and end-systolic velocities are calculated by the manual drawing of endocardial contours at end-diastole and end-systole, respectively, on cine loops, oriented in the axial plane or along the short axis of the left ventricle. Ejection fraction and RV mass are determined in a fashion similar to that used in the left ventricle. Several studies have validated CMR volume measurements of dimensions and function of the right ventricle using quantitative catheterization, postmortem, and radionuclide techniques.25–28 Thus, this approach offers the potential for more reliable evaluation of RV size and function in patients with valvular disease than with echocardiography. Assessment of RV volumes and function is important in patients with severe tricuspid or pulmonary regurgitation, including assessment after repair of tetralogy of Fallot. 29 In these patients, RV function is an important determinant of long-term prognosis after surgical correction. 30 CT may also be used to evaluate RV volumes and ejection fraction. In order to visualize the RV endocardium, the contrast injection protocol is modified, with use of a biphasic or triphasic contrast injection, depending on what additional information is sought in the study. CT may be useful to evaluate RV size and function in patients with poor acoustic transthoracic echocardiography (TTE) windows and in those with contraindications to CMR, such as implanted left-ventricular assist devices. 31 The use of CMR is well established for detecting the presence of and quantifying the severity of valve stenosis ( Table 8-4). Cine gradient-echo CMR can identify valvular stenosis or regurgitation because areas of turbulent flow create a signal void in the high-intensity blood pool (Video 8-1). 32 This signal void may allow identification of the site of obstruction, for example, differentiating subvalvular from valvular stenosis. 33 TABLE 8-4 Criteria for Appropriate Use of CT in Patients with Valvular Heart Disease A, appropriate; CAD, coronary artery disease; I, inappropriate; U, uncertain. Modified from Taylor AJ, Cerqueira M, Hodgson JM, et al. ACCF/SCCT/ACR/AHA/ASE/ASNC/NASCI/SCAI/SCMR 2010 Appropriate Use Criteria for Cardiac Computed Tomography. Circulation 2010;122:e525–55. where ΔP is pressure and V is velocity. To obtain the maximal velocity, the plane of interrogation must be set perpendicular to the direction of flow, and then several phase-contrast sections are obtained near the vena contracta of the jet to identify the maximum velocity. The velocity-encoding gradient needs to be adjusted often to encompass the predicted velocity range. As in Doppler echocardiography, aliasing occurs if the measured velocity exceeds the interrogation range. There is good agreement between CMR-determined aortic valve pressure gradients and other reference techniques, with reported accuracy rates of 85% and interobserver reproducibility of 93%. Calculation of continuity equation aortic valve orifice area, using phase-contrast velocity mapping, have also been found to be reliable, with a reported accuracy of 81% in comparison with that for the Doppler-derived continuity equation and the Gorlin formula. 34 Echocardiography remains the most useful modality for the evaluation of AS. However, in many patients, the transvalvular gradient determined by continuous-wave Doppler echocardiography may underestimate stenosis severity because of an inadequate Doppler angle of interrogation or reduced cardiac output. The continuity-equation aortic valve area (AVA) may also be inaccurate owing to inadequate measurements of LV outflow tract dimensions or incorrect sampling of pulsed Doppler velocities. 35 Direct planimetry ( Figure 8-1) of the aortic orifice is another method for determination of stenosis severity, but the accuracy is limited by TTE and even by transesophageal echocardiography (TEE) because of the acoustic shadowing produced by heavy leaflet calcification. FIGURE 8-1 Calcific aortic stenosis.
Evaluation of Valvular Heart Disease by Cardiac Magnetic Resonance and Computed Tomography
 Key Points
 Echocardiography is the modality of choice for the evaluation of the heart valves, providing both anatomic and functional information with high temporal and spatial resolution. Cardiac computed tomography (CT) and cardiac magnetic resonance (CMR) may be useful, however, in patients with suboptimal acoustic windows and in those in whom more detailed information of the cardiac and vascular anatomy is needed.
VALVULAR LESION
MODALITY
METHOD
Stenosis
CT
Calcium scoring
CT
Stenotic orifice planimetry
CMR
Stenotic orifice planimetry
CMR
PC-VENC pressure gradients
CMR
PC-VENC continuity valve area
CMR
PC-VENC pressure half-time (mitral)
Regurgitation
CT
Regurgitant orifice planimetry
CT
Regurgitant volume (LV-RV stroke volume difference)
CMR
PC-VENC aortic regurgitant volume
CMR
Regurgitant volume (LV-RV stroke volume difference)
CMR
Regurgitant volume (Ao-PA stroke volume difference)
CMR
Regurgitant volume (Ao–mitral valve inflow stroke volume difference)
CMR
Vena contracta
CMR
Flow acceleration radius
CMR
Signal void area
INDICATION
APPROPRIATENESS CRITERIA (MEDIAN SCORE)
Assessment of complex congenital heart disease, including anomalies of coronary circulation, great vessels, and cardiac chambers and valves
Procedures may include LV/RV mass and volumes, CMR angiography, quantification of valvular disease, and contrast enhancement
A (9)
Quantification of LV function
Discordant information that is clinically significant from prior tests
A (8)
Characterization of native and prosthetic cardiac valves, including planimetry of stenotic disease and quantification of regurgitant disease
Patients with technically limited images from echocardiogram or transesophageal echocardiography
A (8)
Ventricular Volumes, Mass, and Function
The Left Ventricle
The Right Ventricle
Valvular Stenosis

Aortic Stenosis
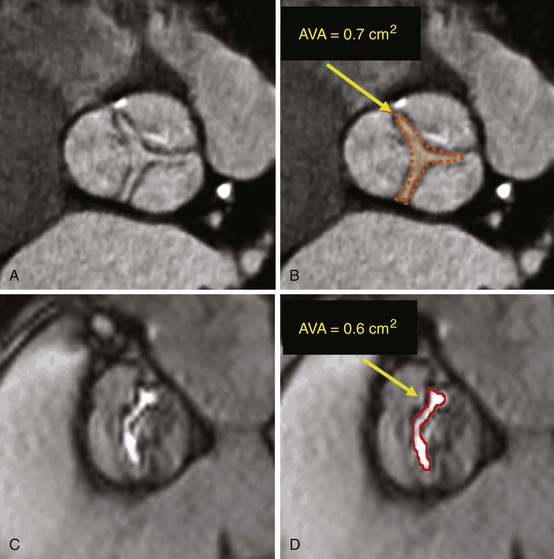
Short-axis cardiac computed tomography images obtained in a patient with stenosis of a trileaflet aortic valve (A, B) and cardiac magnetic resonance image obtained in a patient with bicuspid aortic valve (C, D), showing the method for determination of aortic valve area (AVA) by planimetry.![]()
Stay updated, free articles. Join our Telegram channel

Full access? Get Clinical Tree


Evaluation of Valvular Heart Disease by Cardiac Magnetic Resonance and Computed Tomography


Only gold members can continue reading. Log In or Register to continue
