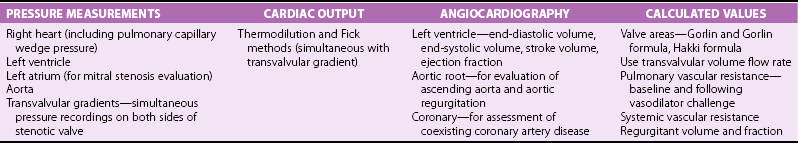
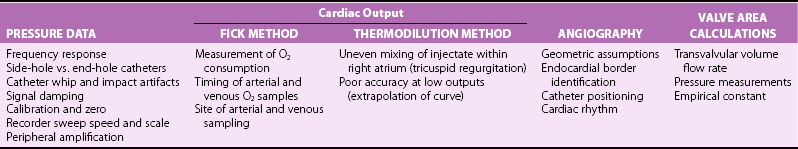
Chapter 7 Cardiac catheterization and angiocardiography continue to play an important role in the management of patients with valvular heart disease. 1 Although in the majority of patients, information obtained from the history, physical examination, and noninvasive imaging studies (electrocardiogram, chest radiograph, and echocardiogram) is sufficient to establish the correct diagnosis and allow appropriate clinical decision making, including referral for percutaneous or surgical intervention, cardiac catheterization and angiocardiography are often required in select patients with valvular heart disease. They include patients (1) who require coronary angiography prior to surgical intervention, (2) who have complex multivalve disease for which data from echocardiography and cardiac catheterization must be integrated, (3) who have suboptimal echocardiographic imaging results (large body habitus, obesity, chronic lung disease), (4) in whom discrepancies exist between the clinical information and findings from echocardiography, (5) in whom the diagnosis remains uncertain despite echocardiography and additional no-invasive imaging studies, (6) with low-gradient aortic stenosis (AS) when the administration of dobutamine can differentiate between true and “pseudo”–aortic stenosis, and (7) being evaluated for transcutaneous aortic valve implantation. Various protocols can be used in the cardiac catheterization laboratory to evaluate patients with valvular heart disease ( Table 7-1). The fundamental basis of each approach relies on the premise that obtaining accurate and detailed measurements during the procedure is essential so that the subsequently derived data remain accurate. Pressure and cardiac output measurements should be performed prior to angiocardiography. A number of potential sources of error can be present during the cardiac catheterization laboratory procedure ( Table 7-2). The specific methods and techniques used during a cardiac catheterization procedure are selected to provide answers to specific clinical questions. The significance of the hemodynamic findings must be integrated with the complete set of clinical data, including information from the history, physical examination, electrocardiogram, chest radiograph, and echocardiogram. The relationship between LV pressure and volume throughout the cardiac cycle can be examined in detail by graphing instantaneous pressure (on the vertical axis) against volume (on the horizontal axis). LV stroke volume is the distance on the horizontal axis between end-diastole and end-systole, whereas LV stroke work (the integral of pressure times volume over the cardiac cycle) is the area enclosed by the pressure-volume loop. When pressure-volume loops are recorded under different loading conditions, the slope of the end-systolic pressure-volume relationship, termed elastance or Emax, provides a load-independent measure of LV systolic function.2,3 In practice, measurement of pressure-volume loops is technically demanding and often not required for clinical decision making. Ventricular pressures must be recorded with high-fidelity catheters, and volumes must be determined at multiple points in the cardiac cycle using either contrast or radionuclide angiography or experimental approaches such as a conductance catheter. 4 Thus, although this approach provides insight into the pathophysiology of disease and provides essential information in research studies, it is rarely used in the routine clinical management of patients with valvular heart disease. 5 and ejection fraction (EF) as: where Da and Db are the minor axis dimensions in the two orthogonal views. In the clinical setting, a single-plane right anterior oblique angiogram using the modified for mula of Dodge and Sandler 6 also provides acceptable results: Although both angiography and echocardiography depend on manual border tracing, a slight, but consistent, overestimation of LV volumes by angiography is due to filling of the ventricular trabeculations by contrast agent so that the traced endocardial border represents the outer edge of the myocardial trabeculations, in contrast to echocardiography, in which ultrasound is reflected from the inner edge of the myocardial trabeculations so that the volume tends to be underestimated slightly.7–9 In addition, the volume occupied by the papillary muscles (which are excluded from the endocardial border tracing) needs to be taken into account. Regression equations have been derived in an attempt to correct for the overestimation of volume on angiography resulting from these two factors, such as the following:10–12 where Vc is the calculated volume and V is the corrected volume. With careful angiographic technique, tracing of endocardial borders by an experienced observer, and use of appropriate correction factors, ventricular volumes derived from angiography correlate well with directly measured volumes and with echocardiographic volumes.13–16 A biplane imaging approach, using borders traced from both the right and left anterior oblique radiographic projections,17,18 provides accurate results with a mean difference for measurement variability of 6 to 10 mL for end-systolic and 7 to 20 mL for end-diastolic volumes. 19 However, ventricular mass calculations are limited by the inaccuracy in measuring LV wall thickness from the angiographic image and thus are not widely used clinically.20,21 LV angiography also allows qualitative and quantitative assessment of wall motion in patients with valvular heart disease and concurrent coronary artery disease.22,23 Oxygen serves as the “indicator” for cardiac output calculations in the Fick method. The Fick principle states that the uptake or release of oxygen by a tissue is the product of the amount of oxygen delivered to the tissue times the difference in oxygen content between the blood entering and the blood leaving the tissue. 24 Thus, for the uptake of oxygen by the lungs: where O2 consumption is measured in mL O2/min and O2 content as mL O2/100 mL blood (often referred to as “volume percent”). In clinical practice, oxygen consumption is usually measured by the polarographic O2 method or by the paramagnetic method. Collection of expired air using the Douglas bag method is rarely used. The polarographic method uses a hood or face mask with the rate of air flow through the servo unit controlled by an oxygen sensor cell to maintain a constant fractional content of oxygen. Oxygen consumption ( For accurate cardiac output calculations, it is important that the arterial and venous oxygen samples are collected from the correct sites with prompt processing of the samples and that oxygen consumption and content measurements are simultaneous. Even with careful technique, the average error in measuring oxygen consumption is approximately 6% 27 and the error in measurement of the arteriovenous oxygen difference is approximately 5%, 28 resulting in an error in cardiac output measurement of about 10% by the Fick method. 29 Measurements are more inaccurate if physiologic changes that affect cardiac output, such as heart rate and loading conditions, occur during the analysis period. Use of an assumed, rather than measured, oxygen consumption also leads to significant error because there is wide variation in the normal rate of oxygen consumption in adults.30,31 Fick cardiac outputs tend to be more accurate for low outputs, and thermodilution outputs are more accurate at high flow rates. Measurement of cardiac output by the thermodilution method is widely used in the evaluation of patients with valvular heart disease. With the thermodilution method, a known volume of cold saline is injected into the right atrium while a thermistor in the pulmonary artery continuously records temperature ( Figure 7-4). Cardiac output is then calculated from the known temperature (T) and volume (V) of the injectate, and the integral of temperature over time (ΔT/dt) in the pulmonary artery.32,33 where the constant incorporates factors for the specific gravity and specific heat of blood and the injectate (1.08 if the injectate is 5% dextrose). In addition, an empirical correction factor (multiplication by 0.825) is needed for the effect of warming of the injectate as it passes through the catheter.34,35 As with the Fick method, the thermodilution method measures the “forward” cardiac output, specifically the output of the right heart. Advantages of the thermodilution method include ease and repeatability of use, thus allowing multiple measurements over short time intervals with a reasonable accuracy (a reproducibility of about 5%-10% with proper technique). 36 Disadvantages include relatively poor accuracy at low cardiac outputs 37 and dependence on careful attention to technique, in particular the avoidance of warming of the injectate. Because this method depends on even mixing of the injectate with the right atrial (RA) blood, thermodilution output measurements are inaccurate when significant tricuspid regurgitation is present. Significant tricuspid regurgitation results in a prolonged decay in the temperature-over-time curve. Pressure gradients are most accurately measured with use of two transducers that allow for simultaneous measurement of the upstream and downstream pressures. A systematic approach to the review of pressure waveforms includes assessment of: (1) cardiac rhythm, (2) pressure scale and pressure per division, (3) recording speed (i.e., paper speed), (4) pressure values across the valve, (5) pressures in all adjacent cardiac chambers ( Table 7-3), (6) the rate and shape of the upslope and downslope of pressure waveforms, and (6) recording artifacts. Both technical and physiologic factors can affect the measured pressure gradients (see Table 7-2). The third physiologic issue that may affect the measured transvalvular gradient is the phenomenon of pressure recovery that occurs distal to a site of stenosis. Pressure recovery is especially important with AS.38–40 As the high-velocity jet flows through the stenotic orifice, it decelerates and expands distal to the valve. The associated turbulence results in an increase in aortic pressure (“pressure recovery”) such that the pressure difference between the left ventricle and the distal ascending aorta is less than the pressure difference between the left ventricle and the stenotic orifice itself. Although pressure recovery may account for some of the observed discrepancies between Doppler and catheter-based data and conceivably could lead to underestimation of stenosis severity, the magnitude of this effect in the clinical setting appears to be small (approximately 5-10 mm Hg) and is unlikely to affect clinical decision making. Pressure recovery is greatest when stenosis severity is mild and aortic root dimension is small, and is least with severe stenosis and poststenotic dilation. Potential underestimation of stenosis severity due to pressure recovery can be avoided by recording pressures immediately adjacent to the valve on the downstream side of the stenosis. Several other factors may also affect recorded pressure gradients. Transaortic pressure gradient may be affected by the presence of the catheter itself in the stenotic orifice. The catheter may increase the transvalvular pressure gradient either by further decreasing the cross-sectional flow area or by inducing aortic regurgitation. 41 Other physiologic variables that may affect the pressure gradient are the effect of atrial contraction, cardiac arrhythmias, and the compliance of the receiving chamber when regurgitation is present. Irregular heart rhythms affect measured pressure gradients in valvular stenosis because of the varying volume flow rates across the valve, necessitating averaging of several beats for clinical interpretation. All pressures should be measured prior to contrast ventriculography and angiography. A variety of catheters and techniques can be used to the cross the aortic valve in a retrograde manner to measure the pressure gradient. A 0.038-inch standard straight wire in combination with a pigtail catheter, Judkins right, or Amplatz left coronary catheter is commonly used. 42 Occasionally, a catheter specifically designed to cross the aortic valve, called a Feldman catheter, may be required. 43 When the straight wire cannot be passed across the valve, supravalvular angiography may be useful to localize the position and orientation of the valve orifice. The position and movement of calcium within the valve leaflets may also suggest the location of the valve orifice. Although hydrophilic straight wires can also be used to cross the aortic valve, the hydrophilic wire coating may increase the risk for valve leaflet perforation. Probing the aortic valve orifice with the wire should be done in less than 2-minute increments, with the wire removed and the catheter carefully flushed prior to reinsertion and another attempt to cross the valve. Although the risk of retrograde passage of a catheter across a narrowed and diseased aortic valve is small, one study has found that 3% of patients undergoing cardiac catheterization experienced a clinically significant neurologic event and 22% had magnetic resonance imaging evidence of an acute cerebral embolic event. 44 In the setting of severe aortic valve calcification or critical AS, or when coexisting mitral stenosis is present, transseptal puncture should be considered. The pressure gradient between the left ventricle and the aorta can be described by three invasive measurements: (1) the mean gradient, (2) the peak-to-peak gradient, and (3) the maximum gradient ( Figure 7-1). The mean gradient represents the area under the LV-aortic pressure curve and corresponds to the mean gradient measured by echocardiography. The peak-to-peak gradient has no true physiologic meaning and represents the difference between maximum aortic and the maximum LV pressures. Note that these maximum pressures do not occur at the same time and that the peak-to-peak gradient is not the same as the maximum gradient. Although the peak-to-peak gradient is easily measured with computer-assisted software, it is not useful in classifying the severity of AS. The maximum gradient represents the maximum difference that can be measured between the left ventricle and aorta during systole and corresponds to the maximum instantaneous gradient measured by echocardiography. The maximum gradient occurs early during ventricular ejection, before the peak LV pressure. FIGURE 7-1 Transaortic pressure gradient.
Evaluation of Valvular Heart Disease by Cardiac Catheterization and Angiocardiography
 Key Points
 Cardiac catheterization and angiocardiography is useful in patients:
 Who require coronary angiography prior to surgical intervention
 With suboptimal echocardiographic imaging (large body habitus, obesity, chronic lung disease)
 In whom discrepancies exist between the clinical information and findings from echocardiography
 Being considered for transcutaneous aortic valve implantation
 Measurement of the pressure gradient
 Analysis of the pressure waveforms
 Occasionally, angiocardiography of the chamber upstream to the site of stenosis
Basic Principles
Pressure-Volume Loops
Evaluation of Left Ventricular Systolic Function
Angiocardiography


Cardiac Output
Fick Technique
 ) then is calculated from the fractional content of oxygen and flow rates of air entering and exiting the patient mask, assuming a respiratory quotient of 1.0. The paramagnetic method measures both oxygen and carbon dioxide in expired air, allowing calculation of the respiratory quotient for each patient. In recent years, there has been a trend to estimate oxygen consumption with the use of derived equations. 25 However, use of these derived equations is inaccurate, especially in patients with increased body mass index. 26

Thermodilution Method
Evaluation of Stenosis Severity
Measurement of Pressure Gradients
Basic Principles
Physiologic Factors
Aortic Valve
Pressure Gradients
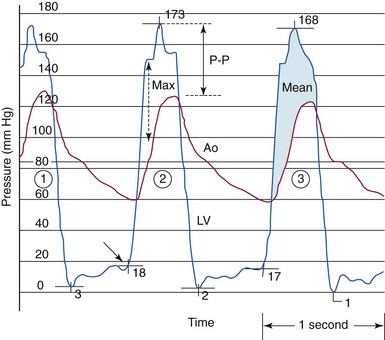
The gradient between the left ventricle (LV) and the aorta (Ao) in aortic stenosis can be described by three invasive measures. The mean gradient (beat #3) represents the area under the left ventricular–aortic pressure curve. The peak-to-peak (P-P) gradient (beat #2) is the difference between the maximum aortic pressure and the maximum left ventricular systolic pressure. The maximum (Max) gradient (beat #2) is the maximum difference that can be measured between the left ventricle and aorta during systole.![]()
Stay updated, free articles. Join our Telegram channel

Full access? Get Clinical Tree


Evaluation of Valvular Heart Disease by Cardiac Catheterization and Angiocardiography


Only gold members can continue reading. Log In or Register to continue
