Evaluation of Systolic and Diastolic Function of the Ventricles and Myocardium
Evaluation of Systolic and Diastolic Function of the Ventricles and Myocardium
William Grossman
Mauro Moscucci
A critical aspect of most cardiac catheterization procedures is the evaluation of myocardial function. At its simplest, this consists of a visual assessment of the left ventricular (LV) contractile pattern from the left ventriculogram, together with measurement of LV end-diastolic pressure. In laboratories where most patients have right-sided heart catheterization and cardiac output measurement as part of the standard cardiac catheterization procedure, additional information about LV function may be gleaned from cardiac output, stroke volume, and pulmonary capillary wedge pressure, whereas right ventricular (RV) function is reflected by the values of right ventricular end-diastolic pressure (RVEDP) and right atrial pressure. Measurement of pressures and cardiac output gives important information about overall cardiac function, but may shed little light on whether dysfunction is caused by abnormal systolic or diastolic myocardial performance. This chapter describes some of the specific methods that can be used in the cardiac catheterization laboratory to examine myocardial performance in systole and diastole.
SYSTOLIC FUNCTION
Preload, Afterload, and Contractility
Systolic function of the myocardium is a reflection of the interaction of myocardial preload, afterload, and contractility. Preload is the load that stretches myofibrils during diastole and determines the end-diastolic sarcomere length. For the left ventricle, this load is often quantified as the LV end-diastolic pressure (LVEDP). This pressure (P), together with LV wall thickness (h) and radius (R), determines LV end-diastolic wallstress (σ ≈ PR/h), which is an estimate of the force stretching the myocardial fibers at end-diastole. The end-diastolic stress or stretching force is resisted by the intrinsic stiffness or elasticity of the myocardium, and the interaction of end-diastolic stretching force and myocardial stiffness determines the extent of end-diastolic sarcomere stretch. If the myocardium is diffusely fibrotic or infiltrated with amyloid, a very high end-diastolic stretching force may be required to produce even a normal end-diastolic sarcomere length. In such a case, LVEDP may be very high (e.g., >25 mmHg), and attempts to lower it by diuretic or venodilator therapy may lead to reduction in end-diastolic sarcomere stretch to subnormal values and a concomitant fall in cardiac output.
Changes in preload influence both the extent and the velocity of myocardial shortening in experiments using isolated cardiac muscle preparations. Increased preload augments the extent and velocity of myocardial shortening at any given afterload. In the intact heart, the relationship is more complex because increases in preload generally produce increases in LV chamber size and LV systolic pressure. Therefore, afterload (the force resisting systolic shortening of the myofibrils) also increases, and this increase tends to blunt the increases in the extent and velocity of myocardial shortening caused by increased diastolic fiber stretch. This point is discussed in more detail later in this chapter, under the section on ejection phase indices of systolic function.
Afterload varies throughout systole as the ventricular systolic pressure rises and blood is ejected from the ventricular chamber. LV systolic stress approximates the force resisting myocardial fiber shortening within the wall of the ventricle. The theory of and methods for calculation of wall stress are described in Chapter 21. End-systolic wall stress is considered by many to be the final afterload that determines the extent of myocardial fiber shortening when preload and contractility are constant. An increase in end-systolic wall stress results in a decrease in myocardial fiber shortening. For the intact ventricle, an increase in afterload (end-systolic wall stress) therefore results in a fall in stroke volume and ejection fraction.
Contractility refers to the property of heart muscle that accounts for alterations in performance induced by biochemical and hormonal changes; it has classically been regarded to be independent of preload and afterload. Contractility is generally used as a synonym for inotropy: both terms refer to the level of activation of cross-bridge cycling during systole. Contractility changes are assessed in the experimental laboratory by measuring myocardial function (extent or speed of shortening, maximum force generation) while preload and afterload are held constant. In contrast to skeletal muscle, the strength of contraction of heart muscle can be increased readily by a variety of biochemical and hormonal stimuli, some of which are listed in Table 22.1.
Table 22.1 Hormones and Drugs That Influence Myocardial Contractility
↑ Extracellular Ca++ →↑Ca++ influx via slow channels and Na+/Ca++ exchange →↑ cytosolic Ca++
+
Caffeine
Multiple actions:
Local release of catecholamines Inhibition of sarcoplasmic reticular Ca++ uptake Inhibition of phosphodiesterase → ↑cyclic AMP ↑ Sensitivity of contractile proteins of Ca++
Increased myocardial contractility may be present in patients with hyperadrenergic states, thyrotoxicosis, or hypertrophic cardiomyopathy or in response to various drugs. It manifests as an increase in the speed and extent of myocardial contraction at constant afterload and preload.
Experiments with isolated myocardial tissue have demonstrated that contractility is not truly independent of preload. Increased end-diastolic sarcomere stretch leads to an immediate increase in the strength of contraction owing to the Frank-Starling mechanism, followed by a gradual further increase in contractile strength over 5 to 10 minutes.2, 3, 4 Evidence supports a role for both increased intracellular calcium (Ca++) release and increased myofilament sensitivity to any given level of cytosolic Ca++ as underlying factors in the length-dependent activation seen with increased preload.3
Assessment of systolic function requires consideration of the simultaneous influence of afterload, preload, and contractility. Systolic function should not be regarded as synonymous with contractility. Major depression of systolic function can occur with normal contractility, as in conditions with the so-called afterload excess (see later discussion).
Isovolumic Indices
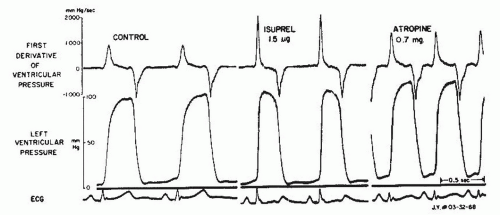
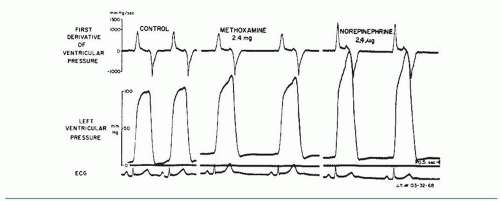
One of the oldest and most widely used measures of myocardial contractility is the maximum rate of rise of LV systolic pressure, dP/dt. Wiggers noted more than 70 years ago that in animal experiments, the failing ventricle showed a reduced steepness of the upslope of the ventricular pressure pulse.5 In 1962, Gleason and Braunwald first reported measurement of dP/dt in humans.6 They studied 40 patients with micro-manometer catheters. Maximum dP/dt in those patients without hemodynamic abnormalities ranged from 841 to 1,696 mmHg/second in the left ventricle and 223 to 296 mmHg/second in the right ventricle. Interventions known to increase myocardial contractility, such as exercise and infusion of norepinephrine or isoproterenol, caused major increases in dP/dt. Increased heart rate produced by intravenous atropine also caused a rise in maximum dP/dt, and the authors attributed this to the treppe phenomenon described by Bowditch and characterized by a gradual increase in contractility following rapid sequential stimulation. This phenomenon, also known as the staircase effect, is felt to be secondary to accumulation of intracellular Na+, leading to a reduction in Na+/Ca++ exchange (3 inward Na+ exchanged for 1 outward Ca++) during the repolarization phase of the action potential and a corresponding increase in cytosolic Ca++. In the study by Gleason and Braunwald, acute increases in arterial pressure and afterload produced by infusion of the α-adrenergic vaso-constricting agent methoxamine produced little change in dP/dt. These points are illustrated in Figures 22.1 and 22.2.
In normal subjects and in patients with no significant cardiac abnormality, maximum dP/dt increases significantly in response to isometric exercise,7 dynamic exercise,6 tachycardia by atrial pacing8,9 or atropine,6 β-agonists,6 and digitalis glycosides.10 Relatively few studies have been done in humans to assess the changes in dP/dt induced by alterations in afterload and preload, but some studies do indicate that maximum positive dP/dt tends to increase slightly (6% to 8%) with moderate increases in LV preload11 and shows little change with methoxamine-induced increases6 or nitroprusside-induced decreases12 in mean arterial pressure of 25 to 30 mmHg. Extensive studies in animals have examined the influence of changes in afterload, preload, and contractility on maximum dP/dt.11,13, 14, 15, 16 These studies generally show that maximum dP/dt rises with increases in afterload and preload, but the changes were quite small (<10%) in the physiologic range.
Figure 22.1 Micromanometer recordings of left ventricular pressure and its first derivative, dP/dt, in a patient with normal left ventricular function. Isoproterenol markedly increases contractility with large increments in positive dP/dt. Atropine produces tachycardia, which results in a treppe effect and a rise in +dP/dt above control. (From Gleason WL, Braunwald E. Studies on the first derivative of the ventricular pressure pulse in man. J Clin Invest 1962;41:80, with permission.)
As discussed in Chapter 10, accurate measurement of dP/dt requires a pressure measurement system with excellent frequency-response characteristics. Micromanometer catheters are usually required to achieve this frequency-response range.17 Differentiation of the ventricular pressure signal can be achieved by (a) analog techniques online (Figures 22.1 and 22.2), using a resistance capacitor (RC) differentiating circuit6,11; (b) computer digitization of the analog LV pressure tracing and subsequent differentiation of a polynomial best fit to the averaged LV isovolumic pressure18; or (c) computer digitization of the analog LV pressure tracing with subsequent Fourier analysis and differentiation.19
In addition to dP/dt, several other isovolumic indices have been introduced in an attempt to obtain a “pure” contractility index, completely independent of alterations in preload and afterload.11,20,21 These indices include the maximum value of (dP/dt)/P, where P is LV pressure [the maximum value of (dP/dt)/P is sometimes called VPM]; (peak dP/dt)/IIT, where IIT is the integrated isovolumic tension; (dP/dt)/CPIP, where CPIP is the common developed iso-volumic pressure; Vmax, the extrapolated value of (dP/dt)/P versus P when P = 0; (dP/dt)/PD when the developed LV pressure, PD, equals 5, 10, or 40 mmHg; and the fractional rate of change of power, which involves the second derivative of LV pressure.
Figure 22.2 Micromanometer recordings of left ventricular (LV) pressure and dP/dt, as in Figure 22.1. Methoxamine raises arterial and LV systolic pressure but does not increase +dP/dt. In contrast, the combined α- and β-adrenergic effects of norepinephrine increase LV systolic pressure and +dP/dt. (From Gleason WL, Braunwald E. Studies on the first derivative of the ventricular pressure pulse in man. J Clin Invest 1962;41:80, with permission.)
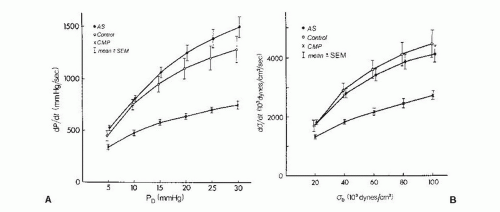
Although changes in dP/dt reflect acute changes in inotropy in a given individual, the usefulness of dP/dt is reduced in comparisons between individuals, especially when there has been chronic LV pressure or volume overload. Peak dP/dt generally increases in patients with chronic aortic stenosis, even though contractility is normal or decreased in most of these patients. To account for chronic changes in LV geometry and mass that occur with chronic LV overload, some investigators have examined the rate of rise of systolic wall stress.18 The peak value of dσ/dt may be used as a contractility index, as may the spectrum plot that relates dσ/dt to instantaneous σ (Figure 22.3).
Pressure-Volume Analysis
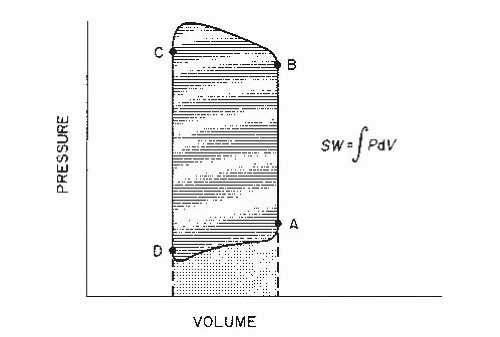
Since the time of Frank and Starling, pressure-volume (PV) diagrams have been used to analyze ventricular function. The normally contracting left ventricle ejects blood under pressure, and the relationship between its pressure generation and ejection can be expressed in a plot of LV pressure against volume. As can be seen in Figure 22.4, end-diastole is represented by point A, isovolumic contraction by line AB, aortic valve opening by point B, ejection by line BC, end-ejection and aortic valve closure by point C, isovolumic relaxation by line CD, mitral valve opening by point D, and LV diastolic filling by line DA.
Stroke Work
The area ABCD enclosed within the PV diagram in Figure 22.4 is the external LV stroke work (SW), represented mathematically as ∫PDV. Although the calculation of LVSW is most accurate when it is derived by integrating the area within complete PV diagrams, a practical approximation can be obtained as follows:
where and are, respectively, the mean LV systolic and diastolic pressures (in mmHg), SV is the LV total stroke volume (in mL), and 0.0136 is a constant for converting mmHg-mL into g-m. and may be obtained from planimetry of direct pressure tracings, as shown in Figure 22.5. When the total LV stroke volume is the same as the forward stroke volume, SV may be calculated as cardiac output divided by heart rate. In cases where LV total stroke volume differs from forward stroke volume (e.g., mitral or aortic regurgitation, ventricular septal defect), the P-V diagram may differ substantially in configuration from that shown in Figure 22.4, and LVSW cannot be calculated from Eq. (22.1); instead, planimetric integration of the entire P-V plot is required.
If LV pressure tracings are not available, in the absence of major regurgitation, SW can be approximated from the aortic and pulmonary capillary wedge pressures as follows:
where is the aortic systolic mean pressure (planime-tered from the aortic pressure tracing, Figure 22.5) and is the mean pulmonary capillary wedge pressure. A further approximation may be made by substituting mean systemic arterial pressure for , which it closely approximates.
Figure 22.3 Left ventricular (LV) isovolumic indices of contractility. A. Rate of pressure development (dP/dt) as a function of LV-developed pressure (PD). Mean values in control subjects (open circles), patients with aortic stenosis (AS, filled circles), and patients with dilated cardiomyopathy (CMP, crosses) are shown. Brackets represent standard errors of the mean (SEM). B. Rate of wall stress development (dσ/dt) as a function of LV-developed stress (σD) for the same groups. There are no significant differences for patients with AS as compared with controls, although patients with CMP clearly show depressed values for dP/dt and dσ/dt at all levels of PD and σD. (From Fifer MA, Gunther S, Grossman W, et al. Myocardial contractile function in aortic stenosis as determined from the rate of stress development during isovolumic systole. Am J Cardiol 1979;44:1318, with permission.)
Figure 22.4 Diagram of ventricular pressure (P) plotted against simultaneous ventricular volume (V) for a single cardiac contraction. For the left ventricle, point A represents end-diastole; segment AB, isovolumic contraction; point B, aortic valve opening; segment BC, LV ejection; point C, aortic valve closure and end ejection; segment CD, isovolumic relaxation; point D, mitral valve opening; and segment DA, LV filling. LV stroke work (SW) is represented by the cross-hatched area, and the stippled area represents diastolic work done on the left ventricle by the right ventricle and left atrium. (See text for details.)
LVSW is a reasonably good measure of LV systolic function in the absence of volume or pressure overload conditions, both of which may substantially increase calculated LVSW. The normal LVSW in adults is approximately 90 ± 30 g-m (mean ± SD); in adult patients with dilated cardiomyopathy or heart failure from extensive prior myocardial infarction, LVSW is often <40 g-m. Values, <25 g-m indicate severe LV systolic failure, and when LVSW is <20 g-m, the prognosis is grave.
LVSW is a measure of total LV chamber function and can be considered to reflect myocardial contractility only when the ventricle is reasonably homogeneous in its composition, as in most patients with dilated cardiomyopathy. For patients with coronary artery disease and extensive myocardial infarction, LVSW may be depressed even though well-perfused areas of the myocardium with normal contractility remain.
Because power is the rate at which work is done, LV power in the normal heart is the integral of the product of LV pressure during ejection and aortic flow. LV power may be regarded as a measure of overall LV contractile function; with refinement (such as the measurement of preload-adjusted maximal power), it can be used as a measure of the inotropic state.22
Ejection Phase Indices
LV systolic function can be assessed using only the volume data from the P-V diagram. One of the most widely used indices of LV systolic performance is the ejection fraction (EF), which is defined as follows:
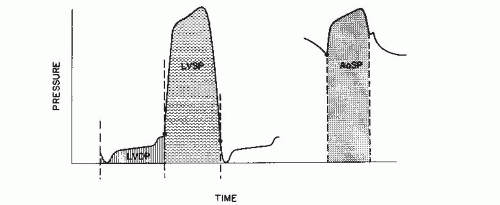
Figure 22.5 Left ventricular (LV) and aortic (Ao) pressure tracings illustrate areas planimetered to measure LV mean systolic pressure (LVSP), LV mean diastolic pressure (LVDP), and aortic mean systolic pressure (AoSP). LVSP is the area contained under the LV pressure curve, bounded by perpendicular lines defining end-diastole and mitral valve opening; LVDP is the diastolic area, similarly defined. AoSP is the area contained under the aortic pressure curve, bounded by perpendicular lines defining aortic valve opening and closure.
where LVEDV and LVESV are the LV end-diastolic and end-systolic volumes, respectively. In the cardiac catheterization laboratory, left ventricular EF (LVEF) is most often derived from the LV angiogram, as discussed in Chapter 21. If the EF is divided by the ejection time (ET), measured from the aortic pressure tracing, the quotient is called mean normalizedsystolic ejection rate (MNSER).
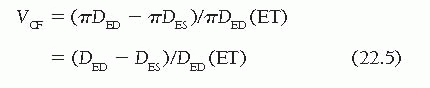
Finally, another ejection phase index of LV systolic function is the velocity of circumferential fiber shortening, VCF.23 This is calculated as the rate of shortening of a theoretic LV myocardial fiber in a circumferential plane at the midpoint of the long axis of the ventricle. For convenience, mean VCF is used most often, rather than instantaneous or peak VCF. Mean VCF is obtained by subtracting the end-systolic endocardial circumferential fiber length (πDES) from the end-diastolic endocardial circumferential fiber length (πDED), and then dividing by ET and normalizing for end-diastolic circumferential fiber length:
DED and DES are end-diastolic and end-systolic minor axis dimensions. Although VCF can be calculated from angiographic data using the area-length method (D = 4 A/πL), it is most commonly calculated from the values of D measured by M-mode echocardiography. Normal values for isovolumic and ejection phase indices are given in Table 22.2.
Ejection phase indices are easily obtained from LV angiogram and can also be derived reliably from a variety of noninvasive techniques such as radionuclide ventriculography and echocardiography. The most widely used ejection phase index, the EF, is generally depressed when myocardial contractility is diminished. However, the ejection indices depend heavily on preload and afterload and cannot be regarded as reliable indices of contractility in conditions associated with altered loading conditions. For example, increases in preload cause the EF (and other ejection indices) to rise; consequently, LVEF may be increased in patients with mitral or aortic regurgitation, severe anemia, or other causes of increased diastolic LV inflow and may mask underlying deterioration of myocardial contractility. Conversely, increases in afterload cause the EF to fall; consequently, LVEF may be low in patients with severe aortic stenosis or other causes of increased resistance to systolic ejection and may falsely suggest underlying depression of myocardial contractility.
In practice, acute elevation of LV preload causes some increase in LV chamber size and aortic pressure, and these increases in afterload (systolic σ resisting shortening) tend to decrease the EF and other ejection indices, offsetting the rise in EF that a pure rise in preload would produce. Rankin and coworkers29 produced changes in venous return by total body tilt in normal subjects; despite substantial changes in LV end-diastolic dimension and volume, there were no signi ficant changes in EF, MNSER, or VCF. Similarly, acute elevation of afterload caused by rising aortic pressure causes an increase in LVEDP, and the resultant rise in preload (end-diastolic fiber stretch) tends to increase the EF and other ejection indices, offsetting the fall in EF produced by a pure rise in afterload.26 These physiologic adjustments explain why the ejection indices are much more useful clinically than might be expected on the basis of studies in the isolated heart or muscle preparation.
Table 22.2 Evaluation of Left Ventricular Systolic Performance: Normal Values of Some Isovolumic and Ejection Phase Indices
Contractility Indices
Normal Values (mean ± SD)
References
Isovolumic indices
Maximum dP/dt
1,610 ± 290 mmHg/s
8
1,670 ± 320 mmHg/s
24
1,661 ± 323 mmHg/s
20
Maximum (dP/dt)/P
44 ± 8.4 s−1
20
VPM or peak
1.47 ± 0.19 ML/s
24
(dP/dt)/PD at PD = 40 mmHg
37.6 ± 12.2 s-1
20
Ejection phase indices
LVSW
81 ± 23 g-m
7
LVSWI
53 ± 22 g-m/m2
25, 26
41 ± 12 g-m/m2
27
EF (Angiographic)
0.72 ± 0.08
28
MNSER
Angiographic
3.32 ± 0.84 EDV/s
20
Echographic
2.29 ± 0.30 EDV/s
29
Mean VCF
Angiographic
1.83 ± 0.56 ED circ/s
20
1.50 ± 0.27 ED circ/s
23
Echographic
1.09 ± 0.12 ED circ/s
29
dP/dt, rate of rise of left ventricular (LV) pressure; PD, developed LV pressure; ML, muscle length; LVSW, left ventricular stroke work; LVSWI, left ventricular stroke work index; MNSER, mean normalized systolic ejection rate; ED, end-diastolic; V, volume; VCF, velocity of circumferential fiber shortening; circ, circumference; EF, ejection fraction.
An LVEF of <0.40 indicates depressed LV systolic pump function, and if there is no abnormal loading to account for it, an LVEF of ≥0.40 can be taken to signify depressed myocardial contractility. An LVEF <0.20 corresponds to severe depression of LV systolic performance and is usually associated with a poor prognosis. Interpretation of EF and other ejection indices improves by consideration of the ventricular preload and afterload, and the latter values are defined most precisely by end-diastolic and end-systolic wall stresses, respectively.
End-Systolic Pressure-Volume and σ-Length Relations
Over the past 40 years, several groups have shown that the LV end-systolic P-V, pressure-diameter, and σ-length relation-ships accurately reflect myocardial contractility, independent of changes in ventricular loading. This has been established in a series of studies in animals30, 31, 32, 33, 34, 35, 36 and humans.37, 38, 39, 40, 41, 42, 43 The fundamental principle of end-systolic P-V analysis is that at end-systole there is a single line relating LV chamber pressure to volume, unique for the level of contractility and independent of loading conditions. The LV end-systolic P-V line can be generated by producing a series of P-V loops (such as the one in Figure 22.4) over a range of loading conditions (Figures 22.6 and 22.7). The line connecting the upper left corners of the individual P-V diagrams is the end-systolic P-V line (Figure 22.7A), characterized by a slope and by an x-axis intercept called V0 (the extrapolated end-systolic volume when end-systolic pressure is zero). Current evidence indicates that an increase in contractility shifts the end-systolic P-V line to the left with a steeper slope, and a depression in contractility is associated with a displacement of the line downward and to the right, with a reduced slope. Although there is some uncertainty as to the meaning of V0, it is generally agreed that an increase in slope of the end-systolic P-V line is a sensitive indicator of an increase in contractility. However, the technique of end-systolic analysis may not be as useful in comparisons among subjects as it is in comparisons of values in a single subject measured before and after an intervention. The end-systolic P-V lines for groups of patients with normal, intermediate, and depressed LV contractility are shown in Figure 22.8.
Only gold members can continue reading. Log In or Register to continue
 and
and  are, respectively, the mean LV systolic and diastolic pressures (in mmHg), SV is the LV total stroke volume (in mL), and 0.0136 is a constant for converting mmHg-mL into g-m.
  and
and  may be obtained from planimetry of direct pressure tracings, as shown in Figure 22.5. When the total LV stroke volume is the same as the forward stroke volume, SV may be calculated as cardiac output divided by heart rate. In cases where LV total stroke volume differs from forward stroke volume (e.g., mitral or aortic regurgitation, ventricular septal defect), the P-V diagram may differ substantially in configuration from that shown in Figure 22.4, and LVSW cannot be calculated from Eq. (22.1); instead, planimetric integration of the entire P-V plot is required.
 is the aortic systolic mean pressure (planime-tered from the aortic pressure tracing, Figure 22.5) and
  is the mean pulmonary capillary wedge pressure. A further
  , which it closely approximates.