Lower extremity peripheral arterial disease (PAD) affects 8 million people in the United States, with a prevalence of 29% (1), and is part of a spectrum of atherosclerotic disease that includes coronary and carotid artery disease. Epidemiologic studies have objectively defined the presence of PAD by an ankle–brachial index (ABI) of less than 0.9 (2). The ABI is calculated by the ratio of Doppler-recorded systolic blood pressure in the lower and upper extremities. Normally, systolic blood pressures are 10% to 15% higher at the ankle than at the arm. However, with obstructive disease in the arteries of the lower extremities, systolic blood pressure in the leg and therefore the ABI declines.
Patients may manifest PAD differently. However, in general, 10% of patients have classic symptoms of claudication, 50% have atypical symptoms other than classic claudication, and 40% are asymptomatic (1,3). In its most severe form, PAD may present as critical limb ischemia (CLI) defined by the presence of rest pain, ulceration, or frank gangrene.
PAD is not a local disease; it is a marker of overall cardiovascular health (4). Data from the Strong Heart Study and Cardiovascular Health Strategies demonstrate that the presence of PAD confers a two- to threefold increase in the risk of total mortality and cardiovascular mortality independent of any other risk factors (5). Therefore, it is important to identify asymptomatic patients in order to implement global cardiovascular risk reduction strategies. Additionally, patients may be asymptomatic because they have limited their physical activity.
Interestingly, data from epidemiologic studies of PAD also shows that patients with an ABI> 1.4 also have increased total and cardiovascular mortality (5). An ABI > 1.4 is generally indicative of noncompressible vessels due to medial calcification often found in patients with diabetes or end-stage renal disease requiring dialysis. Although these values were thought to have little diagnostic value, epidemiologic studies indicate that an ABI > 1.4 can be used to identify patients at increased risk of death (6).
Based on the large percentage of patients who are asymptomatic or have atypical symptoms, self-reported questionnaires are clearly unreliable for screening for PAD as they are only a subjective measurement. Additionally, not all patients who complain of pain in the lower extremities with ambulation have peripheral vascular disease, as this pain may be due to other neurologic or orthopedic etiologies. Noninvasive studies performed in the vascular laboratory allow for an objective assessment of PAD.
There are a variety of options available in the vascular laboratory for the hemodynamic assessment of PAD. Each test provides unique and complementary information. The tests are noninvasive, allow the clinician to confirm the presence of PAD, and, if present, determine the location and severity of the disease.
ARTERIAL HEMODYNAMIC NONINVASIVE STUDIES
Ankle–Branchial Index
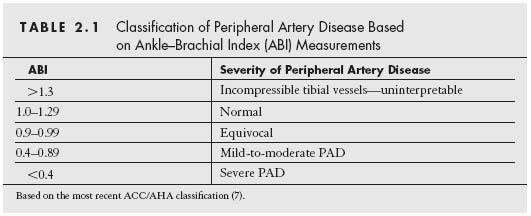
The ABI is the ratio of the systolic pressure measured in the dorsalis pedis (DP) artery or the posterior tibial (PT) artery at the ankle with the cuff inflated just above the malleolus to the systolic pressure measured in the brachial artery. It is customary to use the highest pressure between the DP and PT when calculating the ABI. Additionally, in cases where the brachial pressures are different due to subclavian stenosis, it is important to use the highest brachial artery pressure in the calculation of the ABI, since this most accurately reflects the true intra-aortic pressure. The current ACC/AHA guidelines relating the severity of PAD with the ABI measurement are shown in Table 2.1 (7).
Multilevel disease can sometimes be challenging to interpret. If one segment such as the superficial femoral artery (SFA) is completely occluded, the magnitude of the pressure change distal to the occlusion will be determined by the resistance of the outflow vessels and the adequacy of collateral flow. In general, a single segment occlusion will result in a fall of the ankle pressure by one half resulting in an ABI of 0.5. However, if more than one level is occluded, the resistance of the outflow bed is additive and the fall in ankle pressure will be greater (8).
In cases of calcified arteries that are noncompressible, the ABI is often greater than 1.4 and does not provide an indication of the severity of the disease. In these cases, it is important to measure toe pressures using plethysmography (see segmental limb pressures below), as the digital vessels are typically spared of calcification (8,9).
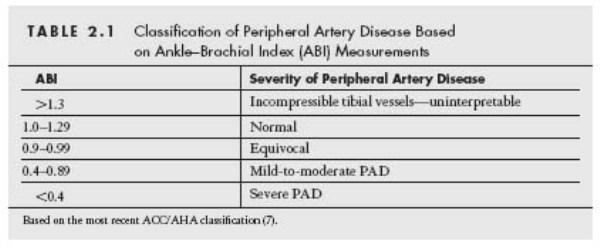
The ABI can be used to assess the degree of success of interventions as well as follow the patient for evidence of restenosis. An improvement in the ABI greater than 0.15 is typically considered significant. Less than that typically does not represent a significant improvement due to inter- and intraobserver variability in obtaining the ABI (10). Similarly, a decrease of greater than 0.15 indicates the possibility of restenosis or progression of disease (11). As demonstrated in Figure 2.1, if all obstructions have been completely treated, the ABI should approach or exceed 1.0. However, if sites of obstruction still exist after the intervention, the ABI increases, but not to normal levels (12).
Segmental Pressures and Toe Pressures
Segmental arterial pressures can be obtained at several levels—brachial, high thigh, low thigh, below knee, and ankle (Fig. 2.2). This is referred to as the four-cuff method and provides the greatest amount of information. The blood pressure cuff is inflated until arterial flow is stopped and the Doppler signal is no longer audible. The cuff is slowly deflated until the first appearance of a systolic wave. This pressure is recorded. It is important to remember that it is the location of the cuff that determines the level of measurement, not the probe. Some vascular laboratories have modified the four-cuff method to a two-cuff method. They use low thigh and ankle cuffs and have eliminated the high thigh and upper calf cuffs. The Doppler waveforms, discussed in more detail below, are then used to determine the presence of aortoiliac, SFA, and popliteal disease.
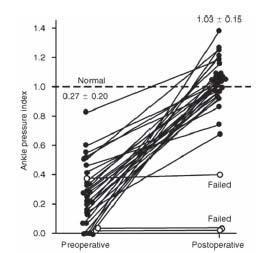
Figure 2.1 • Ankle–brachial index as measured before and after femorotibial and femoropopliteal surgical revascularization in 31 patients. Open circles indicate grafts that failed. (Reproduced with permission from Sumner DS, Strandness DE Jr. Hemodynamic studies before and after extended by pass grafts to the tibial and peroneal arteries. Surgery. 1979;86:442.)
Segmental pressures give the clinician information on the location as well as severity of the disease. Normally one would expect similar pressure measurements at the same level in both limbs as well as between levels in the same limb. A pressure gradient of > 20mmHg between adjacent cuff measurements is regarded as indicative of significant PAD in the intervening arterial segment (13). A difference of 30 mm Hg or more between levels in one limb suggests the presence of an occlusion (8). A difference of 40 mm Hg or more between similar levels of opposite limbs also suggests the presence of an occlusion (14).
A significant drop in arterial pressure between sequential cuffs signifies the presence of disease above the level of the lower cuff (Table 2.2). For example, a drop in pressure between the arm and high thigh cuffs suggests disease in the aortoiliac and/or common femoral arteries. It is important to be aware that the high thigh systolic pressure normally exceeds the brachial systolic pressure by 20% to 30%. Thus, the normal high thigh/brachial ratio is 1.2:1.3. Stenosis and occlusion of an arterial segment proximal to the high thigh cuff is typically associated with a high thigh/brachial ratio of 0.8–1.2 and 0.8, respectively (15,16). The low thigh cuff will detect disease in the SFA. The below-knee cuff will detect disease in the popliteal artery. The ankle cuff will detect disease in the tibial and peroneal vessels. For example, Figure 2.3 demonstrates segmental pressures and waveforms from a patient with isolated left SFA disease. The femoral waveform is triphasic indicating that there is no significant stenosis in the aortoiliac segment. The popliteal waveform, however, is biphasic. There is a 45-mm Hg pressure gradient between the left brachial and the left distal thigh cuff. Additionally, there is a 55-mm Hg pressure gradient between the right and left low thigh cuffs. Combining this information, this study suggests that the patient has isolated left SFA disease.
Toe pressure measurement is an important component of the segmental pressure measurements. Pressures are obtained using a small pneumatic cuff around the first or second toe. Toe pressures are particularly important when the ABI is invalid due to calcified tibial vessels as is often the case in patients with diabetes and/or renal insufficiency, since the digital vessels are typically spared of significant calcification. Toe pressures are not different between diabetic and nondiabetic patients, and therefore are a useful indicator of the overall degree of disease. In patients with claudication, toe pressures average about 60 to 70 mm Hg. In patients with rest pain and ulceration, the toe pressures are usually less than 30 mm Hg (17). In addition, the toe pressure can give the clinician important information as to the likelihood of an ischemic ulceration healing without surgical intervention. Some authors have found a difference between toe pressures required for healing in nondiabetic versus diabetic patients. Foot lesions usually heal if toe pressures exceed 30 mm Hg in nondiabetic patients and 55 mm Hg in diabetic patients (18). Other studies, however, have not found a difference and found that greater than 90% of lesions will heal when toe pressures are greater than 30 in both diabetics and nondiabetics (9,19).
Figure 2.2 • A: Demonstrates the placement of the cuffs on the lower extremity in the four-cuff study in the high-thigh, low-thigh, below-knee, and ankle positions.B: Demonstrates the placement of the cuffs in the two-cuff study in the low thigh and ankle positions.C: Demonstrates photoplethysmography to obtain toe pressures.
The ratio of the toe pressure to brachial pressure is referred to as the toe–brachial index (TBI). The normal TBI is 0.8 to 0.9. In patients with claudication and ischemic rest pain, the TBI is typically 0.2 to 0.5 and 0 to 0.2, respectively.
Doppler Waveforms
The Doppler waveform provides additional information to segmental pressures and ABIs, especially in cases where the vessels are not compressible. A pencil-type 5 to 8 MHz Doppler probe is generally used, and measurements are taken with the probe at an angle of 45 to 60 degrees to the artery. Both an audible interpretation as well as qualitative interpretation of the waveform is obtained. The audible interpretation consists of three distinct sounds in a normal patient. The first sound is the high velocity systolic component, followed by the smaller reverse-flow component in diastole, and finally a smaller, lower velocity component heard during late diastole. Distal to a stenosis, the flow signals are low pitched and monophasic. The audible interpretation is highly subjective and, therefore, limited. Much more useful is the qualitative analysis of the waveform.
The waveforms reflect the resistance pattern of the outflow vascular bed. The flow characteristics provide the “signature” triphasic signal. A normal triphasic signal will have three components. The first is a large forward-flow velocity peak that occurs with systole (Fig. 2.4). This is followed by a brief period of flow reversal in early diastole, and lastly by a final period of low-frequency forward flow that is late diastole.
Stay updated, free articles. Join our Telegram channel

Full access? Get Clinical Tree


