Abnormal traction and excursion of the papillary muscle (PM) can be observed in patients with mitral valve prolapse (MVP) and can adversely affect the electrophysiologic stability of the underlying myocardium. Cardiovascular magnetic resonance (CMR) techniques can directly measure the excursion and velocity of PM tips during ventricular systole. In addition, high-resolution late gadolinium enhancement (LGE) CMR imaging allows for visualization of the underlying potentially arrhythmogenic PM fibrosis substrate. We prospectively studied 16 patients with MVP and 9 healthy adult subjects using phase-contrast CMR and cine CMR to assess the PM velocity and excursion. LGE CMR was performed in 13 patients with MVP (81%). The peak PM systolic velocity and maximum PM excursion were significantly increased in those with MVP (12 ± 5 vs 5 ± 2 cm/s and 15 ± 5 vs 2 ± 3 mm, both p <0.001). Definite PM LGE was found in 6 patients (46%) but the finding did not correlate with PM velocity or excursion. In conclusion, functional CMR imaging demonstrated increased peak PM systolic velocity and excursion distance in patients with MVP. These parameters, however, did not relate to underlying PM fibrosis.
Phase-contrast velocity imaging is a cardiovascular magnetic resonance (CMR) technique commonly used to measure blood flow within the cardiovascular system. In addition to blood flow, phase-contrast CMR imaging has been used to measure myocardial motion throughout the cardiac cycle, with high temporal and spatial resolution. Unlike tissue Doppler imaging in echocardiography, no angle dependence is present with phase-contrast CMR methods. We sought to use 3-directional, 2-dimensional phase-contrast CMR imaging, in addition to cine CMR imaging, to assess the motion of the papillary muscle (PM) in otherwise healthy subjects with mitral valve prolapse (MVP) and in a group of healthy controls. In addition, we sought to examine the relation of PM motion and PM fibrosis.
Methods
A total of 19 adult patients with MVP and no history of coronary artery disease and 12 healthy (no history of hypertension, diabetes, or coronary artery disease and not taking any cardiac medications), age- and gender-matched subjects were studied. Of the 31 subjects, 3 from each group were excluded from the analysis because of poor CMR image quality (either the PM was not adequately visible or severe motion artifacts were present). Our final cohort consisted of 16 subjects with MVP (age 50 ± 14 years, 10 men) and 9 healthy controls (age 47 ± 13 years, 6 men). Of the 16 subjects with MVP, 13 (81%) underwent late gadolinium enhancement (LGE) CMR imaging (1 patient refused contrast injection and 2 were not injected because of a minimally elevated creatinine level). Four healthy control subjects returned 6 months later for a second study to evaluate the test–retest variability using the same imaging protocol. Our institutional review board approved the study, and all subjects provided written consent.
CMR imaging was performed on a 1.5 T Philips Achieva magnetic resonance scanner (Philips Health Care, Best, The Netherlands), using either a 5-channel phased-array coil or a 32-channel cardiac array coil (Invivo, Gainesville, Florida), for which an electronic signal combiner was used to form a 16-channel signal (8 anterior and 8 posterior) from the 32-channel coil array. Left ventricular (LV) function and aortic flow were evaluated in each subject by acquiring breath-hold cine, short-axis, steady-state free precession slices covering the entire left ventricle and a free-breathing phase-contrast velocity map in the ascending aorta, as previously described.
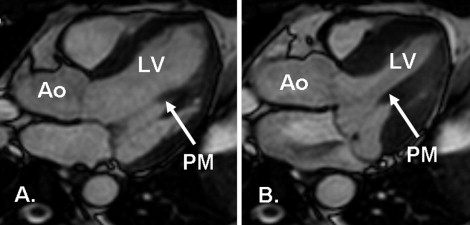
A single 2-dimensional slice was chosen from the stack of breath-hold, cine, steady-state free precession images of the LV outflow tract, as previously described, to capture the inferomedial PM during the entire systole ( Figure 1 ). A stack of 3 free-breathing cine steady-state free precession images was acquired at this slice level to determine the visibility of the PM during free breathing. Subsequently, a free-breathing 2-dimensional phase-contrast CMR sequence with sensitivity to motion in all 3 directions was acquired. The imaging parameters were as follows: repetition time/echo time/flip angle 6.8 ms/4.5 ms/15°, field-of-view 330 × 309 mm 2 , slice thickness 8 mm, voxel size 1.8 × 1.8 × 8 mm 3 , temporal resolution 27 to 44 ms, and maximum velocity encoding 30 cm/s with 3 signal averages. Typical image acquisition time was 5 to 8 minutes.
LGE images were acquired using a high-resolution 3-dimensional electrocardiographic-gated free breathing, respiratory navigator-gated inversion recovery spoiled gradient echo sequence in the short-axis orientation 20 minutes after intravenous administration of 0.2 mmol/kg gadolinium-diethylenetriamine penta-acetic acid (Magnevist, Berlex/Schering AG, Berlin, Germany), as previously described. The imaging parameters were as follows: repetition time/echo time/flip angle 5.6 ms/2.7 ms/25°, field-of-view 320 × 320 mm 2 , 23 to 32 partition-encoded lines, and spatial resolution 1.3 × 1.3 × 5 mm 3 , reconstructed to 0.6 × 0.6 × 2.5 mm 3 . Owing to the nonisotropic resolution of the images, the same sequence was acquired along the 4-chamber orientation immediately after the short-axis LGE acquisition to confirm its findings. The typical image acquisition time was 6 to 10 minutes for both sequences.
The volumetric and aortic flow data were analyzed on a ViewForum workstation, release 4.0 (Philips Health Care, Best, The Netherlands), using the modified Simpson method. End-diastole/onset of systole was determined by the first phase of the cine CMR image after the electrocardiographic trigger. The end of systole was determined by aortic valve closure as demonstrated on the LV outflow view or the cessation of forward blood flow in the aortic flow curves, whichever was earlier. The prolapse distance was measured as the maximum prolapsed distance during peak systole beyond the mitral annulus, as previously described. The mitral regurgitation volume was determined by the LV stroke volume subtracted by the aortic flow volume. The mitral regurgitation fraction was calculated as the mitral regurgitation volume divided by the LV stroke volume. Using the mitral regurgitation fraction, 5 categories of mitral regurgitation were determined: none (<5%), mild (5% to 16%), moderate (16% to 25%), moderate to severe (25% to 48%), and severe (>48%).
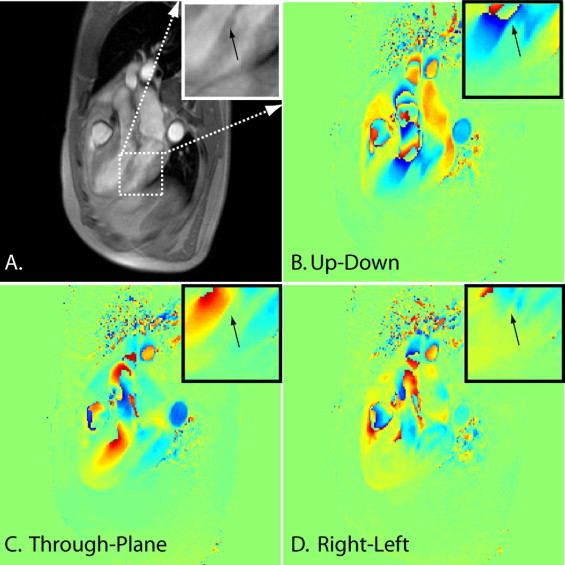
PM phase-contrast CMR images were analyzed using MATLAB (The MathWorks, Natick, Massachusetts). A region of interest on the tip of the PM was drawn on the magnitude image ( Figure 2 ) for each cardiac phase, and its location was copied onto all 3 velocity maps for each cardiac phase ( Figure 2 ). Three directions of motion were measured in the inferomedial PM, with a predominant motion in the up–down orientation on the imaging slice orientation. Only systolic motion was analyzed because the stretch on the PM occurs during systole, and blood flow contamination was prominent during diastole.
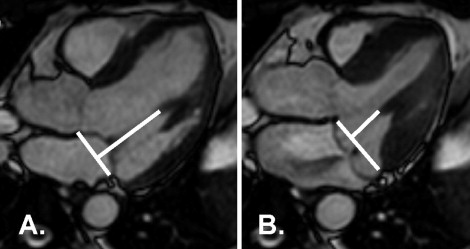
The PM tip to mitral annular distance was measured at the beginning of systole and again at peak systole with maximum prolapse ( Figure 3 ), as previously described for transthoracic echocardiography. The difference was the PM excursion distance. The LV length (from the tip of the apex to the mitral annulus) in the LV outflow view was also measured.
The presence or absence of LGE was assessed by 2 independent experienced reviewers who were unaware of the patient information. The presence or absence of LGE was rated as no PM fibrosis (score 1), possible PM fibrosis (chordal enhancement at the insertion point into the PM present and unclear whether it was entirely chordal or included PM involvement; score 2), and definite PM fibrosis (score 3). After independent reviews, the 2 raters also performed a consensus review together.
The data are presented as the mean ± SD. The data were analyzed using the 2-tailed Student t test to compare continuous variables and the Wilcoxon rank sum test to compare categorical variables. A p value of <0.05 was considered significant. Univariate analysis was performed on the volumetric variables, with PM velocity and PM excursion as the outcome variables. All statistical analyses were performed using Stata, version 10 (StataCorp, College Station, Texas).
Results
By design, those with MVP and the healthy control subjects had similar age, gender proportions, and body surface area ( Table 1 ). Those with MVP had greater LV volumes but a similar LV ejection fraction. The indexed LV mass was significantly greater in the subjects with MVP, as were the mitral regurgitation volume and fraction.
| Variable | MVP (n = 16) | Control (n = 9) | p Value |
|---|---|---|---|
| Age (years) | 50 ± 14 | 47 ± 13 | 0.61 |
| Men | 10 (63%) | 6 (66%) | 0.84 |
| Body surface area (m 2 ) | 1.8 ± 0.2 | 1.8 ± 0.1 | 0.95 |
| Left ventricular end-diastolic volume (ml) | 192 ± 53 | 138 ± 22 | 0.002 |
| Left ventricular end-diastolic volume index (ml/m 2 ) | 103 ± 22 | 75 ± 7 | <0.001 |
| Left ventricular end-systolic volume (ml) | 78 ± 27 | 54 ± 9 | 0.003 |
| Left ventricular stroke volume (ml) | 114 ± 42 | 85 ± 15 | 0.02 |
| Left ventricular ejection fraction (%) | 64 ± 5 | 61 ± 3 | 0.14 |
| Left ventricular mass (g) | 116 ± 39 | 91 ± 24 | 0.05 |
| Left ventricular mass index (g/m 2 ) | 62 ± 17 | 49 ± 11 | 0.03 |
| Left ventricular end-diastolic volume (ml) | 151 ± 35 | 147 ± 31 | 0.78 |
| Aortic flow (ml) | 77 ± 11 | 81 ± 14 | 0.516 |
| Mitral regurgitation volume (ml) | 45 ± 29 | 4 ± 6 | <0.001 |
| Posterior leaflet prolapsed distance (mm) | 6 ± 3 | 0 | <0.001 |
| Anterior leaflet prolapsed distance (mm) | 3 ± 3 | 0 | 0.005 |
| Mitral regurgitation fraction (%) | 34 ± 14 | 5 ± 6 | <0.001 |
| Median mitral regurgitation category (interquartile range) | 3 (2–3) | 0 (0–1) | <0.001 |
Stay updated, free articles. Join our Telegram channel

Full access? Get Clinical Tree


