Recently, coronary computed tomographic angiography (CCTA) was introduced as a tool for the early detection of coronary atherosclerosis. However, a disagreement exists regarding the accuracy of CCTA for the prediction of future cardiovascular risk compared to conventional clinical risks scores (e.g., Framingham and Systematic Coronary Risk Evaluation [SCORE] scores). The aim of the present study was to compare these 2 methods in asymptomatic Israeli subjects. CCTA was performed in 190 asymptomatic patients with ≥1 atherogenic risk factor as the primary screening tool for the presence of cardiovascular disease. The calcium score (CS) was measured in these subjects as a part of CCTA. In addition, the Framingham and SCORE scores were calculated, and statistical analysis using regression models was performed. The study included 190 subjects (84% men). The mean age was 55 ± 9.7 years. A significant correlation with the CS and plaque severity detected by CCTA was found when comparing the risk factors calculated by the SCORE and Framingham scores. A SCORE calculation of >2 versus <2 was related to a greater incidence of a CS >100 (42.9% vs 21.9; odds ratio [OR] 2.68, p = 0.001). When comparing high-risk (>4) and low-risk (<4) SCORE scores, the risk of atherosclerosis per CCTA was 50% versus 27.1% respectively (OR 2.7, p = 0.001). A high-risk Framingham (>20) versus low-risk Framingham (<20) score was related to a greater incidence of CS >100 (53.3% vs 28.6%; OR 3.18, p = 0.001). A high-risk versus low-risk SCORE score was related to greater plaque severity (79.2% vs 59.4%, respectively; OR 2.6, p = 0.001). A high-risk versus low-risk Framingham score was also related to greater plaque severity (93.3% vs 59%, respectively; OR 3.18, p = 0.001). The variables best predicting the severity of artery stenosis were age, gender, diabetes, and hypertension. In conclusion, the results of the present study indicate that the results of the Framingham and SCORE scores compared to those obtained using CCTA are good predictors of coronary artery disease. The use of these clinical scores seems important in identifying patients at risk of coronary atherosclerosis and treating them properly before the development of symptoms and also to help prevent the use of unnecessary invasive procedures.
Recently, coronary computed tomographic angiography (CCTA) was introduced as a tool for evaluation of coronary atherosclerosis and the prediction of cardiovascular morbidity. However, compared to the scores obtained using the Framingham and Systematic Coronary Risk Evaluation (SCORE) surveys, a certain disagreement exists regarding the accuracy of CCTA for the prediction of cardiovascular risk. According to some studies, CCTA and calculation of the calcium score (CS) in the coronary arteries does not add information to the conventional risk scores and thus is not cost effective. Furthermore, the integration of the CS and the Framingham score was found to provide more accurate evaluation of the risk of cardiovascular events.
However, other studies have suggested that the use of CT is more effective in identifying atherosclerotic plaques with a rich lipid core that are more prone to rupture, and, therefore, this approach would be of better predictive value for cardiovascular events. Because metabolic differences exists between the American and European populations and no updated data are available about the predictive ability of risk scores, such as the Framingham and SCORE, compared to CCTA in the Israeli population, it is essential to validate the scores in Israeli subjects. Because of the major importance of the prevention of cardiovascular morbidity and mortality, especially in a population predisposed to cardiovascular events, such as subjects with diabetes or the metabolic syndrome, it was our aim to compare the risk and CSs detected by CCTA in an Israeli population sample.
Methods
The study was retrospective, observational, and cross-sectional and included 190 asymptomatic subjects without known coronary disease, who had undergone CCTA in the setting of primary prevention assessment from 2006 to 2007.
The Helsinki committee of Rabin Medical Center in Israel approved the study. Data were collected on age, gender, and the presence of cardiovascular risk factors, such as smoking, diabetes, hypertension, or a family history of coronary heart disease. All patients underwent blood pressure and heart rate measurement. The laboratory data included examination of the glucose level and lipid profile.
The Framingham risk and SCORE scores were calculated for each subject, taking into account their age and gender, systolic blood pressure, diabetes, smoking status, and total, high-density lipoprotein, and low-density lipoprotein cholesterol levels. According to the calculations using the European SCORE, the Israeli population is considered to be at low risk. CCTA was performed with a 64-slice instrument. The subjects with a heart rate >60 beats/min received a β blocker (propranolol 10 mg) 2 hours before the examination. The exclusion criteria were allergy to the contrast medium, an irregular heart rate, and impaired renal function. All slices were taken during 1 inspiration while injecting contrast media (iodixanol) at a rate of 5 ml/s. The imaging was done simultaneously with electrocardiography. Transaxial imaging reconstruction of the coronary arteries was then accomplished. As routinely acceptable, a preliminary analysis of the CS was calculated for each patient.
The results from CCTA were interpreted by expert physicians from the imaging department of the hospital, in cooperation with cardiologists from the Rabin Medical Center. Findings regarding the coronary arteries’ lumen patency, stenosis severity, CS, and nature of atherosclerotic plaque were recorded.
The atherosclerotic burden was calculated using the CS, as recently defined : 0, no calcification; 1 to 99, mild calcium; 100 to 399, moderate calcium; and >400, severe calcification. Our study considered a CS >100 as evidence of significant coronary calcification. The severity of coronary artery stenosis was determined as follows: 0%, no stenosis; 1% to 50%, mild stenosis; and >50%, severe stenosis. The risk score calculations using the Framingham score and European SCORE were compared with the severity and nature of coronary artery disease for each patient.
To compare the extent of coronary calcification and severity of stenosis detected using CCTA with the risk stratification using the Framingham score and the European SCORE, a relative predictive value was determined using an ordinal regression model. The variables in that model included age, gender, diabetes mellitus (yes vs no), hypertension (cutoff point 140/90 mm Hg), high-density lipoprotein and low-density lipoprotein levels, and the score results.
Results
A total of 190 asymptomatic subjects, 160 men (84%) and 30 women (16%) were examined. Their mean age was 55 ± 9.7 years (range 34 to 92). Of the 190 subjects, 67% were smokers (average 28.92 pack-years), and 74 (39%) had hypercholesterolemia. The cholesterol level ranged from 114 to 332 mg/dl (average 197.7). The low-density lipoprotein level ranged from 23 to 245 mg/dl (average 117), and the high-density lipoprotein level ranged from 6 to 118 mg/dl (average 53.2). The triglyceride level ranged from 6 to 488 mg/dl (average 137.45). Of the 190 patients, 127 (67%) had hypertension. The systolic blood pressure was 100 to 175 mm Hg (average 132.7), and the diastolic blood pressure was 65 to 110 mm Hg (average 82.3). Finally, 26 subjects (14%) had type 2 diabetes mellitus, and 1 had type 1 diabetes mellitus.
The Framingham score revealed a 0.1% to 54.9% (average 11.2%) risk of developing coronary disease within 10 years. The results of the European SCORE revealed a 0% to 22% (average 2.6%) risk of cardiovascular death within 10 years. The CS calculation using CCTA was 0 to 1,936 (average 136.9). The metabolic data are summarized in Table 1 . The risk score calculations are listed in Table 2 . A correlation was found between the Framingham risk score and European SCORE with the CS and severity of atherosclerotic plaque using CCTA ( Figures 1 and 2 ).
| Variable | Mean | Median | SD | Range |
|---|---|---|---|---|
| Total cholesterol (mg/dl) | 197.6 | 195 | 38.1 | 11–332 |
| Triglycerides (mg/dl) | 137.4 | 118 | 78.1 | 1–488 |
| High-density lipoprotein cholesterol (mg/dl) | 53.2 | 51 | 16.9 | 6–118 |
| Low-density lipoprotein cholesterol (mg/dl) | 117 | 115 | 35 | 11–245 |
| Systolic blood pressure (mm Hg) | 132.7 | 130 | 15.2 | 100–175 |
| Diastolic blood pressure (mm Hg) | 82.3 | 80 | 8.9 | 65–110 |
| Mean | Median | SD | Range | |
|---|---|---|---|---|
| Framingham risk score (%) | 11.24 | 10.250 | 7.6 | 0.1–54.9 |
| European Systematic Coronary Risk Evaluation (%) | 2.60 | 1.80 | 2.9 | 0–22 |
| Calcium score | 136.95 | 11.00 | 283.5 | 0–1,936 |
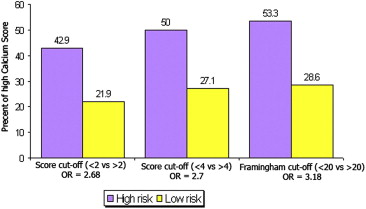
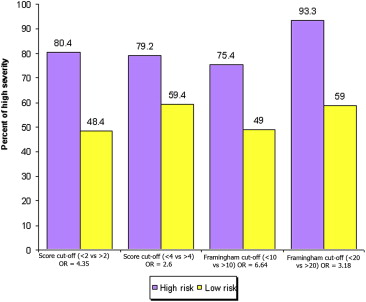
When comparing the SCORE and Framingham risk factors, we found significant correlations to the CS and plaque severity per CCTA. A SCORE calculation >2 versus <2 was related to a greater incidence of a CS >100 (21.9% vs 42.9%, odds ratio [OR] 2.68, p = 0.001). The high-risk score >4 for SCORE versus a low-risk score <4 was related to a greater incidence of CS >100 (50% vs 27.1%; OR 2.7, p = 0.001). The high-risk score (>20) versus low-risk score (<20) for the Framingham risk calculation was related to a greater incidence of CS >100 (53.3% vs 28.6%; OR 3.18, p = 0.001). The high-risk versus low-risk score for the SCORE was related to greater plaque severity (79.2% vs 59.4%; OR 2.6, p = 0.001). The high-risk versus low-risk score for the Framingham risk calculation was also related to greater plaque severity (93.3% vs 59%; OR 3.18). Statistical regression analysis demonstrated that the variables that best predicted the severity of plaque stenosis were age (p <0.001), male gender (p <0.01), diabetes mellitus (p <0.05) and hypertension (p = 0.01).
Results
A total of 190 asymptomatic subjects, 160 men (84%) and 30 women (16%) were examined. Their mean age was 55 ± 9.7 years (range 34 to 92). Of the 190 subjects, 67% were smokers (average 28.92 pack-years), and 74 (39%) had hypercholesterolemia. The cholesterol level ranged from 114 to 332 mg/dl (average 197.7). The low-density lipoprotein level ranged from 23 to 245 mg/dl (average 117), and the high-density lipoprotein level ranged from 6 to 118 mg/dl (average 53.2). The triglyceride level ranged from 6 to 488 mg/dl (average 137.45). Of the 190 patients, 127 (67%) had hypertension. The systolic blood pressure was 100 to 175 mm Hg (average 132.7), and the diastolic blood pressure was 65 to 110 mm Hg (average 82.3). Finally, 26 subjects (14%) had type 2 diabetes mellitus, and 1 had type 1 diabetes mellitus.
The Framingham score revealed a 0.1% to 54.9% (average 11.2%) risk of developing coronary disease within 10 years. The results of the European SCORE revealed a 0% to 22% (average 2.6%) risk of cardiovascular death within 10 years. The CS calculation using CCTA was 0 to 1,936 (average 136.9). The metabolic data are summarized in Table 1 . The risk score calculations are listed in Table 2 . A correlation was found between the Framingham risk score and European SCORE with the CS and severity of atherosclerotic plaque using CCTA ( Figures 1 and 2 ).


