Esophageal pH Studies in Esophageal Disease
Steven R. DeMeester
Tom R. DeMeester
Twenty-Four-Hour Esophageal PH Monitoring and Gastroesophageal Reflux
Diagnosis of Gastroesophageal Reflux Disease
Gastroesophageal reflux disease (GERD) is a common disorder in the United States. It is defined by increased esophageal exposure to refluxed gastric juice, and while the definition of GERD is straightforward, the diagnosis is not. Classic symptoms of GERD include heartburn and regurgitation; however, disorders such as achalasia, cholelithiasis, gastritis, gastric or duodenal ulcer, and coronary artery disease all can produce symptoms that mimic GERD. Costantini and colleagues6 (1993) have shown that GERD can be objectively demonstrated in only about 60% of patients with typical symptoms. Even more difficult are the atypical or extraesophageal symptoms of reflux, including chest pain, hoarseness, recurrent sore throat, dental caries, bronchospasm, wheezing, chronic cough, or recurrent chest infections. Consequently the diagnosis of GERD on the basis of symptoms alone is neither sensitive nor specific.
One approach to the diagnosis of GERD is to identify reflux with scintiscanning or barium radiography or to reproduce the symptoms with an acid-perfusion or Bernstein test. These tests, along with standard acid reflux testing, lack sensitivity. Endoscopy is commonly performed in patients with reflux symptoms, and although the presence of erosive esophagitis is quite specific, it also lacks sensitivity. Many patients with GERD, especially those with respiratory manifestations, do not have esophagitis. With the introduction of potent acid-suppressing medications, another common practice is to treat patients with reflux symptoms with a proton pump inhibitor; if the symptoms improve, a presumptive diagnosis of GERD is made. However, making a diagnosis based on response to therapy violates the adage that diagnosis should precede therapy and has led to inappropriate use of these medications for a variety of nonreflux problems.
The most reliable way to diagnose GERD is to document increased esophageal exposure to gastric juice with ambulatory 24-hour pH monitoring. This technique allows clinicians to quantitate esophageal acid exposure and diagnose reflux disease when acid exposure exceeds the upper limits of normal. Consequently, 24-hour pH monitoring has emerged as the test with the greatest sensitivity and specificity for the diagnosis of gastroesophageal reflux and is currently considered the “gold standard.” It can be performed with the standard transnasal catheter or with a new wireless system that is catheter free after deployment of the monitoring device.
Importance of 24-Hour Esophageal pH Monitoring
Antireflux therapy can be successful only to the extent that the patient’s symptoms are due to reflux disease. Consequently it is critical to confirm the diagnosis and evaluate the pathophysiologic abnormalities that are causing GERD, especially when surgical intervention is being considered. With the introduction of laparoscopic fundoplication, more patients with early reflux disease are presenting for surgery. Esophagitis is often absent in these patients; it is therefore necessary to interpret the results of physiologic studies carefully in order to identify appropriate surgical candidates. A multivariate analysis of factors predicting outcome after laparoscopic Nissen fundoplication by Campos and colleagues3 at our center showed that an abnormal 24-hour pH score had the best correlation with a good outcome. Other significant predictors of a good outcome in this analysis were the presence of typical reflux symptoms and substantial symptomatic improvement with preoperative acid-suppression medication. When patients had all three factors in their favor, a good to excellent outcome was achieved in 97.4%.
The purpose of monitoring esophageal pH is to detect the presence of increased esophageal exposure to refluxed acidic gastric contents. Normally, gastric pH is in the range of 1 to 2, and the intraluminal pH of the esophagus is between 4 and 7. A dip in the continuously measured esophageal pH <4 has become the most commonly used threshold for determining a reflux episode. There are three main causes of an increased exposure of the esophagus to refluxed gastric juice:
A structurally defective lower esophageal sphincter (LES), often in combination with a hiatal hernia
Inefficient esophageal clearance of refluxed gastric juice as a consequence of either low peristaltic amplitudes or an
increased percentage of simultaneous or ineffective contractions in the esophageal body
Gastric abnormalities that cause delayed gastric emptying or increased gastric pressure, precipitating reflux through what otherwise might be a competent LES
The most common cause of abnormal reflux is a functionally defective LES. Many of these patients have a hiatal hernia, which further compromises LES function. In early disease, the sphincter is competent except during periods of stress, which occur with eating and gastric distention. A pH tracing in these patients typically demonstrates frequent episodes of reflux limited primarily to the upright, postprandial period. Bipositional reflux—that is reflux in both the upright and supine positions—is associated with more advanced disease and usually indicates that function of the LES is severely impaired. Pure supine reflux
is rare. Intermittent, prolonged reflux episodes on the 24-hour pH tracing suggest delayed esophageal clearance, particularly if they occur in the upright position.
is rare. Intermittent, prolonged reflux episodes on the 24-hour pH tracing suggest delayed esophageal clearance, particularly if they occur in the upright position.
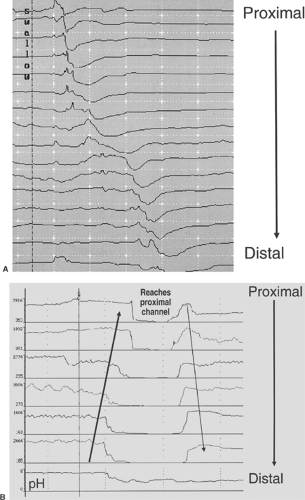
Detailed analysis of the pH tracing is also important when no abnormal reflux is detected in patients with typical reflux symptoms or complications of reflux disease. Duodenal contents (composed of pancreatic and biliary secretions) are alkaline and have a pH of 6 to 8. In patients with duodenogastric reflux, the alkaline secretions may neutralize gastric acid to a pH >4. Consequently reflux episodes into the esophagus would not be detected. One clue that this might be occurring is an abrupt fall in esophageal pH from a baseline of 6 to 7 to a pH between 4 and 5. If gastroduodenal reflux is suspected, a probe that measures bilirubin can be used to prove abnormal biliribin exposure and confirm the diagnosis of gastroduodenal reflux. Impedance monitoring techniques have recently been developed. This technology allows measurement of changes in esophageal luminal impedance at multiple levels and can demonstrate reflux events of both acid and nonacid when combined with a pH probe (Fig. 132-1).
Food in the stomach can also neutralize gastric acid and is another cause of a normal pH score despite typical reflux symptoms. Ter and colleagues24 have suggested that exclusion of meal periods from analysis of a 24-hour pH record improves the separation between patients and normal subjects and allows for a more accurate classification of patients. A false-negative test can also occur owing to probe malfunction or misplacement because of coiling during insertion or the patient’s vigorous coughing or retching after placement. Another important cause of a normal study in a patient with typical reflux symptoms is medication use, particularly proton pump inhibitors, within several days of the study. Similarly, atrophic gastritis from conditions such as pernicious anemia or other causes that produce achlorhydria will result in a normal study. This should be detected at the initiation of the study by the finding of gastric pH above 4 when the probe is dipped into the stomach. There is little use in looking for acid reflux in the setting of gastric achlorhydria; other conditions, such as weak acid or bile reflux, should be considered in these patients.
Digitrappers and Computers
The earliest prolonged recordings of esophageal pH required that the patient remain in one place attached to a chart recorder throughout the study period. The chart recorders used a large amount of paper and required tedious, time-consuming manual analysis of each recording. With the advent of the personal computer, solid-state memory recorders, and analog-to-digital converters, outpatient ambulatory pH monitoring over a full 24-hour period has become standard. The newest data loggers are capable of simultaneously recording esophageal pressure and pH at a sampling frequency of eight times per second, and they contain event markers that enable the patient to document meals, sleep periods, and symptomatic episodes.
Analysis of Data: Derivation of Gastroesophageal Score
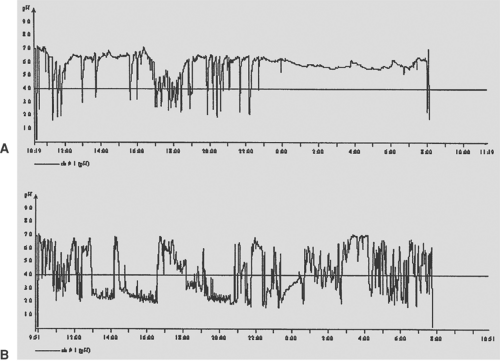
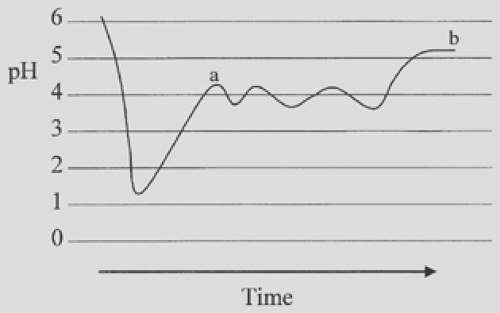
It is important to emphasize that 24-hour esophageal pH monitoring should not be considered a test for reflux but instead a means of measuring esophageal exposure to gastric juice. To define abnormal exposure, normal exposure was first determined in a group of asymptomatic volunteers. Analysis of these pH tracings allowed calculation of the time that esophageal pH was <4. However, this value did not reflect how the exposure occurred (i.e., whether it occurred as a single long episode or multiple short episodes) (Fig. 132-2). Therefore, to characterize esophageal acid exposure fully, it is necessary to know the number of times that esophageal pH drops below 4 and the duration of each episode. A problem with these parameters is that esophageal pH can fluctuate just above and below 4 after a reflux episode (Fig. 132-3). In our opinion, a reflux episode ends when the pH rises above 4 for the first time. This method
allows for the most accurate means of measuring the frequency and duration of reflux episodes.
allows for the most accurate means of measuring the frequency and duration of reflux episodes.
In 1974, Johnson and DeMeester14 chose to report the results of 24-hour pH monitoring in the following manner: (a) cumulative reflux time, expressed as the percentage of total monitored time, percentage of time monitored upright, and percentage of time monitored supine; (b) frequency of reflux episodes, expressed as the number of reflux episodes per 24 hours; and (c) duration of reflux episodes, expressed as the number of episodes longer than 5 minutes and the length in minutes of the longest episode. This report identified six components of a 24-hour pH record that could be specifically analyzed (Table 132-1). Significantly, when normal values for these six components were compared among three major centers in the United States and various centers throughout the western world, there was an unexpected uniformity of results. This would indicate that esophageal acid exposure can be quantified and that, in normal individuals, it is similar despite ethnic and dietary differences (Table 132-2).
During the initial analysis of 24-hour esophageal pH records obtained from patients with typical symptoms of gastroesophageal reflux, it was noted that not all six components were abnormal in each patient. Therefore, in patients who had a mixture of normal and abnormal components, some means of assessing the relative significance of each component of analysis was necessary to make an overall determination of whether the patient had abnormal esophageal exposure to acid. A scoring system based on the standard deviation from the mean for each of the six components, as measured in 50 normal subjects, solved this problem. Bremner and colleagues2 described the final formula and its derivation in detail. The scoring system provides a method of weighing the significance of each of the six components based on the reliability of each. Currently, an IBM-compatible computer program reads pH records and provides the data for each individual component as well as a composite score calculated from all six, typically at pH <4, although other pH thresholds can be displayed as well (Fig. 132-4). An advantage of the scoring system, noted by Richter and associates,19 is that it is not specific to sex. Studies have demonstrated that men have more physiologic reflux than women; thus, if the percentage of time pH is <4 is used as the sole criterion for identifying abnormal acid exposure, sex must be taken into account. This is not necessary when the formula is used.
Performance of the Study
It is important to standardize the test so that it is performed the same way in all patients. Patients should be encouraged to be as active as they normally are during the study. All medications that affect the pH of the stomach or the motility of the foregut should be stopped before the study. It is debated how long patients should be off proton pump inhibitors, such as omeprazole, because this medication theoretically irreversibly blocks the proton pump of a parietal cell, and it is unclear how long it takes for gastric secretion to return to normal when the medication is stopped. In 1992, Marks and coworkers17 reported that even 4 weeks after cessation of proton pump inhibitors, some patients still had suppressed basal and mean acid output. Our policy is to ask patients to stop proton pump inhibitors 2 weeks before the study. This interval is difficult for many patients with severe reflux symptoms; however, they must understand that even one dose of a proton pump inhibitor can result in a false-negative test. We allow substitution of an H2-receptor antagonist up to 72 hours before the study, and antacids may be used until the night before the study. Medications that promote gastrointestinal motility are discontinued at least 48 hours before the study.
Catheter and Catheterless Systems
Traditionally, the 24-hour pH study has been performed with a catheter passed down the nose, which is left in place for the
duration of the study. However, even though the catheter is small, some patients have difficulty tolerating it for the entire 24-hour period, and nearly all patients experience some degree of social embarrassment associated with wearing the catheter in public. This may lead to alterations in a patient’s normal routine that can produce a false-negative test in some circumstances. Consequently a new catheterless system has been developed and is being used clinically. Called the Bravo probe, this system uses a capsule containing the pH probe, a transmitter, and a battery, all in a small device that is attached to the esophageal mucosa with a special pin (Fig. 132-5). The device transmits pH data to a storage device worn on the belt. Generally, the capsule falls off after several days and is passed out via the gastrointestinal tract. By eliminating the transnasal catheter, this system improves social acceptability (no observer even knows that a pH study is in progress), eliminates the oropharyngeal discomfort associated with a catheter, and has improved patient compliance and acceptance of the study (Fig. 132-6). In addition, it allows 48 hours of pH data to be collected and analyzed.
duration of the study. However, even though the catheter is small, some patients have difficulty tolerating it for the entire 24-hour period, and nearly all patients experience some degree of social embarrassment associated with wearing the catheter in public. This may lead to alterations in a patient’s normal routine that can produce a false-negative test in some circumstances. Consequently a new catheterless system has been developed and is being used clinically. Called the Bravo probe, this system uses a capsule containing the pH probe, a transmitter, and a battery, all in a small device that is attached to the esophageal mucosa with a special pin (Fig. 132-5). The device transmits pH data to a storage device worn on the belt. Generally, the capsule falls off after several days and is passed out via the gastrointestinal tract. By eliminating the transnasal catheter, this system improves social acceptability (no observer even knows that a pH study is in progress), eliminates the oropharyngeal discomfort associated with a catheter, and has improved patient compliance and acceptance of the study (Fig. 132-6). In addition, it allows 48 hours of pH data to be collected and analyzed.
Table 132-1 Esophageal Acid Exposure in 50 Healthy Volunteers | |||||||||||||||||||||||||||||||||||||||||||||||||||||||||||||||
|---|---|---|---|---|---|---|---|---|---|---|---|---|---|---|---|---|---|---|---|---|---|---|---|---|---|---|---|---|---|---|---|---|---|---|---|---|---|---|---|---|---|---|---|---|---|---|---|---|---|---|---|---|---|---|---|---|---|---|---|---|---|---|---|
| |||||||||||||||||||||||||||||||||||||||||||||||||||||||||||||||
Table 132-2 Normal Values for Six Components of pH Values from Three Different Centers in the United States; Data Expressed as Median and Range | ||||||||||||||||||||||||||||||||||||||||
|---|---|---|---|---|---|---|---|---|---|---|---|---|---|---|---|---|---|---|---|---|---|---|---|---|---|---|---|---|---|---|---|---|---|---|---|---|---|---|---|---|
| ||||||||||||||||||||||||||||||||||||||||
Stay updated, free articles. Join our Telegram channel

Full access? Get Clinical Tree


