Magnetic Resonance Imaging of the Thorax
Warren B. Gefter
Chest radiography is almost always the first imaging study for evaluating known or suspected thoracic disease. Subsequent imaging may include computed tomography (CT), conventional contrast angiography, or echocardiography. Magnetic resonance imaging (MRI) has been used primarily as a problem-solving tool: it clarifies the findings of other imaging modalities. However, MRI is also beginning to establish itself as the primary modality for evaluating a limited set of diseases. Unique strengths of MRI include high soft tissue contrast, multiplanar imaging, and noninvasive vascular imaging. From a technical standpoint, the thorax presents a challenge for MRI. Image quality is degraded by pulsatile blood flow, cardiac and respiratory motions, and the heterogeneous magnetic susceptibility of lung. Numerous technical innovations have remedied some of these problems. Yet physicians have been slow to embrace MRI. The relatively high cost and limited availability of MRI may be contributing factors. Clinical outcome studies will be needed to determine whether MRI is cost-effective for patients with thoracic disease. The goals of this chapter are to introduce the principles and practice of thoracic MRI and to familiarize the reader with the strengths and weaknesses of this rapidly evolving modality.
Flexibility is both a strength and weakness of MRI. The number of ways to image the thorax with MRI is virtually unlimited, but not all imaging sequences can be applied to every patient. The MRI examination should be tailored to answer a specific clinical question or evaluate a specific pathologic entity. Thoracic MRI is poorly suited to an unfocused survey or “search and destroy” examination. The referring clinician should provide a relevant clinical history to help the radiologist perform a proper MR study. Additional clinical information may be obtained by the technologist or radiologist by interviewing the patient before the examination. Excellent communication between the surgeon and radiologist helps ensure that MR examinations will be appropriate, focused, and efficient.
Theory and Technique
General Principles
To the uninitiated, MR images are enigmatic. The appearance and physical basis of soft tissue contrast are different for MRI and CT. Likewise, the mechanism of soft tissue enhancement by exogenous contrast materials is different for these two studies. In addition, the artifacts that must be understood to render a correct diagnostic interpretation differ between MRI and CT. These phenomena and others can be understood with a modicum of basic MRI theory. Although a complete theoretical description of MRI lies in quantum mechanics, many important concepts can be understood with simple analogies from classical physics.
MRI represents an interaction between certain atomic nuclei, an external magnetic field, and applied radiofrequency (RF) waves. Atomic nuclei with an odd number of protons or neutrons exhibit a property called spin, a quantum mechanical phenomenon that does not connote a spinning motion. However, for heuristic purposes, it can be helpful to consider spin in the ordinary sense of a spinning top. In the human body, the most abundant nuclear species with spin is the hydrogen nucleus or proton. The two tissues with the highest proton concentrations or proton densities are fat and water; pure water has a proton concentration of 110 M. Tissue proton density is proportional to MR signal intensity and is therefore a source of soft tissue contrast. Other nuclei in the human body—such as fluorine, phosphorus, and sodium—also exhibit spin but are present at much lower concentrations. Noble gases such as helium-3 (3He) and xenon-129 (129Xe) exhibit spin and can be hyperpolarized for use as inhalational contrast agents. Currently, hydrogen is the only nucleus routinely used in clinical MRI, although this could change in the future.
Spin
The spin of the positively charged hydrogen nucleus creates a small magnetic moment, analogous to a tiny bar magnet. In MRI parlance, magnetic moments are called spins. The magnitude and direction of a spin can be represented by a small vector. An ensemble of spins is randomly oriented in the absence of an external magnetic field. However, in the presence of an external magnetic field (designated B0 and, by convention, oriented in the +Z direction of a Cartesian coordinate system), spins of one-half of the nuclei (e.g., 1H) establish a thermal equilibrium distribution in which they align either parallel or antiparallel to B0. A slight excess of spins aligns with B0 because this is a lower-energy condition. At a magnetic field strength of 1.5 tesla,
typical for a high-field MRI scanner, only seven excess spins per million are aligned with B0. MRI signal intensity is proportional to the tissue density of excess spins. Although pure water has a total spin density of 110 M, the excess spin density is considerably lower at 0.8 mM. Higher-field-strength MRI scanners usually produce better (i.e., less noisy) images because the stronger the external magnetic field, the greater the excess spin density.
typical for a high-field MRI scanner, only seven excess spins per million are aligned with B0. MRI signal intensity is proportional to the tissue density of excess spins. Although pure water has a total spin density of 110 M, the excess spin density is considerably lower at 0.8 mM. Higher-field-strength MRI scanners usually produce better (i.e., less noisy) images because the stronger the external magnetic field, the greater the excess spin density.
Hyperpolarization
If the distribution of spins between the parallel and antiparallel states could somehow be altered from the thermal equilibrium distribution, it would be possible to increase MR signal intensity. In fact, a nonequilibrium spin distribution has been achieved with the noble gases helium-2 (3He) and xenon-129 (129Xe) using optical pumping to hyperpolarize the spins. Hyperpolarization increases the net magnetization by almost 100,000-fold. Despite the relatively low concentration of spins in a noble gas (about 45 mM under ordinary conditions), the MR signal is comparable with that of nonhyperpolarized water. Hyperpolarized noble gases offer the intriguing possibility of directly imaging air-containing spaces in the body such as the lungs (Fig. 11-1), tracheobronchial tree, and paranasal sinuses.
Nuclear Precession
A key concept is that spins precess around the axis of the external magnetic field in a manner similar to the wobble of a spinning top. The precession frequency is directly proportional to the strength of B0 and is called the Larmor frequency. The proton Larmor frequency in a 1.5-tesla MRI scanner is about 64 MHz, similar to the frequency of an FM radio station. Water protons precess slightly faster than fat protons, 220 Hz faster at 1.5 tesla. This small frequency difference can be exploited in chemical shift techniques such as opposed-phase MRI and frequency-selective fat suppression.
The vector sum of all spin magnetic moments is called net magnetization. Only excess spins contribute to net magnetization; all other spins sum to zero. At equilibrium, the net magnetization points in the +z direction, where it is called longitudinal magnetization. Longitudinal magnetization does not produce an MR signal. The plane perpendicular to the Z axis is the XY plane, and magnetization that lies in this plane is called transverse magnetization. At equilibrium, no transverse magnetization occurs. MR signal is derived exclusively from transverse magnetization. Transverse magnetization produces a time-varying magnetic field that induces a tiny alternating current in a wire loop receiver placed near the source. These tiny currents are digitized, amplified, combined, and Fourier-transformed to yield the MR image.
Coils
Receivers or coils are the physical entities that detect the faint signal emanating from the patient’s tissues. Coils also transmit RF, thereby delivering RF energy into the patient. Coils can be specially configured to receive signal from anatomic regions of various sizes and shapes. The two most frequently used coils for thoracic imaging are the body coil and phased array torso coil. The body coil is built into the bore of most superconducting MRI scanners and can be used for imaging large anatomic regions, such as the entire thorax. The maximum craniocaudal field of view of the body coil is limited to about 48 cm. The phased array torso coil is used for imaging slightly smaller anatomic regions, such as the heart or thoracic aorta, but with a better signal-to-noise ratio and higher spatial resolution than the body coil. Special surface coils can be used for imaging small, well-defined regions, such as a portion of a rib, with high spatial resolution. In selecting a particular coil, one makes a trade-off between anatomic coverage and spatial resolution.
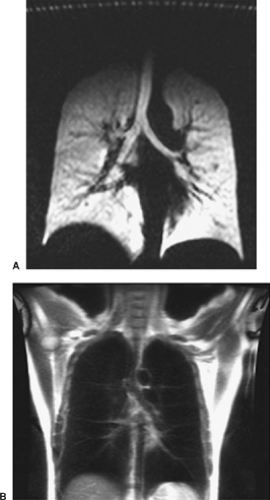 Figure 11-1. A coronal image through the trachea and lung parenchyma from a 2D multislice acquisition obtained in a 14-second breath hold after inhalation of 1 L of 4.5 mM polarized He-3 (A), compared with a conventional proton MRI of the lung parenchyma (B). The image in (A) was acquired using a GRE sequence with TR/TE/flip angle = 7 sec/2.1 msec/10 degrees and 10-mm slice thickness. The image in (B) was acquired using a single-shot FSE sequence with TR/TE = ∞/33 msec, echo-train length (ETL) = 64. (From Fain SB, et al. Functional lung imaging using hyperpolarized gas MRI. J Magn Reson Imaging 2007;25:910.) |
Resonance
RF waves interact with spin magnetic moments when the RF frequency is tuned to the spin precession frequency. This concept is called resonance and is so important that it has been incorporated into the name MRI. Short RF pulses are used to change the orientation of the net magnetization or to tip it. For example, a 90-degree RF pulse, or 90-degree flip angle, tips longitudinal magnetization into the transverse plane, where it will generate a signal. A 180-degree RF pulse rotates transverse magnetization from the +x to the x direction, in which case it is called a 180-degree refocusing pulse. Spin-echo and fast spin-echo sequences use both 90- and 180-degree RF pulses. Gradient-echo sequences, such as those used in MR angiography, generally use RF pulses >90 degrees. Unlike spin-echo sequences, gradient-echo sequences do not use 180-degree refocusing pulses.
T1 and T2 Relaxation
A major source of soft tissue contrast in MRI is the varied relaxation behavior of hydrogen nuclei in different tissues. The two parameters that describe tissue relaxation are T1 and T2. MRI sequences can be designed to accentuate differences in T1 or T2, but not both at the same time. Images that accentuate tissue T1 differences are called T1-weighted, whereas those that accentuate T2 differences are called T2-weighted. It is often possible to characterize a tissue based on its relaxation behavior. The T1 and T2 behavior of a tissue may vary with magnetic field strength. Thus, soft tissues may appear somewhat different when they are imaged on MRI scanners having different magnetic field strengths.
T1 is the characteristic time for spins to reestablish a thermal equilibrium distribution. At equilibrium, no transverse magnetization occurs, only longitudinal magnetization. A 90-degree RF pulse, for example, temporarily disturbs the equilibrium by tipping all longitudinal magnetization into the transverse plane. Over time, the longitudinal magnetization increases exponentially from zero to the equilibrium value, which, under ordinary conditions, is also the maximum value. T1 relaxation processes involve an exchange of energy between spins and their environment (the lattice), which is why T1 is also called spin-lattice relaxation.
Proton T1 values vary among tissues, and these differences generate soft tissue contrast on T1-weighted MR images. Tissues with a short T1 appear bright, and those with a long T1 appear dark. Many strategies exist for introducing T1 weighting. Consider, for example, the behavior of longitudinal magnetization, initially at equilibrium, acted on by a train of 90-degree pulses separated by a repetition time of TR. If TR is much longer than T1, the longitudinal magnetization returns to equilibrium before the next 90-degree pulse arrives. However, if TR is shorter than T1, the longitudinal magnetization never reaches equilibrium. Instead, it reaches a steady-state level that is less, sometimes much less, than its maximum value. And after the 90-degree pulse, the transverse magnetization and the MR signal it produces are also less than its maximum value. Fat protons have a shorter T1 than water protons. To create T1 contrast between fat and water, choose a TR that is longer than the T1 of fat but shorter than the T1 of water. The result is that fat appears brighter than water. Conversely, a very long TR virtually eliminates T1 contrast from an image. The image acquisition time increases directly with TR, so long TR pulse sequences are lengthy.
T2 is the characteristic time for decay of transverse magnetization. T2* is similar to T2 but includes spin dephasing caused by magnetic field gradients and inhomogeneities. After an RF pulse creates transverse magnetization, all spins are in phase, which is to say that their magnetic moments all point in the same direction. At this time, the vector sum, the transverse magnetization, assumes a maximum value. Subsequently, as the spins begin to interact with one another and with their environment, they fan out or dephase in the transverse plane. Eventually, the spins become randomly oriented, and the vector sum vanishes. Any process that increases the rate of spin dephasing also increases the T2 relaxation rate or, equivalently, shortens T2. In the human body, T2 relaxation processes are either intrinsic to a tissue, related to tissue interfaces, or due to external causes, such as magnetic field inhomogeneity. Intrinsic T2 relaxation arises from the mutual interactions of spins within a tissue. It is generally true that greater interaction leads to T2 shortening. This is why T2 is also called spin-spin relaxation. Water protons have a long T2 because water molecules move so rapidly, on an MRI time scale, that the spins cannot interact effectively with one another.
Like T1, proton T2 values also vary among tissues, and these differences generate soft tissue contrast on T2-weighted MR images. Tissues with a short T2 appear dark, and those with a long T2 appear bright. Thus, water protons, which have a long T2, appear bright on T2-weighted images. In the lung, heterogeneous magnetic susceptibility markedly shortens T2 and T2*. The complex architecture of the lung juxtaposes magnetically dissimilar tissues (i.e., those with different magnetic susceptibilities), specifically water in the lung interstitium and air in the bronchoalveolar tree. Consequently normal lung parenchyma appears as a black signal void on most MR images. The low proton density of lung tissue also contributes to its MR appearance.
Echoes
Transverse magnetization decays rapidly, especially when magnetic gradients are on. The MR signal produced by the rapidly decaying transverse magnetization, which is called a free induction decay, cannot be used to make an ordinary MR image because it occurs too soon after the RF pulse. To introduce a temporal separation between the RF pulse and the MR signal, one forms an echo of the initial free induction decay. Echoes occur when dephasing spins are refocused. Refocusing causes the transverse magnetization and MR signal to pass through a second maximum, the echo. The delay between the initial RF pulse and the echo is called the echo time (TE). The maximum signal from the first echo is always less than that of the free induction decay. The signal decrement reflects T2 decay over the period TE. Thus, TE can be used to control the amount of soft tissue T2 contrast. A short TE decreases T2 contrast, whereas a long TE increases it.
Many strategies exist for producing an echo, but only two are used routinely in clinical MRI: the 180-degree refocusing pulse and magnetic gradient reversal. These two types of echoes, and the MRI sequences based on them, are called spin echo and gradient echo. The strategy used to form the first echo can be repeated to form a second echo, a third echo, and so on. Fast
spin-echo sequences use multiple equally spaced 180-degree refocusing pulses, whereas echo–planar sequences employ multiple magnetic gradient reversals. Hybrid spin-echo/gradient-echo sequences also exist but are not widely used. The trade-offs between spin echoes and gradient echoes relate to speed, image noise, soft tissue contrast, and suitability for vascular imaging.
spin-echo sequences use multiple equally spaced 180-degree refocusing pulses, whereas echo–planar sequences employ multiple magnetic gradient reversals. Hybrid spin-echo/gradient-echo sequences also exist but are not widely used. The trade-offs between spin echoes and gradient echoes relate to speed, image noise, soft tissue contrast, and suitability for vascular imaging.
Imaging
Spatial Encoding
During each echo, the receiver coil detects a cacophony of MR signals from billions and billions of hydrogen nuclei. The spatial location of these signals must be determined to make an image, a concept known as spatial localization or spatial encoding. MRI uses magnetic field gradients to localize spins in space. A magnetic field gradient, or simply a gradient, is a magnetic field whose strength varies linearly with position. MRI scanners are equipped with X, Y, and Z gradients. These can be used alone or in combination to produce a resultant gradient with any oblique orientation. The gradients add or subtract a small amount of magnetic field from the much larger B0 field. As the magnetic field changes, so does the precession frequency of the hydrogen nuclei. In effect, the gradient sets up a map between spatial location and precession frequency. Exogenous metals, such as surgical clips, prosthetic joints, and vascular stents, may distort the gradient and the map and thereby produce substantial image artifact.
MR image data can be spatially encoded in two or three dimensions. In two-dimensional (2D) imaging, a specially constructed RF pulse excites spins (i.e., creates transverse magnetization) in a thin slice of tissue while a magnetic gradient is on. The thickness and orientation of the excited slice are controlled by the strength and orientation of the gradient as well as the RF pulse. MR images can be acquired in any plane: axial, sagittal, coronal, or oblique. In contrast, the orientation of CT images is physically constrained by the position of the patient within the gantry. By exciting hydrogen nuclei only within a single slice, the spatial encoding problem is reduced to two dimensions. These two dimensions are spatially mapped using frequency encoding in one direction and phase encoding in the other. The number of phase (NP) and frequency (NF) encoding steps is called the matrix, and this, in combination with the field of view, determines the in-plane spatial resolution of the MR image. The effect is to divide the imaged slice into NP NF rectangular picture elements called pixels. A voxel is a three-dimensional (3D) volume element whose face is a pixel and whose height is the slice thickness. The dimensions of the voxel determine the spatial resolution of an MR image.
Frequency encoding steps are time-efficient; thus little penalty exists for increasing spatial resolution in this direction. However, phase encoding steps are time-inefficient: Each additional step requires an additional TR period. The acquisition time for a conventional 2D spin-echo or gradient-echo imaging sequence is TR × NP the number of signal averages. A typical matrix for a thoracic MRI is 256 frequency-encoding steps and 128 to 192 phase-encoding steps; the larger matrix element is assigned to the time-efficient frequency-encoding direction.
In 3D imaging, the RF pulse excites a rectangular volume of tissue rather than a single slice, also in the presence of a magnetic gradient. The volume may be oriented in any plane or obliquity. The excited spins are spatially localized in three dimensions using frequency encoding in one direction and phase encoding in each of the other two directions. The acquisition time for a 3D imaging sequence is TR × NP-1 × NP-2 the number of signal averages. To keep acquisition times reasonably brief, 3D imaging almost always uses a short-TR fast gradient-echo sequence. Three-dimensional imaging finds its greatest application in MR angiography.
Anatomy of a Pulse Sequence
A pulse sequence is the series of RF pulses and magnetic gradients that produces MR images at a specified location, in a specified anatomic plane, and with a specified soft tissue contrast. A pulse sequence is considered MR software, as opposed to the superconducting magnetic, the gradient coils, and the RF coils, which are MR hardware. Consider the organization of a commonly used pulse sequence: the 2D axial spin-echo sequence with a 256 × 128 matrix. The sequence consists of a train of 128 nearly identical units, one unit for each phase-encoding step. A unit begins with a slice-selective 90-degree RF pulse that plays out while a gradient is on. Next, a 180-degree refocusing pulse plays out at time TE/2 and forms an echo at TE after the 90-degree pulse. The echo is acquired in the presence of a frequency-encoding gradient, also called a readout gradient. The electronics of the MRI scanner digitize the echo into 256 data points. While the echo is evolving, a phase-encoding gradient is turned on for a brief period. The strength of this gradient is stepped, with one step for each phase encode, from negative to positive values. The next unit begins with a 90-degree pulse at time TR after the previous 90-degree pulse. The pulse sequence ends after 128 units of 90-degree pulse, 180-degree pulse-echo are completed.
The 2D spin-echo sequence can be T1– or T2-weighted by selecting the appropriate TR and TE. A short TR and short TE produce a T1-weighted image, whereas a long TR and long TE produce a T2-weighted image. Proton-density or spin-density weighting is obtained with a long TR and short TE. Proton-density weighting is rarely used in the thorax because it provides little additional diagnostic information. Because acquisition times for a conventional T2-weighted spin-echo sequence are 10 minutes or longer, this sequence is being supplanted by the faster T2-weighted fast spin-echo sequence. Spin-echo and fast spin-echo sequences can be acquired in any plane. These sequences are used primarily to identify normal and abnormal soft tissue structures, assess tissue T1 and T2 signal intensity, and determine anatomic relationships.
Gradient-echo sequences generally sacrifice soft tissue contrast for imaging speed. Many of the technologic advances in MRI—such as stronger and faster gradients, faster receivers, and more time-efficient pulse sequences—are manifest in a variety of ultrafast gradient-echo sequences. Ultrashort TR (<4 ms) and TE (<2 ms) gradient-echo sequences are now standard on most commercially available high-performance clinical MRI scanners. Short acquisition times allow gradient-echo images to be acquired during suspended respiration. Gradient echo images can be T1 weighted by using a short TR/TE, a large flip angle (60 to 90 degrees), and spoiling of residual transverse magnetization. T1-weighted fast gradient-echo sequences are particularly useful for detecting soft tissue enhancement by gadolinium-based
contrast agents. For example, breath-hold, Gd-enhanced 3D MR angiography is based on a heavily T1-weighted ultrafast 3D gradient-echo sequence. 2D and 3D gradient-echo sequences, particularly when used with flow compensation gradients, make flowing blood appear bright, but without administration of exogenous contrast materials. Cine MRI is similarly based on 2D gradient-echo sequences.
contrast agents. For example, breath-hold, Gd-enhanced 3D MR angiography is based on a heavily T1-weighted ultrafast 3D gradient-echo sequence. 2D and 3D gradient-echo sequences, particularly when used with flow compensation gradients, make flowing blood appear bright, but without administration of exogenous contrast materials. Cine MRI is similarly based on 2D gradient-echo sequences.
Cardiac and Respiratory Gating
Cardiac and respiratory motions can degrade MR image quality in the thorax. Strategies such as cardiac gating, respiratory compensation, and respiratory gating have been devised to minimize image degradation. Cardiac gating synchronizes the MR image acquisition with an electrocardiographic (ECG) tracing derived from four ECG leads placed on the precordium or back. A cardiac-gated T1-weighted spin-echo sequence uses the R-R interval as the TR. By contrast, a cardiac-gated T2-weighted spin-echo sequence uses a multiple of the RR interval, such as RR 3 or RR 4, as the TR. Adjusting the trigger delay between the R wave and the 90-degree pulse allows imaging to be performed anywhere between systole and diastole. Cardiac gating is most effective when the RR interval is nearly constant, as in normal sinus rhythm. Conversely, cardiac gating is less effective when the RR interval is highly variable, as in atrial fibrillation. Frequent ectopic beats also diminish the success of cardiac gating. Pericardial effusion may cause low ECG voltage and poor cardiac gating.
Bradycardia increases the image acquisition time but does not adversely affect image quality, although a long RR interval may cause T1-weighted images to appear proton density–weighted. Cardiac gating is standard in spin-echo and fast spin-echo imaging of the thorax.
Respiratory motion blurs images and causes ghosting artifact in the phase-encoding direction. The simplest remedy is a breath-hold acquisition, but only certain fast gradient-echo and fast spin-echo acquisitions are amenable to breath holding. For longer acquisitions, such as 2D spin echo, an option called respiratory compensation can reduce image degradation. Respiratory compensation refers to any of several methods of reordering phase-encoding steps to minimize the effects of respiratory motion. A bellows placed around the patient’s chest or upper abdomen senses the respiratory excursion and transmits the information to the MRI scanner. Respiratory compensation is only moderately effective and functions poorly when respirations are irregular. Respiratory triggering is a recent innovation. With this technique, image data are collected only during the quiet period of expiration. A drawback of respiratory triggering is that it increases image acquisition times. Apneic periods and irregular respirations may interfere with the proper functioning of respiratory triggering. Another new respiratory gating method called MR navigator echo monitors diaphragmatic position. This method is not yet widely available on clinical MRI scanners.
Cine
Cine MRI creates a series of images at a single location at multiple time points in the cardiac cycle. The name cine MRI derives from the movie-like appearance of the images when displayed consecutively in a loop. Using the ECG tracing, cine sequences divide the R-R interval into 8 to 24 time intervals and then acquire image data during each interval using a 2D gradient-echo sequence. Laminar blood flow appears bright on cine images. Turbulent or abruptly accelerating flow produces signal loss within bright blood. This feature makes cine MRI useful for detecting flow abnormalities associated with stenotic and incompetent heart valves, ventricular septal defects, and vascular and anastomotic stenoses. Cine MRI is also used to study cardiac motion, the motion of intracardiac masses, and blood flow within an aortic dissection. However, for many of these conditions, echocardiography remains the primary imaging modality. A new version of cine MRI, which permits imaging during suspended respiration, uses an ultrafast gradient echo sequence and segmented k-space acquisition.
Another new ultrafast cine gradient echo sequence, called true steady-state free precession gradient echo (variously called TrueFISP, FIESTA, and balanced FFE by different vendors), produces very bright blood and exceptional soft tissue contrast between blood and myocardium. Although ultrafast breath-hold cine MRI reduces respiratory artifact, its short TE may decrease the conspicuity of turbulent blood flow. Another innovation, spatial modulation of magnetization, has augmented the capabilities of cine MRI and permits detailed analysis of cardiac wall motion. Gradient-echo cine MRI also can be combined with velocity-encoding gradients along one or three orthogonal directions. This pulse sequence can be used to quantify flow velocity and volume flow rates in blood vessels. New ultrafast versions of this pulse sequence permit velocity and flow measurements during a single or several breath holds. Important differences exist between the flow data acquired with velocity-encoded cine MRI and Doppler ultrasound: Doppler interrogates the velocity spectrum from a small sample volume, whereas MRI provides a flow velocity for each pixel in the image. Doppler also has higher temporal resolution.
Magnetic Resonance Contrast Agents
The intravenous MR contrast agents used in routine clinical examinations are low-molecular-weight chelates of the para- magnetic rare earth metal gadolinium. These agents are highly water-soluble and rapidly equilibrate with the extracellular fluid compartment, except in the central nervous system, where the blood–brain barrier limits permeability. The chelator can be charged or uncharged, linear and flexible, or planar and rigid. Gadolinium chelates are excreted by the kidneys but otherwise exhibit no tissue or organ selectivity. Their safety profile is excellent, especially compared with the iodinated contrast materials used in CT and conventional angiography. Allergic reactions are quite rare, and only a single published report of gadolinium chelate–associated nephrotoxicity exists.
Gadolinium-containing contrast agents increase the signal intensity of perfused tissues on T1-weighted images. The kinetics of contrast enhancement are complex and reflect tissue perfusion, vascular permeability, and the interstitial volume fraction of the tissue. Although tissue enhancement may appear similar on MRI and CT, the mechanism of enhancement is different. Gadolinium chelates interact with extracellular water to shorten the T1 of the nearby water protons. The gadolinium itself produces no MR signal. Thus, gadolinium acts indirectly. The iodine in iodinated contrast media directly attenuates x-rays. Gadolinium chelates are more sensitive than iodinated contrast media, producing tissue enhancement at lower concentrations. A mass
that does not enhance on CT may well enhance on MRI, which may lead to errors in lesion characterization. Caution is advised when extrapolating to MRI the lessons learned from CT.
that does not enhance on CT may well enhance on MRI, which may lead to errors in lesion characterization. Caution is advised when extrapolating to MRI the lessons learned from CT.
Novel MR contrast agents are undergoing clinical testing in the United States and abroad. Among these are blood pool agents, which have potential application in thoracic MR angiography. These agents include large macromolecular polygadolinium complexes; small hydrophobic gadolinium chelates that bind to serum albumin; and colloidal iron oxide nanoparticles. Unlike ordinary gadolinium chelates, which rapidly equilibrate with the extracellular space, blood pool agents remain intravascular for long periods. These agents hold promise for improved MR pulmonary and coronary angiography. Colloidal iron oxide also has potential for improving the accuracy of lung cancer staging. This agent is phagocytosed by cells of the reticuloendothelial system. In particular, normal and reactive lymph nodes accumulate colloidal iron oxide, whereas lymph nodes replaced by malignant cells do not. Iron oxide–enhanced MRI represents an intriguing strategy for distinguishing benign and malignant adenopathy and may play an important role in the future.
Magnetic Resonance Angiography
MR angiography is rapidly becoming a noninvasive alternative to conventional contrast angiography. MR angiography techniques are categorized as black blood and bright blood, depending on the signal intensity of flowing blood. Spin echo is the classic black-blood pulse sequence. Spatial saturation bands, cardiac gating in systole, and increased TE (about 20 ms) help suppress signal from flowing blood. Black-blood spin-echo MR angiography images also depict nonvascular soft tissue structures. Drawbacks to black-blood MR angiography include long acquisition times, poor spatial resolution, and difficulty displaying the data as an angiogram-like projection image. Another drawback of black-blood MR angiography is that slowly flowing blood may appear bright. This can lead to confusion in distinguishing intraluminal solid tissue, such as thrombus or tumor, from slowly flowing blood. Such confusion may be obviated with a promising new black-blood MR angiography technique called double-inversion recovery fast spin echo, used with or without cardiac gating.
Bright-blood MR angiography techniques include time-of-flight (TOF) MR angiography, phase-contrast (PC) MR angiography, and gadolinium-enhanced 3D MR angiography. These three techniques use different strategies to make vessels appear brighter than surrounding soft tissues. It is important to understand that most bright-blood MR angiography imaging sequences are inadequate for evaluating soft tissue structures; to obtain this information, additional imaging sequences must be appended to the MRI examination. TOF and PC MR angiography use flow-related enhancement to increase the signal intensity of flowing blood relative to that of the stationary background tissues. In addition, PC MR angiography develops vessel contrast from velocity-associated phase shifts in flowing blood.
TOF and PC MR angiography are infrequently used in the thorax because they are slow and not especially robust. They are best suited to imaging blood flow that is laminar and of constant velocity. Artifacts arise when blood flow is slow, turbulent, pulsatile, or in plane. Cardiac gating can reduce pulsatility artifact but increases acquisition times. For optimal results, 2D TOF sequences should be prescribed with the imaging slices oriented orthogonal to the direction of blood flow, a requirement that is not easily satisfied in the superior mediastinum. TOF MR angiography uses flow compensation gradients, also called gradient moment nulling, to maintain the phase coherence of flowing blood. In 3D TOF and PC MR angiography, vessels may become saturated as the blood flows within the imaging volume. These and other artifacts may cause signal loss that can simulate vascular disease. The long acquisition times preclude using these 3D MR angiography techniques during suspended respiration. Nonetheless, 2D TOF MR angiography, acquired during repeated breath holding, is useful for evaluating the superior vena cava.
The workhorse of thoracic MR angiography is gadolinium-enhanced 3D MR angiography, a technique originally developed by Prince and coworkers in 1993. An intravenous bolus of gadolinium chelate is used to create intravascular high signal on a heavily T1-weighted fast 3D gradient-echo sequence. Because flow-related enhancement plays almost no role in developing intravascular contrast, gadolinium-enhanced 3D MR angiography is more robust than TOF and PC MR angiography. Acquisition times are so short that images can be acquired in a single 15- to 30-second breath hold. The delay between contrast administration and imaging determines which vascular beds contain contrast agent and appear bright. Several data sets are usually collected to ensure adequate opacification of the desired vascular bed. The arterial-phase MR angiography images are essentially a vascular luminogram, similar to that obtained with conventional angiography. These images do not adequately depict the true outer arterial wall, nor do they adequately depict nonvascular soft tissue structures. Such information is better appreciated on delayed postcontrast images, after contrast has enhanced many soft tissue structures, including the vasa vasorum. The image data from a gadolinium-enhanced 3D MR angiography study is easily postprocessed and displayed as an angiogram-like maximum-intensity projection (MIP). Limited regions of vascular anatomy or pathology can be displayed with subvolume MIPs. Intriguing new display options include surface rendering and virtual intraluminal endoscopy.
Gadolinium-enhanced 3D MR angiography is widely used to image the thoracic aorta, proximal great vessels, and central pulmonary arteries. In many medical centers, this technique has supplanted conventional contrast angiography and CT for assessing the thoracic aorta in the setting of known or suspected aneurysm or dissection. Although transesophageal echocardiography is more widely available and widely used than MR angiography, transesophageal echocardiography is more invasive and suffers from artifacts and blind spots. However, in the operating room, transesophageal echocardiography will continue to be the imaging modality of choice.
Low-dose gadolinium-enhanced 3D MR venography represents the conceptual union of conventional contrast venography and gadolinium-enhanced 3D MR angiography. Instead of injecting iodinated contrast material to opacify upper extremity and superior mediastinal veins, a 60-mL intravenous bolus of gadolinium chelate diluted 1:20 in saline is injected. The 3D MR angiography pulse sequence is acquired during the contrast injection. The gadolinium chelate must be diluted because commercially available contrast materials are too concentrated and would cause the veins to appear dark rather than bright. This MR venography technique shows promise for evaluating suspected superior vena cava (SVC) syndrome as well as deep
venous thrombosis of the subclavian and brachiocephalic veins. The dilute gadolinium bolus clears after a few minutes and causes little residual intravascular or soft tissue enhancement. Standard high-dose gadolinium-enhanced 3D MR angiography can be performed after the low-dose 3D MR venography.
venous thrombosis of the subclavian and brachiocephalic veins. The dilute gadolinium bolus clears after a few minutes and causes little residual intravascular or soft tissue enhancement. Standard high-dose gadolinium-enhanced 3D MR angiography can be performed after the low-dose 3D MR venography.
Tissue Characterization
Thoracic imaging is performed to define anatomy or to identify and characterize pathology. High soft tissue contrast makes MRI well suited to these tasks. Soft tissues are characterized on MRI according to signal intensity on T1– and T2-weighted images and degree of contrast enhancement. Pulsation artifacts and flow voids are helpful for identifying blood vessels with moderate to high flow. Techniques such as fat and water suppression and opposed-phase imaging are used to increase the conspicuity of specific tissues. Normal lung parenchyma and small soft tissue calcifications are poorly depicted on MRI. Abnormal lung parenchyma and pulmonary masses are seen on MRI but usually better characterized on CT. Among the MRI techniques for detecting larger calcifications, long-TE (i.e., T2*-weighted) gradient-echo and T2-weighted conventional spin-echo sequences are most sensitive, whereas T1-weighted spin-echo and all fast spin-echo sequences are least sensitive.
Normal lung parenchyma has been imaged using a custom-designed, ultrashort (<1 ms) TE breath-hold gradient-echo pulse sequence; the images, although intriguing, were inferior to high-resolution or conventional CT. Bone appears black on all MR pulse sequences because it contains few mobile protons. However, bone marrow is very well depicted on MRI. Despite excellent soft tissue contrast, MRI is frequently unable to characterize a mass as benign or malignant, although it may help to narrow the differential diagnosis. Localizing a mass to one of the three mediastinal compartments also helps to limit the differential diagnosis for MRI, just as it does for CT and plain radiography.
Tissues that appear bright on T1-weighted images include fat, subacute blood products, and proteinaceous fluid as well as gadolinium-enhanced tissues. Fat- or water-suppressed T1-weighted images can help to distinguish the macroscopic fat from hemorrhagic or proteinaceous fluid unambiguously. Opposed-phase gradient-echo imaging is sensitive for detecting microscopic fat within a mass lesion such as an adrenal adenoma. On postcontrast T1-weighted images, it is incorrect to assume that all bright tissues have been enhanced. Comparison must be made with the precontrast appearance of the tissue. The rate, pattern, and degree of contrast enhancement are helpful for characterizing a tissue or mass.
Tissues that appear bright on T2-weighted images include fat, water, and many tumors. Water is ubiquitous in the human body. It is responsible for the vast majority of MR signal in nonfatty tissues, organs, masses, and so forth. Not all tissue water exhibits high T2 signal, only free water. This imprecise concept connotes water that is not bound to other substances or surfaces. Certainly watery fluid within a simple cyst qualifies as free. But intracellular water that is not appreciably bound to subcellular elements or plasma membranes can also be free. For reasons that are largely obscure, tumors often contain large amounts of free water and consequently exhibit higher T2 signal intensity than nonneoplastic tissues. Still, considerable overlap exists in the T2 appearance of neoplastic and nonneoplastic tissues. Inflamed, edematous, and necrotic tissues, for example, may appear bright on T2-weighted images. Granulation tissue may also appear bright on T2-weighted images, but unlike water, it enhances brightly.
Pathologic conditions can result in visualization of abnormal areas of lung. Newer techniques are emerging that make MRI of pulmonary parenchymal disease and pulmonary vascular abnormalities more feasible.
Patient Compatibility
Some 5% to 10% of patients are unable to complete the MRI examination because of claustrophobia. Many of these patients are helped by conscious sedation. Some patients are helped simply by a calm and reassuring radiologist or MR technologist. MRI is contraindicated in patients with cardiac pacemakers, certain types of metallic brain aneurysm clips, cochlear implants, and several other devices that either do not function or are strongly deflected by the magnetic field in the MRI scanner. Continually updated lists of MR-incompatible devices and materials are published.
Clinical Applications of Thoracic Magnetic Resonance Imaging
Anterior Mediastinum
Thyroid
Substernal thyroid masses are commonly noted as being in the anterior mediastinal compartment, but actually most are located in the pretracheal space behind the innominate vessels and thus are in the visceral compartment of the mediastinum (see Chapter 166).
The thyroid can extend caudally from the neck to a substernal location in the superior mediastinum of either the anterior or visceral compartment, the latter being the most common location. Thyroid goiters are the most common masses extending from the neck into the chest. Multiplanar MRI can demonstrate the extent of a goiter and its anatomic relationships with the trachea, esophagus, and great vessels. Goiters appear heterogeneous on T1– and T2-weighted images and are usually hypointense to normal thyroid on T1-weighted images. A multi- nodular appearance may be appreciated. Goiters frequently contain multiple cystic nodules with high T1 signal intensity, an indication that the cysts contain proteinaceous (i.e., colloid cysts) or hemorrhagic fluid. Benign goiters are well encapsulated, whereas thyroid carcinoma may show aggressive spread and regional adenopathy. The T1 and T2 appearance of a thyroid mass is not sufficiently characteristic on MRI to distinguish benign from malignant disease. Moreover, MRI does not reliably demonstrate calcifications within a thyroid mass, nor does it depict lymphangitic spread of thyroid carcinoma in the lungs.
Parathyroid
Most individuals have four parathyroid glands, arranged as upper and lower pairs at the posterior aspect of the thyroid. Fewer than four parathyroid glands exist in about 10% of the
population. Whereas the upper pair of parathyroid glands is usually orthotopic, the lower glands can be ectopic and located virtually anywhere in the mediastinum. The parathyroid glands frequently come to surgical attention because of primary hyperparathyroidism. The four most common causes of primary hyperparathyroidism, in decreasing order of frequency, are parathyroid adenomas (75%–80%), primary parathyroid hyperplasia (10%–15%), parathyroid carcinoma (<5%), and functioning parathyroid cysts (<1%).
population. Whereas the upper pair of parathyroid glands is usually orthotopic, the lower glands can be ectopic and located virtually anywhere in the mediastinum. The parathyroid glands frequently come to surgical attention because of primary hyperparathyroidism. The four most common causes of primary hyperparathyroidism, in decreasing order of frequency, are parathyroid adenomas (75%–80%), primary parathyroid hyperplasia (10%–15%), parathyroid carcinoma (<5%), and functioning parathyroid cysts (<1%).
The primary imaging modalities for the parathyroid glands are ultrasound and scintigraphy. Preoperative imaging is infrequent for surgical treatment of primary hyperparathyroidism. Recurrent or persistent hyperparathyroidism after surgical exploration of the neck suggests the presence of ectopic parathyroid tissue. In these patients, MRI or scintigraphy can help to locate an ectopic parathyroid adenoma before surgical reexploration. On MRI, ectopic parathyroid adenomas most commonly exhibit low T1 signal, high T2 signal, and avid contrast enhancement. This appearance is altered if hemorrhage is present within the adenoma. Imaging should be performed from the thyroid to the base of the heart to cover the potential locations of an ectopic gland. Although its sensitivity is high, MRI has two notable limitations: Lymph nodes can simulate ectopic parathyroid adenomas, and parathyroid carcinomas may be indistinguishable from adenomas. In clinical practice, MRI is used as a problem-solving tool when scintigraphy is inconclusive or nondiagnostic.
Thymus
The thymus gland is located in the anterosuperior mediastinum and is composed of two fused pyramidal lobes. The thymus undergoes marked changes in size and shape between childhood and adulthood but ultimately undergoes fibrofatty involution. In patients <30 years of age, the normal thymus is well depicted on T1-weighted MR images because it is outlined by mediastinal fat, which has higher signal intensity. The contrast between normal thymus and fat decreases with progressive fibrofatty involution. Thymic lesions include cysts, hyperplasia, benign (noninvasive) and malignant (invasive) thymomas, thymic carcinomas, thymic carcinoids, and thymolipomas. The thymus may also harbor lymphoma and germ cell tumors. In thymic hyperplasia, the bipyramidal architecture of the thymus is preserved. Among patients with thymoma, 50% come to clinical attention because of symptoms related to myasthenia gravis; however, only 10% to 15% of patients with myasthenia gravis have thymomas. Invasive malignant thymoma is the most common primary malignancy of the mediastinum but is much less common than metastatic disease to the mediastinum. Compared with normal thymus, thymomas demonstrate lower T1 and higher T2 signal intensity. Thymomas also disrupt the normal pyramidal thymic morphology and appear as round or multilobulated masses. The diagnosis of invasive thymoma depends on aggressive imaging features, such as gross capsular invasion, mediastinal extension, vascular encasement, regional adenopathy, and pleural metastases. Benign and invasive thymomas are not reliably distinguished on T1– and T2-weighted MR images alone. The multiplanar imaging capabilities of MRI may provide an advantage over CT in accurately depicting extraglandular extension of malignant thymoma. Thymolipomas are benign tumors composed almost entirely of fat. They can grow to a large size and envelop the pericardium. On MRI, they exhibit the characteristic high T1 and T2 signal intensity of fat.
Germ Cell Tumors
More than 80% of mediastinal germ cell tumors are benign, with most of these being dermoid cysts and benign teratomas. The malignant teratoma is the most common malignant germ cell tumor. Other less common germ cell tumors include seminomas and nonseminomatous germ cell tumors (choriocarcinomas, embryonal carcinomas, and endodermal sinus tumors). On MRI, T1 and T2 signal heterogeneity in an anterior mediastinal mass suggests the diagnosis of germ cell tumor. The high soft tissue contrast of MRI helps to identify specific components, such as cysts and fat, which are characteristic of dermoid cysts and teratomas. MRI techniques, such as fat and water suppression and opposed-phase imaging, may help to characterize the microscopic or macroscopic fat within a lesion unambiguously. MRI is also effective at characterizing cystic lesions. Simple fluid in a cyst exhibits low T1 and high T2 signal intensity, whereas complex, proteinaceous, or hemorrhagic fluid typically exhibits higher T1 and variable but generally lower T2 signal intensity. On CT, the high density of hemorrhagic or proteinaceous cysts may cause them to be mistaken for solid tumors. Gadolinium chelate–enhanced MR images reliably demonstrate solid components or mural nodules within a complex cystic lesion. MR signal intensity alone does not reliably distinguish benign from malignant teratoma. Aggressive imaging features—such as mediastinal extension, regional adenopathy, and distant metastases—are needed to support a diagnosis of malignant teratoma. Tumoral calcification, often present in dermoid cysts and teratomas, is not reliably seen on MRI and is best depicted on noncontrast CT. Multiplanar MR images may help in preoperative planning by defining the vascular relationships of mediastinal germ cell tumors.
Lymphoma
Lymphomas are malignant neoplasms of lymphoid tissue that are classified as either Hodgkin’s lymphoma or non-Hodgkin’s lymphoma. The preponderance of mediastinal lymphomas are Hodgkin’s lymphoma, and a majority of patients with Hodgkin’s lymphoma have mediastinal disease. An exception is the posterior mediastinum or paravertebral sulcus, where lymphomatous involvement almost always represents non-Hodgkin’s lymphoma. CT is the primary imaging modality for the staging and surveillance of lymphoma. However, on CT, the morphology of individual benign and malignant lymph nodes is usually indistinguishable. Massive, confluent lymphadenopathy should suggest the diagnosis of lymphoma. Serial CT examinations are used to follow regression or progression of disease as determined by changes in the size of the nodal mass. Although this approach is adequate for many patients, it has pitfalls. The chief problem is assessing disease status in the residual mediastinal mass after initiation or completion of therapy. A residual mass may contain fibrotic tissue, but no viable tumor, whereupon it is called sterilized lymphoma. Alternatively, a residual mass may contain islands or larger amounts of viable tumor. CT cannot distinguish between viable tumor and sterilized lymphoma in a residual mass that initially shows a decrease in size. Treatment failures are not
detected on CT until the residual mass enlarges, thus delaying further therapy.
detected on CT until the residual mass enlarges, thus delaying further therapy.
MRI shows promise in evaluating residual mediastinal masses after chemotherapy or radiation therapy for lymphoma. As for CT, MR evaluation of the residual mass should include an assessment of interval size change. In addition, however, several MR signal intensity patterns have predictive value for disease activity. Viable tumor contains moderate amounts of intracellular water and appears bright on T2-weighted images. In contrast, the fibrotic tissue in sterilized lymphoma contains little water and appears dark on both T1– and T2-weighted images. This simple scheme is complicated by radiation-induced inflammation and tumor necrosis, two conditions that produce high T2 signal and can be mistaken for viable tumor in the residual mass, especially during the first 6 months after therapy. If surrounding fat, which exhibits high T1 and T2 signal, is drawn into the fibrotic sterilized lymphoma, the residual mass may exhibit a complex MR appearance. However, careful comparison of the T1– and T2-weighted images often reveals whether fat or tumor is the cause of the high T2 signal. The same information can be obtained more simply with fat-suppressed T2-weighted images. In summary, low T2 signal in a shrinking residual mass indicates a good response to therapy, whereas high T2 signal more than 6 months after therapy suggests tumor recurrence. Besides T2 signal intensity, the degree of Gd contrast enhancement may also predict disease activity in a residual mass. In more recent studies, low and decreasing levels of enhancement on serial MR studies correlated with a good response to therapy, whereas high and increasing levels of enhancement correlated with tumor recurrence. The relative merits of assessing disease activity with T2 signal intensity or contrast enhancement remains to be determined. Radionuclide imaging with gallium-67 (67Ga) has also demonstrated value in detecting recurrent disease. The role of positron emission tomography (PET) is also being evaluated.
MRI and MR angiography are well suited to evaluating the relationship of mediastinal lymphoma to airways and vascular structures. Low-dose gadolinium-enhanced 3D MR venography offers a fast, noninvasive method for assessing superior mediastinal veins. Compression and thrombosis of deep veins as well as collateral venous drainage are readily depicted. The relative merits of this technique versus conventional contrast venography and duplex ultrasound remain to be determined. The multiplanar imaging capabilities of MRI can help demonstrate lymphomatous involvement of the chest wall, pleura, and pericardium. However, CT is superior for assessing lymphomatous involvement of the lung.
Middle Visceral Compartment
The visceral mediastinal compartment contains blood vessels, lymph nodes and lymphatics, the trachea and esophagus, and a variety of neural structures. The two most common pathologies in the middle compartment are lymphadenopathy and vascular lesions. Mediastinal adenopathy is either reactive or neoplastic. MRI and CT are comparably sensitive in detecting mediastinal lymph nodes. On MRI, bright mediastinal fat increases the conspicuity of lymph nodes, which are of lower signal intensity on T1-weighted images. Higher soft tissue contrast and multiplanar imaging capabilities should provide an advantage for MRI over CT in identifying lymph nodes and distinguishing them from adjacent vascular structures.
Cardiac and respiratory gating should be used routinely to decrease MR artifacts that might otherwise obscure lymph nodes. Because the spatial resolution of MRI is inferior to that of CT, MRI may incorrectly identify a cluster of small lymph nodes as a single enlarged node. Also, MRI is insensitive to nodal calcification. In patients with a contraindication to iodinated contrast agents, MRI should be the primary imaging modality for evaluating suspected mediastinal and hilar adenopathy.
Both CT and MRI use lymph node enlargement as a surrogate for pathology. Unfortunately, size is an imperfect indicator: enlarged nodes can be reactive and small nodes can be malignant. Analysis of T1 and T2 signal intensities does not improve the accuracy of MRI because there is significant overlap between benign and malignant nodes. The limitations of CT and MRI support the primacy of lymph node sampling in staging lung cancer, although cross-sectional imaging may direct the mediastinoscopist to specific enlarged lymph nodes. PET scan with fluorodeoxyglucose (FDG) uses increased metabolic activity to identify malignant lymph nodes. The exact role of this imaging modality in staging and monitoring mediastinal and hilar adenopathy remains under investigation (see Chapter 12).
Paracardiac and Intracardiac Masses
MRI is highly efficacious in demonstrating paracardiac and intracardiac masses. The most frequently encountered paracardiac masses are enlarged pericardial fat pads, pericardial cysts, and Morgagni hernias. Atrial myxoma is the most common primary intracardiac mass (50%), but it occurs much less frequently than intracardiac mural thrombus. Thymolipoma is a rare fat-containing mass that often extends to the heart. Primary paracardiac and intracardiac malignancies are rare. Mediastinal lesions such as teratoma and lymphoma may extend to a paracardiac location. Similarly, bronchial carcinomas may involve the pericardium by direct extension or through malignant adenopathy. Malignant neoplasms can also metastasize to paracardiac and intracardiac sites.
Conventional ECG-gated T1-weighted spin-echo images delineate the cardiac chambers, myocardium, epicardial fat, pericardium, and paracardiac fat and permit precise anatomic localization of mass lesions. T1– and T2-weighted MR images can define specific tissue characteristics, such as fat, hemorrhage, and cystic spaces. Cine MRI scans can demonstrate the movement of a mass relative to the heart, providing information about the site of attachment. Cine MRI may help differentiate a mobile mass such as atrial myxoma from a fixed mass such as mural thrombus. Cine images can also demonstrate compromised valve function. Postgadolinium images are useful in differentiating solid vascular masses from avascular masses such as thrombus. Although echocardiography is usually the primary imaging modality for paracardiac masses, MRI may better define the location, origin, and extent of such masses. Like other imaging modalities, however, MRI frequently fails to provide a specific tissue diagnosis.
Mediastinal Cysts
Benign cystic lesions in the mediastinum can be congenital or acquired. They include bronchogenic cysts, pericardial cysts, neurenteric cysts, meningoceles, esophageal duplication cysts,
thymic cysts, cystic hygromas, colloid cysts related to thyroid goiter, pancreatic pseudocysts, abscesses, and hematomas. Specific diagnosis requires careful evaluation of anatomic relationships and convincing evidence that the mass is cystic. Cystic mediastinal masses are often first identified on chest radiography, although their exact nature may be unknown. Noncontrast CT helps define the anatomic relationships of a cystic mass in the axial plane. Both precontrast and postcontrast CT studies are required to prove that a mass is cystic and does not enhance. CT findings can be equivocal when the cyst contents are hyperdense on precontrast images.
thymic cysts, cystic hygromas, colloid cysts related to thyroid goiter, pancreatic pseudocysts, abscesses, and hematomas. Specific diagnosis requires careful evaluation of anatomic relationships and convincing evidence that the mass is cystic. Cystic mediastinal masses are often first identified on chest radiography, although their exact nature may be unknown. Noncontrast CT helps define the anatomic relationships of a cystic mass in the axial plane. Both precontrast and postcontrast CT studies are required to prove that a mass is cystic and does not enhance. CT findings can be equivocal when the cyst contents are hyperdense on precontrast images.
MRI is used primarily as a problem-solving tool when the CT is equivocal. However, MRI should be the primary imaging modality in patients with a contraindication to iodinated contrast material. Multiplanar MR images superbly depict the anatomic relationships of a cystic mediastinal mass. This information helps narrow the differential diagnosis. T1– and T2-weighted images confirm the cystic nature of most lesions and also characterize the cyst contents.
For problematic complex cysts, gadolinium-enhanced MRI, sometimes in several imaging planes, can be used to exclude the presence of solid enhancing tissue within a cyst, a feature that portends malignancy. However, even simple benign cysts often demonstrate a thin, smooth rim of enhancement within the cyst wall. Bronchogenic cysts are either intrapulmonary or mediastinal, the latter being more common. Mediastinal bronchogenic cysts are generally located near the carina but do not communicate with the bronchial tree. They are usually asymptomatic unless they compress critical adjacent structures such as airways or blood vessels. The cyst contents can vary from serous to proteinaceous and may contain blood products from prior hemorrhage. Serous fluid exhibits low T1 signal, whereas hemorrhagic, proteinaceous, or mucinous fluid exhibits intermediate to high T1 signal (Fig. 11-2). Enteric duplication cysts are usually posterior lesions that abut the esophagus or reside within the esophageal wall. Location provides the key to the correct diagnosis. Neurenteric cysts and meningoceles are also paraspinal posterior mediastinal lesions. Their diagnosis is suggested by associated vertebral anomalies. The cerebrospinal fluid in a meningocele appears similar to pure water on MRI, exhibiting low T1 and high T2 signal intensity.
Posterior Compartment: Paravertebral Space
The abundance of paravertebral neural tissue explains the high frequency of neurogenic tumors in the paravertebral spaces. These tumors are classified according to the nerve of origin: neurofibromas, schwannomas, and malignant peripheral nerve sheath tumors from peripheral nerves; ganglioneuromas, neuroblastomas, and ganglioneuroblastomas from sympathetic nerves; and paragangliomas and pheochromocytomas from neuroectodermal cells closely associated with autonomic nerves. Other paravertebral masses include paraspinal abscesses, commonly related to tuberculosis; lymphoma, usually non-Hodgkin’s lymphoma; extramedullary hematopoiesis; and primary and metastatic vertebral body neoplasms.
Neurofibromas can be intradural, extradural, or both, in which case they often assume a dumbbell shape and expand the neural foramina. Multiplanar MRI delineates the extent of tumor and depicts compression of adjacent soft tissue structures. CT is superior to MRI at depicting bony erosions. On MRI, nerve sheath tumors exhibit low to intermediate T1 signal, high T2 signal, and marked contrast enhancement. MRI does not reliably distinguish benign from malignant tumors. Imaging features that usually connote a benign etiology, such as well-defined borders, are not helpful: plexiform neurofibromas have an aggressive, invasive appearance, whereas early peripheral nerve sheath tumors can have a nonaggressive appearance. Of course regional adenopathy and distant metastases would suggest the malignant nature of an otherwise indeterminate mass.
Lymphoma in the posterior mediastinum can encase the aorta and mimic an aortic dissection or aneurysm. Periaortic lymphoma is further suggested by a mass interposed between the vertebra and aorta as well as adenopathy in other locations. These imaging features, although suggestive, are not diagnostic. Careful evaluation of aortic morphology on precontrast and postcontrast images may provide a clue to the correct diagnosis.
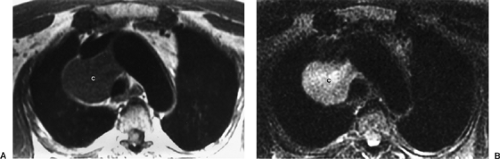 Figure 11-2. Bronchogenic cyst. Axial ECG-gated T1-weighted spin-echo (A) and T2-weighted fast spin echo (B) MR images demonstrate a smooth, well-marginated cystic mass (c) in the right paratracheal space. The contents of the mass did not enhance (not shown). |
Ten percent of pheochromocytomas are extra-adrenal, and 1% are located in the mediastinum, most commonly in the paravertebral sympathetic nerves. Another rare site for this tumor is the pericardium, particularly near the aortopulmonary window (see Chapter 191). Mediastinal pheochromocytomas can be difficult to detect. The primary imaging modality for tumor localization is the iodine 131 (131I) metaiodobenzylguanidine scan. Although these scans have high sensitivity and specificity, they suffer from low anatomic resolution. MRI can be used as an adjunct, providing more precise anatomic localization of lesions identified on 131I-metaiodobenzylguanidine scans. Pheochromocytomas are often highly conspicuous on MRI because they exhibit high T2 signal and marked contrast enhancement. However, intratumoral hemorrhage can change the classic MR appearance.
Thoracic Aorta
In many institutions, MRI is becoming the modality of choice for evaluating thoracic aortic aneurysm and dissection. The standard MR examination of the thoracic aorta varies considerably according to institutional preferences. At our hospital, the MRI consists of an axial ECG-gated T1-weighted spin-echo sequence, an axial cine gradient-echo sequence, a gadolinium-enhanced 3D MR angiogram, and a postcontrast axial T1-weighted sequence. The spin-echo sequence provides black-blood MR angiography and a survey of thoracic soft tissues. Cine MRI helps identify the intimal flap in aortic dissection, presence of flow in the true and false lumina, and aortic valvular insufficiency. Gadolinium-enhanced 3D MR angiography assesses the presence and full extent of aneurysm or dissection and branch vessel involvement. Postcontrast axial images provide a second opportunity to evaluate thoracic soft tissues, identify the true outer wall of an aneurysmal vessel, and reveal active contrast extravasation from a ruptured aneurysm, pseudoaneurysm, or dissection.
The thoracic aorta is an elastic artery composed of an intima, media, and adventitia. The intima is covered with a thin layer of endothelial cells that contact blood flowing in the vessel lumen. The media contains vascular smooth muscle cells and elastin fibers. The adventitia is a layer of loose connective tissue that contains blood vessels (the vasa vasorum) and nerves. The vasa vasorum enhances and is easily identified on delayed postcontrast MR images, allowing accurate identification of the true outer wall. This is particularly helpful when the vessel lumen and true outer wall are separated by atherosclerotic plaque or mural thrombus.
Congenital anomalies of the aorta include variations in the branching of the great vessels. These anomalies are frequently asymptomatic and discovered incidentally on imaging studies. A common variant is a two-vessel aortic arch with a common trunk supplying the brachiocephalic and left common carotid arteries (bovine arch). Another common variant is a left vertebral artery, which takes origin directly from the aortic arch at a site between the origins of the left common carotid and left subclavian arteries (Fig. 11-3).
Stay updated, free articles. Join our Telegram channel

Full access? Get Clinical Tree


