Fig. 37.2 An ECG in a patient with a K+ of 2.2 mmol/L. Sinus bradycardia, heart rate 48 b/min. Unremarkable P wave and PR interval. QRS unremarkable. T waves are very flat throughout the ECG. The ECG returned to normal with correction of the K+ level.
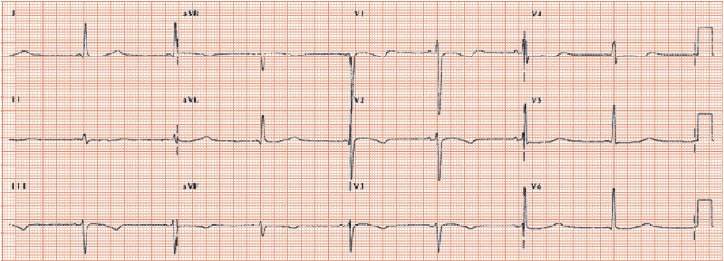
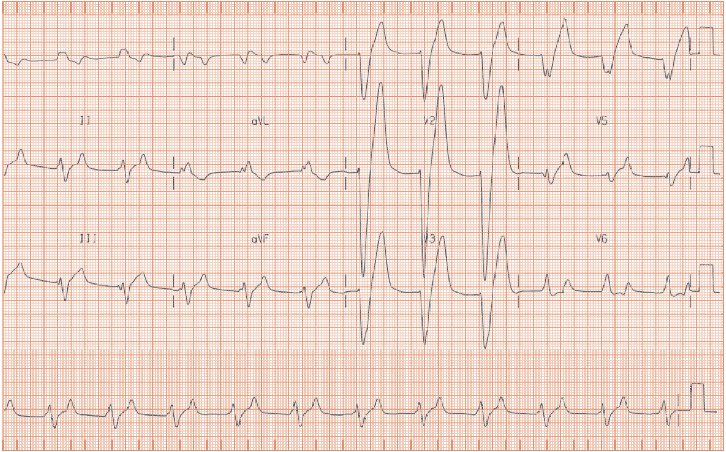
Fig. 37.3 A patient with a K+ of 7.8 mmol/L. Regular rhythm, though the P waves cannot be seen. Broad QRS, looking rather like left bundle branch block. Very tall T waves, especially in leads V1–4, where they are ‘peaked’, and are the largest part of the waveform. The ECG returned to normal with correction of the K+.
Electrolytes and the ECG
The ECG manifestations of hypokalaemia (Figs 37.1 and 37.2) are:
- Flattened ST/T waves.
- Prominent U waves.
- QT interval prolongation, particularly if the QT is already prolonged, e.g. in those with left ventricular dysfunction. K+ supplementation in such patients shortens the QT interval.
- Low serum K+ levels can provoke atrial fibrillation.
- Ventricular arrhythmias: in some patients low K+ levels are critical in promoting dangerous ventricular arrhythmias. Those at risk include: (i) those with structural heart disease, especially those forms themselves associated with QT interval prolongation (mainly those with heart failure); (ii) drugs that prolong the QT interval (often by blocking the human ether-a-go-go (HERG)-related repolarizing K+

Stay updated, free articles. Join our Telegram channel

Full access? Get Clinical Tree


