Right ventricular (RV) pacing has been linked with lead-induced tricuspid regurgitation (TR), left ventricular (LV) dysfunction, and dyssynchrony, but the effect of pacing on RV function is unclear. We sought to investigate the effect of pacing on RV synchrony, RV function, and TR, and their association with LV function. In this substudy of the PROTECT-PACE (Protection of left ventricular function during right ventricular pacing) study of the effects of RV pacing in patients with preserved ejection fraction, 145 patients (76 RV apex and 69 non-RV apex pacing) had measurable RV parameters. We assessed tricuspid annular plane systolic excursion (TAPSE), time difference between peak TAPSE and peak mitral annular plane systolic excursion (TM-APSE-dif), global LV longitudinal strain, E/e’, TR vena contracta, and TR peak gradient. Echocardiography was performed just after implantation and at 2 years. TR parameters significantly worsened after 2 years, but pacing site was not associated with changes in RV and TR parameters. No temporal change in TAPSE and TM-APSE-dif was observed overall, but worsening of TM-APSE-dif was associated with worsening TAPSE. Global longitudinal strain and E/e’ both deteriorated over 2 years; these changes were significantly associated. In a multivariate regression, worsening global longitudinal strain and worsening TM-APSE-dif were significantly associated with deterioration of TAPSE. Furthermore, increased E/e’ and its deterioration were associated with worsening TR vena contracta and TR peak gradient, respectively. Decreased TAPSE was also associated with deterioration of TR vena contracta. In conclusion, RV pacing appears to worsen TR, an effect which might be caused by elevated LV filling pressure due to LV dysfunction. In this study, RV pacing did not affect RV function during 2-year follow-up, but such an effect might occur if RV dyssynchrony or LV dysfunction occurred after pacing. The effect of RV pacing site on RV and TR mechanics was minor.
Long-term right ventricular (RV) pacing (especially RV apex pacing) induces left ventricular (LV) dyssynchrony and may cause LV systolic function, which adversely affects prognosis. Data assessing the effect of cardiac pacing on RV function and dyssynchrony are limited, although LV function could be affected by RV function and vice versa because the LV and RV are intimately associated not only through hemodynamics but also through fibers that encircle both ventricles. In addition, lead-associated tricuspid regurgitation (TR) has been associated with RV dysfunction and RV failure. The recent association of lead position relative to the tricuspid valve and the degree of TR suggests that lead tip location might affect the degree of TR through influencing the course of the RV lead across the valve. Despite these possible associations, information on the association between lead-induced TR or the impact of pacing site on the temporal change of RV function after the initiation of cardiac pacing is limited. The recently published protection of left ventricular function during right ventricular pacing (PROTECT-PACE) study was the largest international, multicenter, randomized, controlled study assessing the RV pacing site (“RV apex” vs “RV high septum”) on LV function. We used these data to investigate the effect of RV pacing and pacing site on RV function, RV synchrony, and TR, and their association with LV function.
Methods
This substudy of the PROTECT-PACE Study ( ClinicalTrials.gov number NCT00461734 ) addressed RV function and TR. The study was approved by the Human Research Ethics Committees of participating centers in Australia and New Zealand, and the Research Ethics Service Committee East Midlands–Nottingham, United Kingdom, and was conducted in compliance with the Declaration of Helsinki. All patients provided written informed consent.
Patients were included if they were aged ≥18 years, with persistent high-grade atrioventricular block (defined as 2:1 atrioventricular block or higher) and sinus rhythm, and scheduled to undergo dual-chamber pacemaker implantation. The main exclusions have been previously described including intermittent atrioventricular block, implantable cardioverter defibrillator or cardiac resynchronization therapy, patients in whom an RV lead could not be placed, junctional ablation, myocardial infarction, valve replacement or bypass surgery within 3 months before enrollment, significant valvular heart disease, or known paroxysmal atrial fibrillation. If pacemaker interrogation revealed <90% ventricular pacing at the 6-week postimplant visit, the patient was withdrawn from the study to ensure as close as possible to consistent pacing throughout the study.
Two hundred forty patients in PROTECT-PACE study were randomly divided into an RV apex pacing group (n = 120) and RV high-septum pacing group (n = 120). Of these patients, 72 patients (RV apex: n = 35, RV high septum: n = 37) were excluded mainly because of failure to meet the percentage ventricular pacing criteria, death, and missing data during 2-year follow-up. Of the remaining 168 patients, 23 patients (RV apex: n = 13, RV high septum: n = 10) were excluded because of inadequate image quality to assess myocardial mechanics, permitting analysis in this study of 145 patients.
Patient data were collected at predischarge. Device data, including percentage of ventricular pacing and atrial tachyarrhythmia counters, were collected at 6 weeks and 6, 12, 18, and 24 months.
Final lead tip position was confirmed at the independent lead adjudication core laboratory (the Universities of Birmingham, UK, and Melbourne, Australia). Lead positions were reviewed according to standard criteria.
Echocardiographic data at predischarge (just after the implantation) and 2 years were analyzed. Data at enrollment (just before the implantation) were used to exclude patients with severe TR. LV and RV mechanics were not assessed on these echocardiograms because of confounders for functional analysis such as severe bradycardia with escape beats due to atrioventricular block. Transthoracic echocardiography was performed by experienced sonographers using a commercially available ultrasound machine (Vivid 7; GE Vingmed, Horten, Norway, i.e., 33; Philips Medical Systems, Andover, Massachusetts). Follow-up echocardiographic examinations were performed using the same machine. Most studies were performed on the Vivid 7 (93%). Readers performing echocardiographic analyses were blinded to the patients’ clinical data including pacing site. Conventional echo data were analyzed at University of Queensland, and LV and RV mechanics were analyzed at Menzies Institute for Medical Research. Conventional echocardiographic parameters were measured according to the recommendations of the American Society of Echocardiography. The early diastolic mitral annular tissue velocity (e’) was measured in the apical 4-chamber view with the sample volume positioned at both the septal and lateral mitral annulus and being the average of these 2 values. The combined assessment of transmitral early diastolic velocity (E) and e’ was used to calculate E/e’ as the surrogate marker of LV filling pressure.
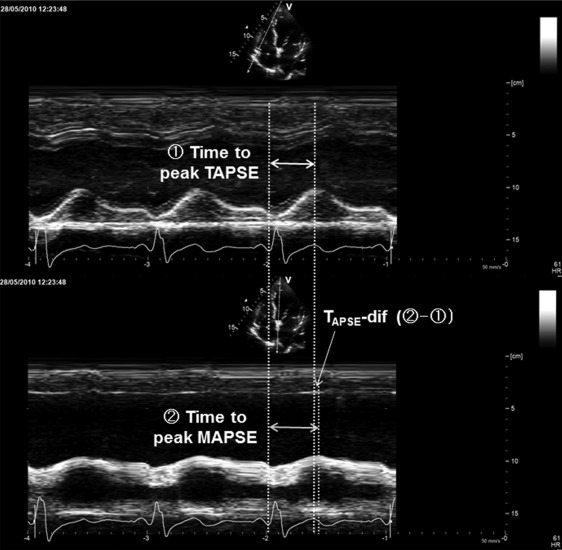
Assessment of RV function was performed in accordance with the current guidelines of the American Society of Echocardiography. RV systolic function was evaluated using tricuspid annular plane systolic excursion (TAPSE). TAPSE was acquired in a standard apical 4-chamber window, as the distance of systolic excursion of the RV annular segment along its longitudinal plane. Similarly, mitral annular plane systolic excursion (MAPSE) at a septal segment was also measured using the same plane. As a surrogate marker of RV dyssynchrony, we measured time difference from time to peak MAPSE to time to peak TAPSE and (TM-APSE-dif; Figure 1 ). Time to peak annular plane systolic excursion was defined as the interval from Q-wave onset to peak annular plane systolic excursion throughout the cardiac cycle.
TR severity was evaluated by semiquantitative visual grading (0: none, 1: trace, 2: mild, 3: moderate to severe) and the vena contracta width in either the RV inflow view or the apical 4-chamber view, following the guideline and previous reports. In patients with no or trace TR, TR vena contracta was considered to be 0 for purposes of statistical analysis. The peak pressure gradient between RV and right atrium was also measured on the TR spectral continuous-wave Doppler signal.
Global LV longitudinal strain was measured on raw data using offline speckle-tracking analysis with the dedicated software (EchoPAC PC BT11, GE Healthcare; and QLAB version 9.1, Philips Medical Systems). Global longitudinal strain was obtained by averaging all 18 segment strain values from 3 apical views. The mean frame rate for global longitudinal strain analysis at baseline was 61 ± 18 frames/s.
Atrioventricular conduction was also assessed using a previously reported scoring system. The patient was assigned 2 points for a severe problem in atrioventricular synchrony (evidenced by diastolic mitral regurgitation or clearly truncated mitral A waves). The patient was assigned 1 point for a mild problem of atrioventricular synchrony, evidenced by E/A ≥1 with left atrial volume index ≥34 ml/m 2 or mitral E and A wave fusion. The patient was assigned 0 point if atrioventricular timing was surmised as being optimized (i.e., E/A <1 or E/A ≥1 with left atrial volume index <34 ml/m 2 ).
Data are expressed as mean ± standard deviation or median (interquartile range [IQR]) or number (percentage). The changes in study parameters were calculated as absolute value at 2 years and absolute value at baseline. Overall missing data were <5%. Interobserver and intraobserver variabilities were examined for TAPSE, TM-APSE-dif, TR visual grading, TR vena contracta, and global longitudinal strain using the intraclass and interclass correlation coefficients and the κ statistic. Measurements were performed in a group of 10 randomly selected subjects by 1 observer then repeated on a separate day by 2 observers. The significance of differences between the groups was assessed using the Student t test or the Mann–Whitney U test, according to distribution of the data. For categorical variables, the chi-square test or Fisher’s exact test was used, as appropriate. The comparison of the repeated measurements was carried out using the paired t test, Wilcoxon signed-rank test, or McNemar test, as appropriate. Univariate and multivariate linear regression analyses were used to evaluate the associations between the study parameters. Univariate quadratic regression analysis was also used to evaluate the associations between delta TM-APSE-dif and delta TAPSE. Delta TM-APSE-dif, which could be caused by either delay of RV free wall contraction (through RV dysfunction) or delay of interventricular wall contraction (through non-RV high-septum pacing), was classified into 2 groups (second tertile [no change] versus first tertile and third tertile [deterioration]) based on the intertertile ranges.
Statistical analysis was performed using a standard statistical software package (SPSS software 20.0, SPSS Inc., Chicago, Illinois), and statistical significance was defined by p <0.05.
Results
Of all 145 patients, 72 (50%) were randomly assigned to RV apex pacing, and the remaining 73 were assigned to RV high-septum pacing. In the actual final lead position, 76 (52%) were paced in the RV apex and the remaining 69 were paced in a non-RV apex position (54 in the RV high septum). At 2 years, the percentage of the ventricular pacing was around 95% in both pacing groups. The clinical characteristics are summarized in Table 1 . There was no significant difference in the clinical parameters between RV apex and non-RV apex groups. There was no significant difference in any LV functional parameters at baseline. The changes in echocardiographic parameters are provided in Table 2 . LV ejection fraction, MAPSE, and global longitudinal strain significantly decreased, and E/e’ was significantly increased after 2 years in overall, non-RV apex pacing, and RV apex pacing groups. Delta E/e’ was significantly associated with delta global longitudinal strain (β = −0.27, 95% confidence interval [CI], −0.64 to −0.16, p <0.01), even after adjustment for clinical variables ( Supplementary Table 1 ).
| Variables | Overall (n = 145) | Non-RV apex pacing (n = 69) | RV apex pacing (n = 76) | p Value |
|---|---|---|---|---|
| Age (years) | 75 (68-80) | 76 (70-81) | 75 (69-80) | 0.46 |
| Men | 97 (67%) | 50 (74%) | 47 (62%) | 0.14 |
| Body mass index (kg/m 2 ) | 27.5 (24.2-30.1) | 27.5 (23.9-29.7) | 27.5 (24.4-31.0) | 0.29 |
| Body surface area (m 2 ) | 1.90±0.21 | 1.89±0.21 | 1.90±0.21 | 0.97 |
| Systolic blood pressure (mmHg) | 142 (130-163) | 140 (128-161) | 146 (130-166) | 0.39 |
| Diastolic blood pressure (mmHg) | 69±14 | 69±13 | 69±14 | 0.80 |
| Hypertension | 83 (58%) | 36 (53%) | 47 (62%) | 0.28 |
| Diabetes mellitus | 31 (21%) | 14 (20%) | 17 (22%) | 0.76 |
| Coronary heart disease | 37 (26%) | 21 (31%) | 16 (21%) | 0.18 |
| Stroke | 5 (4%) | 3 (4%) | 3 (4%) | 0.43 |
| Atrial fibrillation during follow-up | 29 (20%) | 13 (19%) | 16 (21%) | 0.74 |
| Variables | Overall (n = 145) | p Value | Non-RV apex pacing(n = 69) | p Value | RV apex pacing (n = 76) | p Value | p Value (RV apex pacing vs non-RV apex pacing) | ||||
|---|---|---|---|---|---|---|---|---|---|---|---|
| Baseline | 2-year | Baseline | 2-year | Baseline | 2-year | Base-line | 2-year | ||||
| LV function parameters | |||||||||||
| Ejection fraction (%) | 57 (51-63) | 54 (49-61) | <0.01 | 58 (50-62) | 55 (49-62) | 0.01 | 57 (52-63) | 54 (49-60) | <0.01 | 0.90 | 0.83 |
| e’ (cm/s) | 5.5 (4.5-6.7) | 5.3 (4.4-6.4) | 0.17 | 5.7 (4.6-6.7) | 5.6 (4.4-6.6) | 0.4 | 5.3 (4.3-6.5) | 5.1 (4.3-6.0) | 0.28 | 0.28 | 0.16 |
| E/e’ | 12.5 (10.0-15.9) | 14.2 (10.7-16.9) | <0.01 | 12.9 (10.1-16.3) | 14.5 (10.9-16.6) | <0.01 | 12.1 (9.7-15.7) | 14.5 (10.9-16.6) | 0.03 | 0.46 | 0.87 |
| MAPSE (cm) | 1.0(0.8-1.2) | 0.9(0.8-1.1) | <0.01 | 1.0(0.8-1.2) | 1.0(0.7-1.2) | <0.01 | 1.0(0.8-1.2) | 0.9(0.8-1.1) | 0.02 | 0.86 | 0.81 |
| Time to peak MAPSE (ms) | 390(350-450) | 390(360-440) | 0.44 | 390(345-460) | 410(368-445) | 0.07 | 390(350-440) | 390(360-420) | 0.49 | 0.89 | 0.22 |
| Global longitudinal strain (%) | -16.2±4.4 | -14.7±4.4 | <0.01 | -16.3±4.6 | -15.5±4.6 | 0.05 | -15.7±3.7 | -13.9±4.1 | <0.01 | 0.37 | 0.02 |
| Atrioventricular optimization score (0/1/2) | 109/36/0 (75%/25%/0%) | 107/38/0 (74%/26%/0%) | 0.85 | 47/22/0 (68%/32%/0%) | 49/20/0 (71%/29%/0%) | 0.77 | 62/14/0 (82%/18%/0%) | 58/18/0 (76%/24%/0%) | 0.45 | 0.08 | 0.47 |
| RV function parameters | |||||||||||
| TAPSE (cm) | 2.0(1.7-2.4) | 2.0(1.6-2.4) | 0.36 | 2.1(1.7-2.4) | 1.9(1.6-2.4) | 0.06 | 2.0(1.7-2.4) | 2.0(1.6-2.4) | 0.61 | 0.54 | 0.33 |
| Time to peak TAPSE (ms) | 380(350-420) | 400(360-430) | 0.14 | 390(350-415) | 400(368-426) | 0.25 | 380(338-430) | 395(353-430) | 0.35 | 0.95 | 0.97 |
| TM-APSE-dif (ms) | 10(-30-60) | 0(-30-50) | 0.32 | 10(-25-75) | 20(-20-60) | 0.88 | 10(-25-60) | -5(-30-30) | 0.19 | 0.60 | 0.06 |
| TR function parameters | |||||||||||
| Visual TR grading (None/Trace/Mild/Moderate to Severe) | 36/43/57/9 (25%/30%/39%/6%) | 32/37/60/16 (22%/26%/41%/11%) | <0.01 | 19/20/27/3 (28%/29%/39%/4%) | 19/17/26/7 (28%/25%/37%/10%) | 0.14 | 17/23/30/6 (22%/31%/39%/8%) | 13/20/34/9 (17%/26%/45%/12%) | 0.09 | 0.63 | 0.43 |
| TR vena contracta (mm) | 0(0-3) | 2(0-3) | 0.02 | 0(0-3) | 0(0-3) | 0.06 | 0(0-3) | 2(0-3) | 0.20 | 0.43 | 0.75 |
| TR peak gradient (mmHg) | 12(1-21) | 15(3-23) | 0.04 | 8(1-23) | 15(2-25) | 0.19 | 13(2-20) | 16(4-22) | 0.09 | 0.85 | 0.74 |
TAPSE and TM-APSE-dif did not change over 2 years. Also, delta TAPSE (−0.1 cm, IQR −0.2 to 0.3 versus −0.1 cm, IQR −0.4 to 0.2, p = 0.09) and delta TM-APSE-dif (−10 ms, IQR −50 to 30 vs 0 ms, IQR −40 to 0, p = 0.48) were not significantly different between pacing sites. Delta TM-APSE-dif showed a quadratic ( r 2 = 0.06, p = 0.04) but not a linear relation with delta TAPSE ( r 2 < 0.01, p = 0.81; Figure 2 ). When the patients were classified into groups on the basis of the degree of delta TM-APSE-dif using intertertile range, the group with the deterioration of RV dyssynchrony (≤−20 or ≥40 ms: delta TM-APSE-dif) had significantly worse TAPSE than that with no change of RV dyssynchrony (−0.2, IQR −0.3 to 0.2 vs 0.1, IQR −0.2 to 0.3, p = 0.01). Similarly, when the patients were classified using another cutoff (≤−50 or ≥50 ms: delta TM-APSE-dif), the result was same (−0.2, IQR −0.5 to 0.1 vs 0.0, IQR −0.2 to 0.3, p = 0.03).
Although average TAPSE did not worsen over 2 years, delta TAPSE was significantly associated with delta MAPSE (β = 0.33, 95% CI 0.06 to 0.61, p = 0.02) and delta global longitudinal strain (β = 0.03, 95% CI 0.01 to 0.05, p = 0.01) but not RV lead location. In the multivariate linear regression analysis, the magnitude of RV dyssynchrony and deterioration of global longitudinal strain were significantly associated with worsening TAPSE ( Table 3 ).
| Variables | Model Adjusted R-square=0.17 | ||||
|---|---|---|---|---|---|
| ß | ß Standardized | 95% CI Lower | 95% CI Upper | p Value | |
| Age | 0.00 | -0.04 | -0.01 | 0.01 | 0.72 |
| Male | 0.12 | 0.12 | -0.07 | 0.31 | 0.20 |
| Diabetes | 0.06 | 0.05 | -0.16 | 0.27 | 0.60 |
| Delta E/e’ | 0.00 | -0.04 | -0.02 | 0.02 | 0.69 |
| Delta global longitudinal strain | 0.03 | 0.20 | 0.00 | 0.05 | 0.04 |
| Deteriorated TM-APSE-dif group | -0.19 | -0.20 | -0.38 | -0.01 | 0.04 |
Stay updated, free articles. Join our Telegram channel

Full access? Get Clinical Tree


