With the rapid advance of transcatheter aortic valve implantation (TAVI), it is important to evaluate the relationship between TAVI volumes and outcomes. The aim of this study was to analyze in-hospital outcomes after TAVI stratified according to hospital volumes. Using the National Inpatient Sample files from 2012, hospitals performing transfemoral (TF)-TAVI and transapical (TA)-TAVI were divided into high-volume and low-volume centers. A total of 7,660 patients underwent TAVI in 256 hospitals in 2012. In the TF-TAVI cohort, multivariate logistic regression analyses demonstrated that low TF-TAVI volume status was an independent predictor of death and bleeding. In the TA-TAVI cohort, low volume status was a predictor of death, myocardial infarction, and need for permanent pacemaker. In addition, hospitals that performed low TA-TAVI volume were associated with significantly higher rate of death after surgical aortic valve replacement in comparison with the hospitals that perform high TA-TAVI volume (3.6% vs 2.3%, p <0.001). In conclusion, centers with lower volume of TAVI had more frequent adverse events compared with higher volume centers.
Previous studies have demonstrated a clear relation between the volume and outcomes with various surgical procedures. Higher volume centers have been shown to have better outcomes than low-volume institutions in a variety of cardiovascular surgical procedures, including coronary artery bypass grafting, carotid endarterectomy, heart transplantation, and repair of acute aortic dissection. With the rapid advance of transcatheter aortic valve implantation (TAVI) utilization and changing landscape of management of severe aortic stenosis in patients at high risk, it is important to evaluate the relation between TAVI volumes and patient outcomes. Given the lack of data regarding TAVI volumes and postprocedural outcomes, we analyzed in-hospital outcomes after TAVI stratified according to hospital volumes.
Methods
Data were obtained from the Agency for Healthcare Research and Quality Healthcare Cost and Utilization Project–National Inpatient Sample (NIS) files from 2012. The NIS is a 20% sample of all discharged from nonfederal US hospitals. In 2012, NIS contained deidentified information for 36,484,846 discharges from 4,378 hospitals and 44 states. Discharges are weighted based on the sampling scheme to permit inferences for a nationally representative population. Each record in the NIS includes all procedure and diagnosis International Classification of Diseases (ICD) codes recorded for each patient’s hospital discharge.
Hospitalizations identifying aortic valve replacement were selected using the respective ICD-9-CM procedure codes for surgical aortic valve replacement (SAVR; 35.21 and 35.22), transapical (TA)-TAVI (35.06), and transfemoral (TF)-TAVI (35.05) in any of the 15 procedure fields. Patient-level and hospital-level variables were included as baseline characteristics. Hospital-level data elements are derived from the American Heart Association Annual Survey Database. The Agency for Healthcare Research and Quality co-morbidity measures based on the Elixhauser methods were used to identify co-morbid conditions. In-hospital patient-level end points were determined from ICD-9 billing codes in the NIS database. The primary outcome measures were in-hospital all-cause mortality, stroke, vascular complications, bleeding, acute renal failure, myocardial infarction (MI), and permanent pacemaker (PPM) implantation. In-hospital MIs were identified by the ICD-9 codes 410.0-410.9. Stroke was identified ICD-9 codes 997.02, 362.31, 368.12, 781.4, 433.11, 435, 434. Vascular complications were identified by ICD-9 codes 997.2, 996.1, and 997.7. Major bleeding was identified by ICD-9 codes 430 to 432, 578.X, 719.1X, 423.0, 599.7, 626.2, 626.6, 626.8, 627.0, 627.1, 786.3, 784.7, and 459.0. Acute renal failure was identified by ICD-9 code 584. Need for PPM was identified by ICD-9-CM diagnosis code 37.8.
Hospitals performing TF-TAVI and TA-TAVI were divided into high-volume and low-volume centers by volume of procedures performed in 2012, using the median number of TF-TAVI (20 cases) and TA-TAVI (10 cases) cases as the cutoff. We compared baseline characteristics and hospital characteristics between the TF-TAVI and TA-TAVI stratified by hospital volume for the entire unmatched 2012 NIS cohort of patients. Continuous variables are presented as medians; categorical variables are expressed as frequencies (percentages). To compare baseline characteristics, in-hospital care patterns, and outcomes after TAVI, Mann–Whitney Wilcoxon nonparametric tests were used for continuous variables and Pearson chi-square tests were used for categorical variables.
Unadjusted in-hospital outcome rates were calculated in the subgroups of patients in the high-volume versus low-volume hospitals who underwent TF-TAVI and TA-TAVI. Multivariable logistic regression analyses were used to compare outcomes between high-volume and low-volume hospitals adjusting for other potential predictors that had significant univariate association with outcomes (p <0.05). For all regression analyses, the Taylor linearization method “with replacement” design was used to compute variances. All the analyses were conducted using SAS, version 9.2 (SAS Institute, Cary, North Carolina) and SPSS, version 20 (IBM corporation).
Results
Of 36,484,846 discharge records reviewed in 2012 in the NIS data set, 7,660 patients underwent TAVI. Overall, 256 hospitals performed TAVI in 2012 with a range from 5 to 255 cases (median of 20 and mean of 29.8 cases). TF-TAVI was performed in 221 hospitals (range of 5 to 240 cases), and TA-TAVI was performed in 117 hospitals (range of 5 to 60 cases). Table 1 demonstrates the baseline characteristics of patients who underwent TF- and TA-TAVI stratified by hospital volume. Patients who underwent TF-TAVI at high-volume centers were more likely to have a history of diabetes, previous percutaneous coronary interventions, previous coronary artery bypass graft surgery, chronic renal failure, neurologic disorder, and obesity. Patients who underwent TA-TAVI at high-volume centers were more likely to be older, have history of previous percutaneous coronary interventions, previous coronary artery bypass graft surgery, chronic obstructive pulmonary disease, renal failure, and peripheral vascular disease.
| Characteristic | High Volume TF (N = 5,685) | Low Volume TF (N = 775) | p-value | High Volume TA (N = 610) | Low Volume TA (N = 590) | p-value |
|---|---|---|---|---|---|---|
| Mean age ± SD (years) | 81.4 ± 8.5 | 82.0 ± 9.3 | 0.10 | 81.1 ± 8.0 | 75.5 ± 11.6 | <0.001 |
| Elective Admission | 75.4% | 67.7% | <0.001 | 78.7% | 77.8% | 0.73 |
| Female sex | 47.3% | 52.9% | 0.004 | 49.2% | 59.3% | 0.001 |
| Anemia | 26.8% | 27.7% | 0.61 | 23.0% | 20.3% | 0.29 |
| Collagen vascular disorder | 5.4% | 5.8% | 0.61 | 3.3% | 4.2% | 0.45 |
| Hypertension | 78.7% | 82.6% | 0.01 | 81.1% | 81.4% | 0.94 |
| Diabetes, uncomplicated | 30.3% | 18.7% | <0.001 | 29.5% | 28.8% | 0.80 |
| Diabetes, complicated | 4.4% | 4.4% | 0.85 | 4.1% | 5.1% | 0.49 |
| Previous PCI | 18.6% | 12.3% | <0.001 | 18.0% | 9.3% | <0.001 |
| Previous CABG | 23.2% | 15.5% | <0.001 | 22.1% | 14.4% | 0.001 |
| Coagulopathy | 23.9% | 28.4% | 0.008 | 28.7% | 24.6% | 0.12 |
| Chronic pulmonary disease | 33.7% | 32.9% | 0.69 | 41.8% | 28.0% | <0.001 |
| Renal Dialysis | 1.8% | 0% | <0.001 | 0% | 0.8% | 0.03 |
| Chronic renal failure | 36.9% | 26.5% | <0.001 | 36.1% | 22.0% | <0.001 |
| Liver disease | 2.9% | 1.9% | 0.13 | 1.6% | 0.8% | 0.30 |
| Neurological disorder | 7.1% | 5.2% | 0.04 | 7.4% | 4.2% | 0.03 |
| Peripheral vascular disease | 29.9% | 29.0% | 0.65 | 43.4% | 33.9% | 0.001 |
| Pulmonary circulation disorder | 0.5% | 0.6% | 0.60 | 0% | 0% | NS |
| Obesity | 14.3% | 10.3% | 0.002 | 10.7% | 14.4% | 0.06 |
| Race | <0.001 | <0.001 | ||||
| White | 84.6% | 85.8% | 82.0% | 78.7% | ||
| Black | 3.9% | 5.4% | 0.9% | 0.9% | ||
| Hispanic | 3.9% | 2.7% | 6.3% | 11.1% | ||
| Payer | 0.009 | <0.001 | ||||
| Medicare | 91.2% | 88.4% | 91.8% | 73.7% | ||
| Medicaid | 0.8% | 1.9% | 0.8% | 2.5% | ||
| Private | 6.7% | 7.7% | 5.7% | 18.6% | ||
| Bedsize | <0.001 | 0.005 | ||||
| Small | 4.6% | 3.2% | 5.7% | 3.4% | ||
| Medium | 13.0% | 19.4% | 10.7% | 16.1% | ||
| Large | 82.4% | 77.4% | 83.6% | 80.5% | ||
| Region | 0.004 | <0.001 | ||||
| Northeast | 23.8% | 18.1% | 24.6% | 13.6% | ||
| Midwest | 21.5% | 24.5% | 26.2% | 17.8% | ||
| South | 35.1% | 36.8% | 32.0% | 43.2% | ||
| West | 19.5% | 20.6% | 17.2% | 25.4% | ||
| Teaching | <0.001 | <0.001 | ||||
| Rural | 0.4% | 1.9% | 0% | 0.8% | ||
| Urban nonteaching | 8.4% | 25.8% | 3.3% | 25.4% | ||
| Urban teaching | 91.2% | 72.3% | 96.7% | 73.7% |
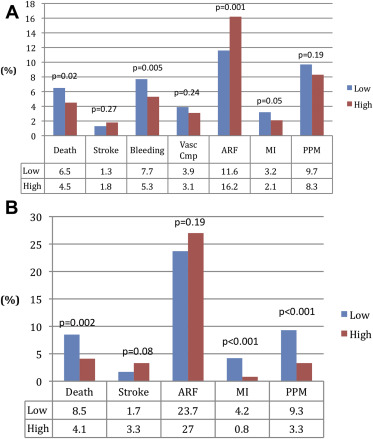
Figure 1 demonstrates the in-hospital outcome after TF-TAVI and TA-TAVI stratified by hospital volume. In the TF-TAVI cohort, there was a higher incidence of death, bleeding, and MI in the group of patients undergoing procedures in the low-volume centers versus high-volume centers. Low hospital volume status was associated with significantly greater odds of death, bleeding, and MI in univariate logistic regression analyses ( Table 2 ). After adjustment for other potential predictors of outcome using multivariate logistic regression analyses, low-volume hospital remained an independent predictor of death and bleeding but not MI.
| Outcomes | Unadjusted Odds Ratio (95% CI) | p Value | Adjusted Odds Ratio (95% CI) | p Value |
|---|---|---|---|---|
| Death | 1.50(1.07-2.01) | 0.02 | 1.55 (1.09-2.21) | 0.02 |
| Stroke | 0.70 (0.36-1.34) | 0.70 | 0.69 (0.34-1.38) | 0.29 |
| Bleeding | 1.51 (1.13-2.01) | 0.005 | 1.53 (1.19-2.10) | 0.008 |
| Vascular Complication | 1.27 (0.85-1.88) | 0.24 | 1.13 (1.07-1.13) | 0.58 |
| Acute Renal Failure | 0.68 (0.54-0.86) | 0.001 | 0.54 (0.41-0.72) | <0.001 |
| Pacemaker Implantation | 1.19 (0.92-1.54) | 0.19 | 1.39 (1.05-1.82) | 0.02 |
| Myocardial Infarction | 1.55 (0.99-2.39) | 0.05 | 1.33 (0.76-2.32) | 0.32 |
In the TA-TAVI cohort, the unadjusted rates of death, MI, and need for PPM were significantly higher in low-volume hospitals versus high-volume hospitals ( Figure 1 ). Low volume status was a strong predictor of death, MI, and need for PPM in univariate logistic regression analyses and remained an independent predictor of these adverse outcomes after multivariable adjustment ( Table 3 ).
| Outcomes | Unadjusted Odds Ratio (95% CI) | p Value | Adjusted Odds Ratio (95% CI) | p Value |
|---|---|---|---|---|
| Death | 2.17 (1.32-3.55) | 0.002 | 3.08 (1.69-5.65) | <0.001 |
| Stroke | 0.51 (0.24-1.10) | 0.08 | 0.43 (0.45-1.26) | 0.12 |
| Acute Renal Failure | 0.84 (0.65-1.90) | 0.19 | 1.12 (0.70-1.79) | 0.63 |
| Pacemaker Implantation | 3.03 (1.79-5.13) | <0.001 | 6.01 (2.96-12.2) | <0.001 |
| Myocardial Infarction | 5.35 (2.04-14.08) | 0.001 | 5.43 (1.75-16.9) | 0.003 |
Stay updated, free articles. Join our Telegram channel

Full access? Get Clinical Tree


