The determinants of improvement in functional mitral regurgitation (FMR) after cardiac resynchronization therapy (CRT) remain unclear. We evaluated the predictors of FMR improvement and hypothesized that CRT-induced change in QRS duration (ΔQRS) might have an impact on FMR response after CRT. One hundred ten CRT recipients were enrolled. CRT response (≥15 reduction in left ventricular end-systolic volume) and FMR response (absolute reduction in FMR volume) were assessed with echocardiography before and 6 months after CRT. The study end points included all-cause death or hospitalization assessed in 12 ± 3 months (range 1 to 18). A total of 71 patients (65%) responded to CRT at 6 months. FMR response was observed in 49 (69%) of the CRT responders and 8 (20%) of the CRT nonresponders (p <0.001). Although the baseline QRS durations were similar, the paced QRS durations were shorter (p = 0.012) and the ΔQRS values were greater (p = 0.003) in FMR responders compared with FMR nonresponders. There was a linear correlation between ΔQRS and change in regurgitant volume ( r = 0.49, p <0.001). At multivariate analysis, baseline tenting area (p = 0.012) and ΔQRS (p = 0.028) independently predicted FMR response. A ΔQRS ≥ 20 ms was related to CRT response, FMR improvement, and lower rates of death or hospitalization during follow-up (p values <0.05). In conclusion, QRS narrowing after CRT independently predicts FMR response. A ΔQRS ≥20 ms after CRT is associated with a favorable outcome in all clinical end points.
Functional mitral regurgitation (FMR) has been shown to improve after cardiac resynchronization therapy (CRT), although the precise mechanism is not fully understood. Recent studies have suggested that the degree of left ventricular (LV) remodeling, distortion of the mitral valve geometry, and the presence of mechanical dyssynchrony at baseline may alter the severity of FMR after CRT. Previous reports showed that a narrowed QRS after CRT is associated with LV reverse remodeling and improved survival. However, the effect of CRT-induced QRS change (ΔQRS) on FMR reduction has never been addressed previously. The present study investigated the predictors of FMR improvement and tested the hypothesis whether ΔQRS might have an impact on FMR response after CRT.
Methods
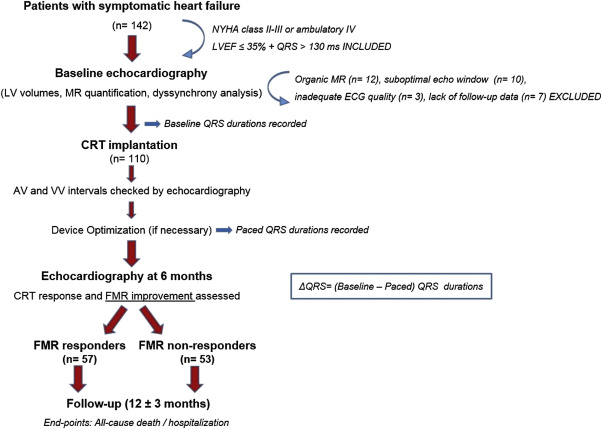
The study population initially consisted of 142 patients who received biventricular pacemaker devices with or without a defibrillator (CRT-D or CRT-P) in a single center. In line with the current guidelines, all patients had a LV ejection fraction (LVEF) ≤35%, an increased QRS duration (≥130 ms), and symptomatic heart failure (New York Heart Association [NYHA] class II to III or ambulatory class IV) despite optimal medical therapy. Patients with organic mitral valve disease (n = 12), which was defined as moderate-to-severe annular calcifications, rheumatic valve disease, mitral valve prolapse, or flail leaflet/chordae, and a history of mitral valve repair or replacement were excluded. Owing to the suboptimal echocardiographic image quality, 10 patients were excluded. Patients who failed to continue follow-up visits (n = 7) and those without an electrocardiogram of adequate quality to calculate QRS intervals (n = 3) were also excluded, and the final CRT cohort consisted of 110 patients. The study protocol was approved by the local ethics committee and written informed consent was obtained from all participants.
Left subclavian approach was used for device implantation. The right ventricular and the right atrial (in patients with sinus rhythm) leads were located in the right ventricular apex and in the right atrial free wall, respectively. The LV lead was inserted preferably in the posterolateral coronary vein, as recommended. All leads were connected to either a CRT-P or CRT-D device depending on the clinical indication or the operator’s choice. Default values were set to 100 ms for the atrio-ventricular interval and 20 ms for the inter-ventricular interval (LV preceding right ventricular). Before discharge, patients were reevaluated with echocardiography to check whether the default settings resulted in optimal LV diastolic filling and in optimal cardiac output. In case of a need for optimization, a previously described echocardiographic method was used. The final electrocardiogram after optimization was used to calculate the post-CRT QRS duration in the study data.
Both baseline and paced 12-lead electrocardiographic (ECG) tracings were recorded on chart paper at a speed of 50 mm/s with a gain setting of 10 mm/mV. QRS durations were manually calculated and double-checked with the computer output. Baseline QRS morphologies were recorded as either left bundle branch block or non–left bundle branch block on the basis of the criteria. The difference between the baseline and the paced QRS durations was defined as delta QRS (ΔQRS = baseline QRS − paced QRS). A post-CRT–narrowed QRS duration was represented by a positive ΔQRS; whereas a negative ΔQRS indicated that QRS interval was prolonged after CRT.
Baseline and 6-month follow-up echocardiograms were performed with a commercially available system (Vivid E9; General Electric, Milwaukee, Wisconsin) using a 3.5-MHz transducer. The cine loops were recorded in the left lateral decubitus position and analyzed offline. Apical 2- and 4-chamber views were used to measure LV volumes both in end systole (LVESV) and end diastole to calculate the LVEF using the biplane Simpson’s technique. CRT response was defined as a ≥15% reduction in LVESV at 6 months.
FMR severity was determined using the proximal isovelocity surface area method and was quantified as the effective regurgitant orifice area and the regurgitant volume (RegV). Patients were categorized as having moderate-to-severe FMR if the RegV at baseline was ≥30 ml. FMR response was defined as the absolute reduction in RegV at 6 months compared with the baseline value. Mitral remodeling was assessed in the parasternal long-axis view at mid systole by measuring (1) the tenting area (TA) as the area enclosed between the annular plane and the coaptation point of the mitral leaflets, and (2) the tenting distance (TD) as the perpendicular line between the annular plane and the coaptation point of the mitral valve leaflets.
Speckle tracking echocardiography was used for strain and dyssynchrony measurements. A commercially available software (EchoPac; General Electric, Milwaukee, Wisconsin) was used for offline analyses. The global longitudinal strain was calculated as the average of peak strain values for each of the segments in all 3 apical views. Short-axis views at the papillary muscle level were used to obtain radial and circumferential strain values (RS and CS, respectively). LV longitudinal dyssynchrony was assessed with the “Yu index” using tissue synchronization imaging. Time-to-peak longitudinal systolic strain values in a 12 myocardial segment model were measured. SDs of these values were recorded as the Yu index; a level ≥33 ms was defined as the cut-off value for significant longitudinal dyssynchrony. Myocardial velocity curves were constructed simultaneously with tissue Doppler in the apical 4-chamber view. Septolateral delay was calculated as the time delay between the time-to-peak systolic velocity of the basal septum and lateral wall. An anterior-to-posterior peak strain opposite wall delay (A-P delay) ≥130 ms from mid LV short-axis was defined as significant radial dyssynchrony.
Offline analyses were performed by 2 expert sonographers who were blinded to the study data. Twenty randomly selected patients were retrospectively reevaluated to test the reproducibility of the main echocardiographic parameters used to determine FMR response and CRT response in the study. Intraobserver variability was found as 7% and interobserver variability as 9% for measuring RegVs, whereas these values were respectively found as 6% and 8% for measuring LV end-systolic volumes, all of which were within a clinically acceptable range.
Patients were followed up for the end points defined as all-cause death or heart failure–related hospitalization during 12 ± 3 months (range: 1 to 18 months). Regular clinical visits were scheduled for intervals of 3 months. The follow-up data were obtained through regular visits, by telephone calls, and from hospital records. Only one event was counted for each patient. Two groups were created on the basis of the FMR response assessed at 6 months: FMR responders (n = 57) and FMR nonresponders (n = 53). Figure 1 demonstrates the design of the study illustrated with the inclusion/exclusion criteria and the timeline for device implantation, ECG recordings, echocardiographic analyses, and follow-up.
Statistical analyses were conducted using SPSS, version 17.0, (SPSS Inc., Chicago, Illinois). Data are expressed as mean ± SD for continuous variables and percentage for categorical variables. The Shapiro–Wilk test was used to test normality and a p value >0.05 was defined as normally distributed data. Continuous variables that showed normal distribution were compared using the Student t test, whereas the Mann–Whitney U test was used for nonnormally distributed samples. Associations of the categorical variables between groups were tested using the chi-square test. Statistical significance was defined as a p value <0.05 for all comparisons. Pearson’s correlation was used to test the relation between the ΔQRS values and the reduction in RegV.
The predictors of FMR response after CRT were tested by univariate and multivariate logistic regression analyses. Variables with a p value <0.05 in the univariate analysis were tested in the multivariate model. NYHA class, ischemic origin, baseline QRS duration, ΔQRS value, LVEF, LVESV, radial dyssynchrony, Yu index, TA, and TA were the independent variables, whereas FMR response was the dependent variable of the model. Results were expressed as the p value and hazard ratio (HR) in CI of 95%. A receiver operating characteristic analysis was also performed to define a cut-off level for ΔQRS to predict FMR response. Results of the receiver operating characteristic analysis were expressed as the area under the curve, SE, p value, and 95% CI. The Kaplan–Meier curves were generated to analyze the effect of (1) FMR response on cumulative survival/hospitalization and (2) ΔQRS ≥20 ms on cumulative survival/hospitalization during the follow-up. The results were expressed as log-rank and p values.
Results
The study population had a mean age of 64 ± 11 (36% women, 57% ischemic cardiomyopathy) and a mean LVEF of 26.5 ± 5.7%. The mean effective regurgitant orifice area was 17.3 ± 4.5 cm 2 and the mean RegV was 29.5 ± 16.3 ml at baseline. Overall, 71 patients (65%) responded to CRT. FMR improvement (n = 57) was observed in 69% (n = 49) of the CRT responders and 20% (n = 8) of the CRT nonresponders (p <0.001). Figure 2 demonstrates the association of FMR improvement with CRT response and functional response (≥1 level of improvement in NYHA class). Figure 2 shows the Kaplan–Meier curves generated for estimation of death and hospitalization on the basis of FMR response separately. FMR responders showed statistical significance for estimation of both deaths during follow-up.
Baseline clinical and ECG features of the overall population are represented and compared on the basis of FMR response in Table 1 . Although the baseline QRS durations were comparable (p = 0.320), the paced QRS durations were shorter (143.6 ± 21.8 vs 169.1 ± 21.3 ms, p = 0.012) and the ΔQRS values were greater (18.3 ± 25.4 vs −10.7 ± 27.2 ms, p = 0.003) in FMR responders than those in FMR nonresponders. A total of 47 patients had a negative ΔQRS after CRT, in whom 56% (n = 30) were FMR nonresponders and 29% (n = 17) were FMR responders (p = 0.005). Baseline echocardiographic parameters of the overall population are shown and compared on the basis of FMR response in Table 2 . FMR responders were more likely to have baseline radial dyssynchrony (49% vs 34%, p = 0.042), whereas FMR nonresponders had a greater baseline TA (4.68 ± 1.02 vs 3.22 ± 0.88 cm 2 , p = 0.002). All other variables were comparable in 2 groups.
| Variable | Overall (n = 110) | Functional Mitral Regurgitation | p value | |
|---|---|---|---|---|
| Non-responders (n = 53) | Responders (n = 57) | |||
| Age (years) | 64 ± 11 | 62 ± 11 | 65 ± 11 | 0.319 |
| Female | 40 (36%) | 16 (30%) | 24 (42%) | 0.198 |
| Body surface area (/m 2 ) | 1.85 ± 0.21 | 1.88 ± 0.18 | 1.83 ± 0.23 | 0.159 |
| Body mass index (kg/m 2 ) | 27.5 ± 4.7 | 27.2 ± 4,6 | 27.8 ± 4.9 | 0.554 |
| Ischemic etiology | 63 (57%) | 26 (49%) | 37 (64%) | 0.199 |
| Hypertension | 80 (73%) | 35 (66%) | 45 (79%) | 0.131 |
| Diabetes mellitus | 36 (33%) | 17 (30%) | 19 (35%) | 0.588 |
| Hyperlipidemia | 51 (46%) | 20 (38%) | 31 (54%) | 0.088 |
| Atrial fibrillation | 30 (27%) | 17 (30%) | 13 (25%) | 0.512 |
| NYHA Class | 2.8 ± 0.7 | 2.77 ± 0.7 | 2.88 ± 0.7 | 0.450 |
| NYHA III or ambulatory IV | 71 (64%) | 34 (60%) | 37 (64%) | 0.383 |
| CRT with a defibrillator | 98 (89%) | 47 (88%) | 51 (90%) | 0.446 |
| LBBB morphology | 94 (85%) | 44 (83%) | 50 (87%) | 0.232 |
| Baseline QRS duration (ms) | 160.5 ± 20.9 | 158.4 ± 21.7 | 162.4 ± 20.1 | 0.320 |
| Paced QRS duration (ms) | 155.9 ± 25.0 | 169.1 ± 21.3 | 143.6 ± 21.8 | 0.012 |
| ΔQRS (ms) | 4.3 ± 27.2 | −10.7 ± 27.2 | 18.3 ± 25.4 | 0.003 |
| Electrical dyssynchrony | 47 (43%) | 30 (56%) | 17 (29%) | 0.005 |
| Hemoglobin (g/dl) | 12.4 ± 1.6 | 12.4 ± 1.8 | 12.5 ± 1.5 | 0.762 |
| Creatinine (mg/dl) | 1.1 ± 0.4 | 1.0 ± 0.3 | 1.1 ± 0.4 | 0.559 |
| Medication | ||||
| Beta-blocker | 104 (95%) | 50 (94%) | 54 (95%) | 0.928 |
| Angiotensin converting enzyme inhibitor or angiotensin receptor blocker | 105 (96%) | 51 (96%) | 54 (95%) | 0.711 |
| Spironolactone | 84 (76%) | 40 (75%) | 44 (77%) | 0.564 |
| Furosemide | 90 (82%) | 42 (80%) | 48 (84%) | 0.473 |
| Digoxine | 47 (43%) | 25 (47%) | 22 (39%) | 0.368 |
| Nitrate | 31 (28%) | 16 (30%) | 15 (26%) | 0.655 |
| Amiodarone | 40 (36%) | 22 (42%) | 18 (32%) | 0.284 |
| Warfarin | 50 (46%) | 26 (49%) | 24 (42%) | 0.235 |
| Variable | Overall (n = 110) | Functional Mitral Regurgitation | p value | |
|---|---|---|---|---|
| Non-responders (n = 53) | Responders (n = 57) | |||
| Left ventricular end-systolic volume (ml) | 157.2 ± 50.5 | 168.8 ± 50.6 | 149.8 ± 50.8 | 0.032 |
| Left ventricular end-diastolic volume (ml) | 212.6 ± 57.9 | 230.3 ± 57.2 | 201.7 ± 59.0 | 0.194 |
| Left ventricular ejection fraction | 26.5 ± 5.7 | 25.8 ± 5.7 | 27.2 ± 5.6 | 0.202 |
| Effective regurgitant orifice area (cm 2 ) | 0.22 ± 0.12 | 0.23 ± 0.14 | 0.21 ± 0.10 | 0.212 |
| Regurgitant volume (ml) | 29.5 ± 16.3 | 30.5 ± 17.6 | 28.3 ± 14.6 | 0.088 |
| Moderate to severe mitral regurgitation | 52 (47%) | 22 (43%) | 30 (52%) | 0.243 |
| Tenting area (cm 2 ) | 3.94 ± 0.93 | 4.68 ± 1.02 | 3.22 ± 0.88 | 0.002 |
| Tenting distance (cm) | 1.72 ± 0.41 | 1.97 ± 0.42 | 1.65 ± 0.39 | 0.138 |
| Radial anteroseptum to posterior delay (ms) | 123.0 ± 52.5 | 137.9 ± 51.3 | 118.3 ± 53.6 | 0.102 |
| Septum to lateral delay (ms) | 15.3 ± 58.7 | 20.7 ± 54.6 | 18.2 ± 62.4 | 0.351 |
| Yu index (ms) | 44.8 ± 19.2 | 42.2 ± 16.7 | 46.5 ± 20.7 | 0.286 |
| Radial dyssynchrony | 46 (42%) | 18 (34%) | 28 (49%) | 0.042 |
| Longitudinal dyssynchrony | 54 (49%) | 25 (47%) | 29 (51%) | 0.252 |
Figure 3 demonstrates that FMR response rate was higher in patients with a positive ΔQRS and in addition, a negative ΔQRS was associated with unchanged or worsened FMR severity after CRT (Pearson chi-Square = 8.048, p = 0.005). There was also a linear correlation ( r = 0.49, p <0.001) between the ΔQRS values and the change in RegV ( Figure 3 ).


