Assessment of left ventricular (LV) diastolic function by Doppler flow imaging and tissue Doppler is an integral part of the echocardiographic examination. Mitral annular calcium (MAC) is frequently encountered on echocardiography. The aim of this study was to assess the impact of MAC, quantitatively measured by computed tomography scan, on echocardiographic LV diastolic parameters. We included 155 patients aged ≥65 years. Computed tomography reconstructions of the mitral annulus were created, and calcium identified and quantified by Agatston technique. Calcium locations were assigned using an overlaid template depicting the annular segments in relation to surrounding anatomic structures. Echocardiographic assessment of diastolic function was performed in standard fashion. Mean age was 77 years; 49% were men; and 43% were black. Patients with MAC had lower septal e’ (p = 0.003), lateral e’ (p = 0.04), and average e’ (p = 0.01) compared with those without MAC. They also had a higher E-wave velocity (p = 0.01) and E/e’ ratio (p <0.001). When evaluated by severity of MAC, and after adjustment for multiple clinical factors, there was a graded (inverse) relation between MAC severity and septal e’ (p = 0.01), lateral e’ (p = 0.01), and average e’ (p = 0.01). In conclusion, LV diastolic parameters, as measured by Doppler echocardiography, are altered in the presence of MAC. This could be due to direct effects of MAC on annular function or might reflect truly reduced diastolic function. Interpretation of diastolic parameters in patients with MAC should be performed with caution.
Mitral annular calcium (MAC) is common, especially with advancing age, and is associated with atherosclerotic risk factors, coronary artery disease (CAD), and cardiovascular events. Valvular dysfunction can occur in this condition, including mitral regurgitation, elevated transmitral gradients, and even mitral stenosis. Doppler tissue imaging of the mitral annulus is particularly useful in the assessment of left ventricular (LV) diastolic function and is a powerful predictor of cardiovascular mortality. The ratio of mitral E-wave velocity to tissue Doppler e’ velocity (E/e’) allows estimation of LV filling pressures and is also associated with mortality. Classically, e’ velocity is assumed to be decreased in patients with prosthetic valves or MAC, but data are lacking. Only one study has examined the relation between MAC and a decreased e’. In this study, assessment of MAC was limited to the posterior mitral annulus, and its severity was semiquantitatively defined by thickness of the calcium. Furthermore, measurement of e’ was only performed on the lateral aspect of the mitral annulus. As opposed to echocardiography, computed tomography (CT) scanning allows for precise objective assessment of calcium in tissues. The aim of the present study was to evaluate possible correlations between MAC, measured quantitatively on unenhanced chest CT scans, and Doppler parameters of LV diastolic function. We hypothesized that MAC, by stiffening the annulus, would be associated with lower tissue Doppler velocities, and that there would be a graded response according to the severity of MAC.
Methods
We retrospectively analyzed echocardiograms in 155 patients, 65 and older, who had clinically indicated noncontrast axial chest CT scans performed from August 2012 to June 2013. All echocardiograms were performed within 6 months of the CT scan. Patients with a history of mitral valve surgery were excluded as were those with greater than mild aortic valve disease (stenosis or regurgitation) or intrinsic mitral valve disease. Demographic and clinical data were collected, including age, gender, race, history of CAD, congestive heart failure, hypertension (HTN), chronic kidney disease (CKD), and diabetes mellitus.
Echocardiographic studies were performed with commercially available echocardiography machines (Vivid 7 or Vivid E9; GE Medical Systems, Horten, Norway or Philips iE33; Philips Medical Systems, Andover, Massachusetts). Diastolic parameters were obtained in accordance with the American Society of Echocardiography recommendations. Peak early (E) and late transmitral flow velocity (A) were measured in the apical 4-chamber view. The ratio between those measurements was calculated (E/A ratio). We also obtained the deceleration time of the early transmitral flow velocity. Pulsed-wave Doppler tissue imaging was performed by placing the sample volume at the septal and lateral insertion sites of the mitral leaflets in the apical 4-chamber view. Measurements included the early diastolic annular velocity (e’) at the septal and lateral sides of the mitral annulus and their average as well as the systolic velocity obtained from the septal side of the mitral annulus (s’). The ratio of mitral inflow E velocity to tissue Doppler e’ velocity was also calculated (E/e’ ratio). We obtained the myocardial performance index through tissue Doppler imaging using the formula MPI = A–B/B where A is the time interval from the end of a’ (late diastolic annular velocity) to the onset of e’, B is the time from onset to end of s’, and MPI is the myocardial performance index. LV ejection fraction was obtained by modified Simpson’s method or Teichholz method when possible; it was otherwise estimated visually. All echocardiograms were reviewed by one reader to eliminate interobserver variability. Thirty echocardiograms were randomly reanalyzed 3 months after the initial assessment to evaluate intraobserver variability, obtaining a κ value of 0.82, which usually indicates excellent agreement.
CT scans were performed using Brilliance iCT, (Philips Healthcare, Cleveland, Ohio) or LightSpeed VCT, (General Electric Healthcare, Milwaukee, Wisconsin) scanners. Thin CT slices ranging from 0.62 to 1.25 mm were obtained from a “Synapse PACS” system (Fujifilm Medical Systems USA, Stamford, Connecticut). Specific reconstructions in the planes of the mitral annulus were created using an “IntelliSpace 3D” workstation (Philips Healthcare, Cleveland, Ohio).
We first created a schematic template of the mitral annulus using images from electrocardiogram-gated contrast enhanced CT scans ( Figure 1 ). The posterior annulus was divided into 3 segments according to Carpentier’s nomenclature, designating P1 as the most lateral posterior segment, P2 as the central segment, and P3 as the most medial segment. The anterior annulus was similarly divided into 3 segments labeled A1, A2, and A3. A line was drawn between the mitral valve commissures (intercommissural axis) dividing the anterior and posterior segments. A separate line was added from the middle of the aortic valve through the middle of P2. This allowed precise alignment of the template over the mitral annulus.
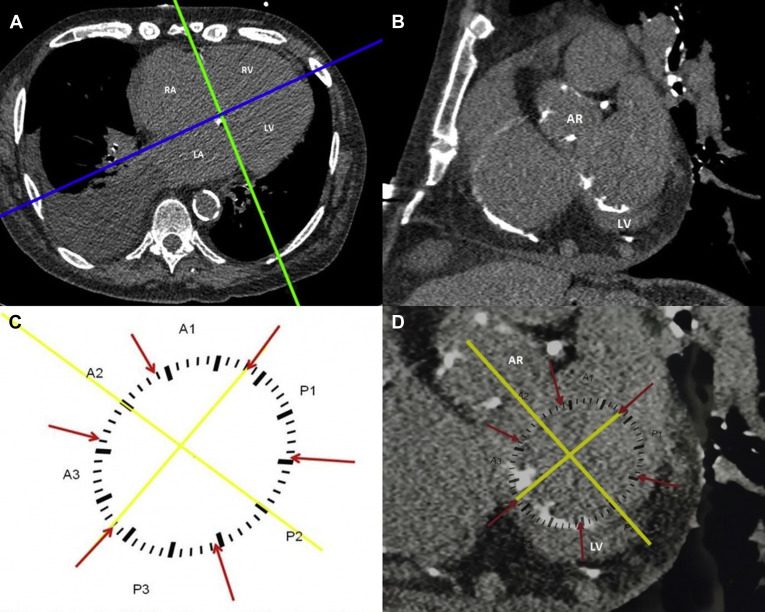
To analyze MAC deposits on ungated CT scans, we first created a plane through the annulus. This was done by creating a reconstruction perpendicular to the 4-chamber plane and running through the right and left atrioventricular grooves ( Figure 1 ). The mitral annulus was identified in the resulting coronal plane by locating surrounding landmarks (aortic root and left ventricle; Figure 1 ). For this analysis the mitral annulus was considered to extend 3 to 5 mm above and below the atrioventricular groove. The template was then manually applied to the monitor screen, and image magnification was adjusted to allow a proper fit ( Figure 1 ). The location of calcium deposits was assigned using the template. Agatston score was calculated separately for each segment using Heartbeat CS software (Philips Healthcare, Cleveland, Ohio). MAC was defined as an Agatson score >0. All CT scans were analyzed by one reader to eliminate interobserver variability. This study was approved by the Institutional Review Board of the Albert Einstein Healthcare Network.
Data were summarized by calculating mean ± SD for continuous variables and as numbers and percentages for categorical variables. The t test, chi-square, and Fisher’s exact tests were used to compare baseline characteristics and echocardiographic parameters in patients with and without MAC. Three groups were created using the median Agatston score (119 AU) among the calcified subjects: group 1, no MAC; group 2, mild MAC ≤119 AU; group 3, moderate–severe MAC >119 AU. To assess the independent relation between MAC and diastolic function multivariate linear regression was used to adjust for age, gender, race and confounders known to affect diastolic function such as HTN, coronary disease, history of heart failure, CKD, diabetes as well as ejection fraction. All analyses were performed using JMP, version 8.0, (SAS Institute, Cary, North Carolina) and a 2-tailed p value <0.05 was considered significant.
Results
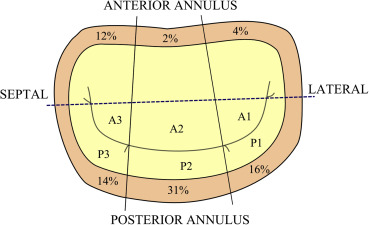
Baseline characteristics are displayed in Table 1 . MAC was present in 76 patients (49%). Among those with MAC, age was significantly greater (79 years vs 75 years p <0.001), and there was a higher prevalence of CAD (47% vs 29% p = 0.02). MAC was more common in whites than in blacks (61% vs 42% p = 0.02) although there was no significant difference between men and women (47% vs 51% respectively, p = not significant). Among all patients, the posterior annulus was the most commonly affected in isolation (33%); the anterior annulus alone was involved in 5%, and both the anterior and posterior annulus in 11% of patients. When viewed by segments, P2 was the most commonly affected (31% of all patients), followed by P1 (16%) and P3 (14%). The anterior annulus was less commonly involved: A3 in 12% of patients, followed by A1 (4%) and A2 (2%) as seen in Figure 2 . The posterior annulus was also more heavily calcified, with a mean Agatson score of 485.2 ± 777 versus 108.64 ± 174 for the anterior annulus.
| Variable | All Patients | Mitral Annular Calcium | ||
|---|---|---|---|---|
| Present (n=76) | Absent (n=79) | P | ||
| Age (Years) | 77 ± 7 | 79 ± 6 | 75 ± 7 | < 0.001 |
| Men | 76 (49%) | 36 (47%) | 40 (51%) | NS |
| Black | 67 (43%) | 28 (37%) | 39 (49%) | |
| White | 65 (42%) | 40 (53%) | 25 (32%) | NS |
| Other | 6 (4%) | 2 (3%) | 4 (5%) | |
| Hypertension | 129 (83%) | 66 (87%) | 63 (80%) | NS |
| Diabetes mellitus | 50 (32%) | 26 (34%) | 24 (30%) | NS |
| Coronary artery disease | 59 (38%) | 36 (47%) | 23 (29%) | 0.02 |
| Chronic kidney disease | 38 (24%) | 21 (28%) | 17 (21%) | NS |
| Congestive heart failure | 43 (28%) | 23 (30%) | 20 (25%) | NS |
Patients with any degree of MAC had significantly lower e’ velocity compared to those with no MAC ( Table 2 ). After adjusting for age, gender, race, ejection fraction, and multiple clinical (HTN, coronary disease, history of heart failure, CKD, and diabetes), these associations remained significant. Eighteen patients had a septal wall motion abnormality and 10 patients had a lateral wall motion abnormality. After excluding these patients, the relation between MAC and e’ remained significant. Subjects with MAC also had significantly higher E-wave velocity (87 cm/s vs 77 cm/s; p = 0.01) and E/e’ ratio (16.6 vs 12.5 p <0.001) compared to patients without MAC; excluding subjects with wall motion abnormalities did not change these results.
| Variable | All Patients | Mitral Annular Calcium | P | |
|---|---|---|---|---|
| Present (n=76) | Absent (n=79) | |||
| E (cm/sec) | 82 ± 24 | 87 ± 27 | 78 ± 21 | 0.01 |
| A (cm/sec) | 84 ± 29 | 87 ± 35 | 82 ± 22 | NS |
| E/A ratio | 1.1 ± 0.8 | 1.26 ± 1.01 | 1.01 ± 0.47 | NS |
| e’ septal (cm/sec) | 5.5 ± 1.8 | 5.1 ± 1.7 | 5.9 ± 1.8 | 0.003 |
| e’ lateral (cm/sec) | 6.9 ± 2.4 | 6.5 ± 2.3 | 7.3 ± 2.4 | 0.04 |
| e’ average (cm/sec) | 6.2 ± 1.9 | 5.8 ± 1.7 | 6.6 ± 2.0 | 0.01 |
| E/e’ ratio | 15 ± 7 | 17 ± 8.7 | 13 ± 4.9 | < 0.001 |
| s’ septal (cm/sec) | 6.08 ± 1.6 | 5.89 ± 1.6 | 6.26 ± 1.7 | NS |
| MPI | 0.48 ± 0.1 | 0.47 ± 0.1 | 0.48 ± 0.2 | NS |
| Deceleration time (msec) | 210 ± 55 | 209 ± 58 | 211 ± 52 | NS |
| Ejection fraction (%) | 58 ± 12 | 58 ± 12 | 57 ± 12 | NS |
Comparisons were then made between MAC subgroups, no MAC, mild MAC, and moderate–severe MAC. We found a significant inverse correlation between MAC severity and septal e’, and average e’, with a trend for lateral e’ (p = 0.06). In a fully adjusted model, there was a significant inverse correlation between MAC and e’ (septal, lateral, and average, p = 0.01 for each, Table 3 ). Regarding E/e’ ratio, we performed a multivariate analysis to determine independent predictors of a higher E/e’ ratio. We found a significant direct correlation between MAC severity and a higher E/e’ ratio (using average e’) after adjusting for multiple clinical factors and ejection fraction (p <0.001). This association was also seen when using septal or lateral e’ and after excluding patients with wall motion abnormalities.


