This study aimed to investigate the progression of mild-to-moderate aortic stenosis (AS) in patients with end-stage renal disease (ESRD) and determine its metabolic and hemodynamic contributors and clinical outcomes. A total of 74 patients with ESRD (50 men, age 72 ± 11 years) with mild-to-moderate AS were compared with 79 age- and gender-matched controls with normal kidney function. Clinical, laboratory, and echocardiographic features and clinical outcomes including aortic valve (AV) intervention, hospitalization due to heart failure, and cardiovascular death were analyzed. Patients with ESRD were divided into 2 subgroups according to their rate of AV area changes (group 1 [n = 28], rapid progression; and group 2 [n = 46], slow progression). Progression in the degree of AS was noted in 38% of patients with ESRD and 18% of controls (p <0.01) during comparable echocardiographic follow-up durations (29 ± 15 vs 27 ± 24 months, respectively, p = 0.57). In ESRD, patients in group 1 were older (p <0.01) with higher baseline log parathyroid hormone (p <0.01) and larger stroke volume (p = 0.03) than those in group 2. During clinical follow-up (48 ± 23 months), patients in group 1 showed poorer clinical outcomes than those in group 2 and controls (log-rank p <0.01). Age, left atrial volume index ≥42 ml/m 2 , and annual increases of peak pressure gradient across the AV (mm Hg/year) demonstrated additive predictive values for prognosis. AS in ESRD progresses in an accelerated manner along with higher metabolic and hemodynamic loads on AV compared with those with normal kidney function. Accelerated progression of mild-to-moderate AS in ESRD results in poor prognosis.
Previous studies reported a higher prevalence of aortic valve (AV) calcification or calcific aortic stenosis (AS) with rapid progression in patients with end-stage renal disease (ESRD) compared with those with normal kidney function. However, the determinants of this phenomenon and clinical outcomes are not well understood in mild-to-moderate AS. Abnormal calcium and phosphate metabolism in ESRD has been considered the main pathogenic factor of premature AV calcification, but other factors that increase mechanical stress on the AV may contribute to progression of AS. Therefore, we hypothesized that (1) patients with ESRD with mild-to-moderate AS would show AS progression in an accelerated manner compared with age- and gender-matched mild-to-moderate AS with normal kidney function; (2) there would be hemodynamic determinants and increased calcium-phosphate products in AS progression; and (3) accelerated AS progression in patients with ESRD would be a prognostic factor of poor outcome.
Methods
A total of 132 patients with ESRD diagnosed with AS by 2-dimensional transthoracic echocardiography (TTE) from January 2006 to December 2012 were reviewed retrospectively at a single tertiary medical center. Patients with a history of valve surgery or intervention, congenital heart disease, hypertrophic obstructive cardiomyopathy, severe AS, significant aortic regurgitation (≥ moderate), a history of parathyroidectomy, cancer, or a history of kidney transplantation were excluded. Patients without follow-up TTE or missing aortic mean gradient were also excluded. Thus, all patients underwent TTE at least 2 times. If patients underwent more than 3 times TTE, the initial TTE at the diagnosis of mild-to-moderate AS and the last TTE during the follow-up were taken for the analysis. Finally, we analyzed 74 patients with ESRD and compared them with 79 age- and gender-matched, mild-to-moderate AS patients with an estimated glomerular filtration rate >60 ml/min/1.73 m 2 as a control group. Clinical information was obtained from electronic medical records. Charlson Comorbidity Index was calculated, in which co-morbid conditions are scored by the method previously reported by Charlson et al. Laboratory results including serum creatinine, urea nitrogen, parathyroid hormone (PTH), 25-hydroxyl vitamin D, triglyceride, total cholesterol, high-density lipoprotein cholesterol, low-density lipoprotein cholesterol, calcium, phosphate, and hemoglobin were analyzed at the time of baseline TTE.
AS progression was defined as any stepups in AS severity, including mild AS that progressed to either moderate to severe, or moderate AS that progressed to severe. Patients with ESRD were further categorized into 2 subgroups (rapid progression vs slow progression) according to the rate of AV area changes. The 99% CI of the annual AV area reduction in the control group (0.128 cm 2 /year) was used as a point of division. Among the patients with ESRD, 28 patients (38%) were classified in the rapid progression group (group 1), and 46 patients (62%) were in the slow progression group (group 2).
Comprehensive 2-dimensional and Doppler TTE were performed at baseline and during follow-up. Standard measurements were performed per the recommendations of the current guidelines. Peak velocity was measured by continuous-wave Doppler from several acoustic windows to obtain the highest maximal velocities. Peak pressure gradients (PPGs) across the AV were calculated using the simplified Bernoulli equation. The position that yielded the highest AV velocity was used, and at least 3 signals were traced and averaged to determine the time–velocity integral and to calculate the mean pressure gradient (MPG). AV area was calculated by the continuity equation and indexed for body surface area. Left ventricular (LV) stroke volume was calculated by multiplying the area of the LV outflow tract by the outflow tract time–velocity integral. Severity of AS was determined by MPG and AV area, according to the current American College of Cardiology/American Heart Association guidelines. Etiology of AS was determined as rheumatic, degenerative, or bicuspid AV according to valve anatomy and paravalvular structures. Annualized changes in PPG, MPG, and AV area were calculated as the difference between baseline and follow-up measurements divided by the time interval between the 2 examinations.
Clinical outcomes were composed of AV intervention, hospitalization due to heart failure, and cardiovascular death. AV intervention included either surgical or transcatheter AV replacement. AV replacement with other cardiac surgery was also included in AV intervention. Patients were followed until the first event (death or AV intervention) or until the last date of office visits.
Continuous variables were compared between the groups using the Student t test (for 2-group comparisons) and analysis of variance (for 3-group comparisons), whereas the categorical variables were compared by the chi-square test. Kaplan–Meier analysis with log-rank testing was used for temporal analysis of time-to-event outcomes in each group. The variables which were statistically significant by univariate analysis or from previous studies were included in a multivariate model with stepwise elimination to determine predictors of clinical outcomes and progression of AS. The receiver operating characteristic curves analysis was used to determine optimal thresholds. Two-sided p values of <0.05 were considered statistically significant.
Results
A total of 74 patients with ESRD were enrolled. Five were on peritoneal dialysis, whereas the rest were on hemodialysis. Their mean duration of dialysis was 8.9 ± 5.9 years. Baseline clinical and echocardiographic characteristics of ESRD and control groups are described in Table 1 . The severity of AS, baseline AV area, PPG, MPG, and AV area did not show significant differences between the 2 groups. Degenerative AS was significantly more prevalent in the ESRD group (91% vs 71%, p <0.01), whereas bicuspid AS was significantly more frequent in the control group (7% vs 22%, p = 0.02). LV chamber size, LV mass index, and left atrial (LA) volume index were significantly larger in patients with ESRD than controls. LV ejection fraction and S′ reflecting LV systolic function were significantly lower in patients with ESRD. In addition, E/e’ and estimated right ventricular systolic pressure showed significantly greater values in patients with ESRD. These findings were compatible with LV diastolic dysfunction and subsequent elevation of LV filling pressure in patients with ESRD.
| Variables | End Stage Renal Disease (n=74) | Control (n=79) | p-value |
|---|---|---|---|
| Age, years | 72 ± 11 | 74 ± 11 | 0.19 |
| Men | 50 (68%) | 54 (68%) | 0.87 |
| Body mass index (kg/m 2 ) | 23 ± 3 | 24 ± 4 | 0.27 |
| Hypertension | 65 (88%) | 22 (23%) | <0.01 |
| Diabetes mellitus | 46 (62%) | 10 (14%) | <0.01 |
| Coronary artery disease | 38 (51%) | 24 (32%) | 0.02 |
| Peripheral artery disease | 15 (20%) | 2 (3%) | <0.01 |
| Atrial fibrillation | 14 (19%) | 16 (21%) | 0.84 |
| Systolic blood pressure (mmHg) | 141 ± 20 | 130 ± 18 | <0.01 |
| Diastolic blood pressure (mmHg) | 74 ± 12 | 75 ± 11 | 0.36 |
| Charlson comorbidity index | 4 (3-5) | 1 (0-1) | <0.01 |
| Echocardiographic characteristics | |||
| Severity of aortic stenosis | |||
| Mild | 57 (77%) | 54 (68%) | 0.13 |
| Moderate | 17 (23%) | 25 (32%) | 0.15 |
| Aortic valve area ( cm 2 ) | 1.5 ± 0.3 | 1.4 ± 0.3 | 0.12 |
| Aortic valve peak pressure gradient (mmHg) | 28 ± 13 | 29 ± 13 | 0.71 |
| Aortic valve mean pressure gradient (mmHg) | 15 ± 7 | 16 ± 8 | 0.56 |
| Etiology of aortic stenosis | |||
| Degenerative | 67 (91%) | 56 (71%) | <0.01 |
| Bicuspid | 5 (7%) | 17 (22%) | <0.01 |
| Rheumatic | 1 (1%) | 6 (8%) | 0.12 |
| Left ventricular end-diastolic dimension (mm) | 52 ± 6 | 49 ± 4 | <0.01 |
| Left ventricular end-systolic dimension (mm) | 35 ± 8 | 31 ± 4 | <0.01 |
| Left ventricular ejection fraction (%) | 62 ± 14 | 68 ± 7 | 0.02 |
| Left ventricular mass index (g/m 2 ) | 141 ± 31 | 108 ± 33 | <0.01 |
| Left atrial volume index ( ml/m 3 ) | 42 ± 15 | 33 ± 14 | <0.01 |
| Stroke volume (ml) | 76 ± 21 | 80 ± 19 | 0.25 |
| Early diastolic mitral inflow velocity (cm/sec) | 91 ± 28 | 71 ± 26 | <0.01 |
| Early diastolic mitral annular velocity (cm/sec) | 4.6 ± 1.4 | 5.1 ± 1.5 | <0.01 |
| Systolic mitral annular velocity (cm/sec) | 5.8 ± 1.5 | 6.1 ± 1.2 | <0.01 |
| E/e’ | 22 ± 9 | 14 ± 5 | <0.01 |
| Right ventricular systolic pressure (mmHg) | 35 ± 13 | 28 ± 7 | <0.01 |
Patients with ESRD with rapid progression of AS were significantly older compared with those with slow progression ( Table 2 ). Gender distribution, co-morbidities, and duration of dialysis were not different between the 2 subgroups. Log PTH and vitamin D-25(OH) were significantly greater in the rapid progression group than the other group. Patients with rapid progression had a significantly larger stroke volume (p = 0.03). Baseline AV area and MPG were not different between the 2 groups although baseline PPG revealed a higher tendency with a marginal statistical significance in the group of rapid progression ( Table 3 ).
| Variables | Rapid Progression (n=28) | Slow Progression (n=46) | P value |
|---|---|---|---|
| Clinical characteristics | |||
| Age, years | 76 ± 10 | 69 ±11 | 0.01 |
| Men | 21 (75%) | 29 (63%) | 0.32 |
| Body mass index (kg/m 2 ) | 24 ± 3.2 | 24 ± 3.5 | 0.91 |
| Hypertension | 24 (85%) | 42 (91%) | 0.36 |
| Diabetes mellitus | 15 (54%) | 32 (69%) | 0.17 |
| Coronary artery disease | 15 (54%) | 23 (50%) | 0.47 |
| Peripheral artery disease | 7 (24%) | 11 (25%) | 0.36 |
| Systolic blood pressure (mmHg) | 139 ± 21 | 141 ± 19 | 0.68 |
| Diastolic blood pressure (mmHg) | 72 ± 10 | 74 ± 13 | 0.35 |
| Total cholesterol (mg/dL) | 152 ± 45 | 146 ± 38 | 0.49 |
| Low density lipoprotein -cholesterol (mg/dL) | 89 ± 36 | 81 ± 33 | 0.44 |
| Statin use | 13 (69%) | 33 (69%) | 0.30 |
| Renin-angiotensin system blocker use | 15 (62%) | 35 (73%) | 0.42 |
| Charlson comorbidity index | 4 (3-5) | 3 (4-5) | 0.14 |
| Dialysis characteristics | |||
| Hemodialysis | 28 (100%) | 41 (89%) | 0.15 |
| Dialysis duration (years) | 8.9 ± 5.8 | 8.8 ± 6.1 | 0.99 |
| Laboratory findings | |||
| Calcium Phosphate product (mg 2 /dL 2 ) | 39 ± 11 | 40 ± 13 | 0.85 |
| Log parathyroid hormone (pg/mL) | 2.2 ± 0.3 | 1.9 ± 0.4 | 0.01 |
| Vitamin D-25(OH) (ng/mL) | 16.1 ± 8.3 | 9.4 ± 4.9 | 0.01 |
| Hemoglobin (g/dL) | 10.2 ± 1.9 | 9.8 ± 2.6 | 0.49 |
| Variables | Rapid Progression (n=28) | Slow Progression (n=46) | P value |
|---|---|---|---|
| Left ventricular end-diastolic dimension (mm) | 50 ± 7 | 52 ± 6 | 0.14 |
| Left ventricular end-systolic dimension (mm) | 33 ± 7 | 36 ± 8 | 0.17 |
| Left ventricular ejection fraction (%) | 65 ± 13 | 61 ± 14 | 0.30 |
| Left ventricular mass index (g/m 2 ) | 145 ± 31 | 144 ± 38 | 0.59 |
| Left atrial volume index (ml/m 2 ) | 43 ±12 | 41 ± 11 | 0.51 |
| Stroke volume (ml) | 83 ± 22 | 71 ± 20 | 0.03 |
| Early diastolic mitral inflow velocity (cm/sec) | 86 ± 29 | 92 ± 28 | 0.39 |
| Late diastolic mitral inflow velocity (cm/sec) | 102 ± 31 | 93 ± 28 | 0.21 |
| Early diastolic mitral annular velocity (cm/sec) | 4.6 ± 1.2 | 4.6 ±1.5 | 0.98 |
| Late diastolic mitral annular velocity (cm/sec) | 7.4 ± 2.2 | 7.3 ± 2.3 | 0.79 |
| Systolic mitral annular velocity (cm/sec) | 6.0 ± 1.4 | 5.8 ± 1.6 | 0.46 |
| E/e’ | 21 ±6 | 24 ± 11 | 0.16 |
| Right ventricular systolic pressure (mmHg) | 33 ± 13 | 36 ± 13 | 0.49 |
| Etiology of aortic stenosis | |||
| Degenerative | 26 (93%) | 42 (91%) | 0.81 |
| Bicuspid | 2 (7%) | 3 (7%) | 0.92 |
| Rheumatic | 0 (0) | 1 (2) | 0.43 |
| Severity of aortic stenosis | |||
| Mild | 21 (75%) | 36 (78%) | 0.78 |
| Moderate | 7 (25%) | 10 (22%) | 0.78 |
| Baseline aortic valve area (cm 2 ) | 1.51 ± 0.26 | 1.50 ± 0.27 | 0.56 |
| Baseline aortic valve peak pressure gradient (mmHg) | 30.6 ±12.2 | 25.0 ±12.1 | 0.06 |
| Baseline aortic valve mean pressure gradient (mmHg) | 16.8 ± 7.6 | 14.3 ± 6.8 | 0.14 |
| Time interval to repeated echocardiogram, (months) | 29 ± 20 | 27 ± 24 | 0.57 |
| Follow-up aortic valve area (cm 2 ) | 1.01 ± 0.25 | 1.48 ± 0.27 | <0.01 |
| Follow-up aortic valve peak pressure gradient (mmHg) | 52 ± 23 | 27 ± 13 | <0.01 |
| Follow-up aortic valve mean pressure gradient (mmHg) | 30 ± 14 | 15 ± 8 | <0.01 |
| Annual aortic valve area reduction rate (cm 2 /year) | 0.19 ± 0.06 | 0.02 ± 0.10 | <0.01 |
| Annual Δ peak pressure gradient (mmHg/year) | 7.2 ± 6.1 | 1.2 ± 4.8 | <0.01 |
| Annual Δ mean pressure gradient (mmHg/year) | 5.1 ± 3.9 | 1.0 ± 2.9 | <0.01 |
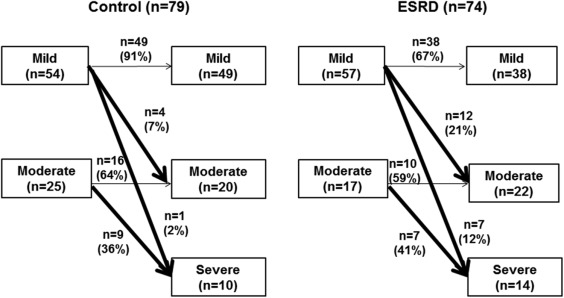
The change in AS severity during follow-up is presented in Figure 1 . Although the mean follow-up durations did not differ (29 ± 15 vs 27 ± 24 months, p = 0.57), significantly, more patients from the ESRD group with mild AS progressed to moderate or severe AS, compared with the control group (35% vs 18%, p <0.01). Moderate AS showed similar progression rates in both groups. Overall, the ESRD group revealed a greater occurrence of AS progression compared with the control group (hazard ratio 2.4, 95% CI 1.2 to 5.1, p = 0.02; Table 4 ). After adjustment for age, gender, baseline AS severity, gender, age, and stroke volume, log PTH (p = 0.02), and LA volume index ≥42 ml/m 2 (p = 0.02) were independent predictors of rapid progression of AS ( Table 5 ). ESRD with LA volume index ≥42 ml/m 2 showed significantly higher annual AV area reduction rate (0.24 ± 0.45 cm 2 /year) compared with patients with LA volume index <42 ml/m 2 (0.03 ± 0.28 cm 2 /year, p = 0.03) or control group (0.04 ± 0.15 cm 2 /year, p = 0.03). Patients with ESRD with log PTH ≥2.32 pg/ml showed a trend of higher annual AV area reduction rate (0.18 ± 0.41 cm 2 /year) compared with ESRD with log PTH <2.32 (0.08 ± 0.28, p = 0.21) and a significant higher annual AV area reduction rate than control group (0.04 ± 0.15, p = 0.04). During clinical follow-up (mean 48 ± 23 months), 6 cardiovascular deaths and 35 hospital admissions due to heart failure occurred in patients with ESRD, which were significantly higher than the control group. However, the incidence of AV interventions did not differ. Information for patients who underwent AV interventions is presented in the Supplementary Table 1 .