End-stage renal disease and mild renal insufficiency are associated with increased cardiovascular risk. Cystatin C, a novel marker of kidney function, was found to be associated with a higher frequency of cardiovascular events and mortality independent of glomerular filtration rate. It remained uncertain, however, whether enhanced cardiovascular risk associated with cystatin C is due to accelerated progression of atherosclerosis or to plaque instability. The aim of this study was to examine the effects of baseline cystatin C on annual change in coronary artery narrowing and clinical events in 423 postmenopausal women with angiographically documented coronary artery disease enrolled in the Women’s Angiographic Vitamin and Estrogen (WAVE) trial. Baseline and follow-up (mean 2.8 ± 0.9 years) angiography was performed in 320 women. Angiographic progression of disease and clinical events in each cystatin C quartile were compared. Women with cystatin C levels in the highest quartile were older and more likely to have histories of heart failure and stroke. Annualized changes in minimal and average luminal diameters were similar in diseased and nondiseased segments. All-cause death or myocardial infarction (3.6% vs 15.6%, p <0.001), cardiovascular death or myocardial infarction (2.3% vs 13.5%, p <0.001), and cardiovascular events (3.6% vs 13.5%, p <0.001) were significantly higher in women with baseline cystatin C levels in the highest quartile compared with women with cystatin C levels in the lower 3 quartiles. The risk for clinical events associated with cystatin C remained significantly higher in multivariate logistic regression analysis after adjusting for baseline differences and cardiovascular risk factors. The risk for clinical events was also independent of estimated glomerular filtration rate. In conclusion, in postmenopausal women with angiographically documented coronary artery disease, baseline cystatin C levels were associated with worse clinical outcomes without accelerated progression of atherosclerosis.
Serum cystatin C is a novel endogenous marker of renal dysfunction. It is a low–molecular weight protein freely filtered by glomeruli and metabolized but not secreted by renal tubular cells. Production of cystatin C is constant and is not affected by age, gender, muscle mass, or other factors; hence, it provides a more precise estimate of glomerular function than creatinine-based formulas. In fact, several studies have demonstrated the superiority of cystatin C compared with serum creatinine or glomerular filtration rate (GFR) in predicting cardiovascular events and all-cause mortality. Moreover, studies have also shown that cardiovascular risk associated with higher levels of cystatin C was independent of estimated GFR (eGFR). It is unclear why patients with renal insufficiency fare worse in terms of cardiovascular outcomes. Mild renal insufficiency is associated with inflammatory and procoagulant biomarkers, which may affect plaque stability and thrombotic potential after plaque rupture, leading to increased risk for acute coronary syndromes. However, renal insufficiency is also associated with traditional cardiovascular risk markers and may enhance atheroma progression. This study was designed to examine whether the worse cardiovascular outcomes associated with renal dysfunction measured by cystatin C were due to accelerated progression of atherosclerosis or to other factors such as plaque destabilization and rupture in postmenopausal women.
Methods
The Women’s Angiographic Vitamin and Estrogen (WAVE) trial was a National Heart, Lung, and Blood Institute–sponsored, randomized, double-blind, placebo-controlled clinical trial examining the effects of hormone replacement therapy and antioxidant vitamins, alone or in combination, on the progression of coronary atherosclerosis measured by quantitative coronary angiography in postmenopausal women. Study design and main results have been previously reported. The institutional review board of each clinical site approved the study.
Postmenopausal women were recruited from 7 clinical centers in the United States and Canada from July 1997 to August 1999. The postmenopausal state was defined as (1) bilateral oophorectomy, (2) age ≥55 years, or (3) follicle-stimulating hormone level ≥40 mIU/ml. To be enrolled in the study, women had to have clinically driven angiograms showing 15% to 75% stenosis in ≥1 major coronary artery or primary branch that did not require catheter intervention. Major exclusion criteria were the use of hormone replacement therapy within past 3 months; evidence of breast, uterine, or cervical cancer; myocardial infarction (MI) within 4 weeks; previous or planned coronary bypass surgery; uncontrolled diabetes or hypertension; fasting triglyceride >500 mg/dl; creatinine level >2.0 mg/dl; New York Heart Association class IV heart failure or a left ventricular ejection fraction <25%; symptomatic gallstones; and history of bleeding diathesis, pulmonary embolus, hemorrhagic stroke, deep vein thrombosis, or untreated osteoporosis.
Data regarding the prevalence of co-morbidities were collected for the study. Physical examinations and laboratory tests were performed at baseline, at 18-month follow-up, and at the end of the study. Participants were asked for any clinical events or hospitalization during each visit. Documents regarding all events were collected at 6-month intervals. Medical records of women with potential adverse events were reviewed by a central adjudication committee blinded to treatment assignment group to determine the nature of event.
Four hundred twenty-three women were enrolled in the study, of whom 320 (76%) had exit angiograms after a mean follow-up period of 2.8 ± 0.9 years. Quantitative coronary angiography was performed by an independent laboratory (Stanford University, Edwin L. Alderman, MD, director). Details of the conduct of quantitative coronary angiography and the quality assurance methods used have been reported previously. Measurements were carried out on up to 10 proximal epicardial artery segments. Care was taken to obtain as nearly identical views of the segments evaluated at entry as possible. At the baseline angiographic assessment, segments containing no stenosis of as much as 15% were considered normal. Luminal diameter in the diseased and nondiseased segments was measured. The average annualized changes in minimal luminal diameter and average luminal diameter in each segment were calculated per patient and were considered the main angiographic parameters to determine disease progression.
Baseline renal function was determined using 2 methods. Measurement of cystatin C was not a part of the original study protocol. Hence, it was measured on stored blood using the Dako Cystatin C PET kit (Dako North America, Inc., Carpinteria, California). GFR was also estimated using the serum creatinine–based Cockcroft-Gault equation. For this analysis, postmenopausal women were divided into 4 quartiles on the basis of baseline cystatin C levels.
Clinical characteristics as well as clinical and angiographic outcomes were compared in each cystatin C quartile. Continuous variables are expressed as mean ± SD, while dichotomous variables are expressed as percentages. To determine the differences between baseline characteristics, analysis of variance was used for continuous variables and chi-square tests were used for dichotomous variables. Differences in angiographic outcomes, defined as annual changes in minimal luminal diameter and average luminal diameter in the diseased and nondiseased segments, in each cystatin C quartile were compared using analysis of variance. The primary clinical outcome was all-cause mortality and MI. A composite outcome of cardiovascular death and MI as well as the total number of cardiovascular events (a composite outcome of MI, cerebrovascular accident, and congestive heart failure) were also compared between groups. Clinical outcomes were compared between different strata of cystatin C using chi-square tests. Multivariate logistic regression analysis was performed to adjust baseline differences as well as traditional cardiovascular risk factors such as age, diabetes, total and high-density lipoprotein cholesterol, smoking, and systolic blood pressure. Multivariate logistic regression analysis was performed to determine the ability of cystatin C level in predicting clinical events independent of eGFR. SAS version 8 (SAS Institute Inc., Cary, North Carolina) was used for all statistical analysis. A p value <0.05 was considered statistically significant.
Results
Demographics, baseline physical exam characteristics, and laboratory variables are listed in Table 1 . The ranges of cystatin C levels for each quartile were 0.41 to 0.91, 0.92 to 1.09, 1.10 to 1.37, and 1.38 to 3.37 mg/dl, respectively. The mean age of the study participants was 65.01 ± 8.63 years, and 66.3% were Caucasian. Women with cystatin C levels in the highest quartile had lower eGFRs, were older, and were more likely to have histories of congestive heart failure and stroke.
| Variable | Cystatin C Level (mg/dl) | p Value | |||
|---|---|---|---|---|---|
| Quartile 1 (<0.92) (n = 102) | Quartile 2 (0.92–1.09) (n = 99) | Quartile 3 (1.10–1.37) (n = 102) | Quartile 4 (>1.37) (n = 96) | ||
| Age (yrs) | 61.38 ± 8.62 | 62.63 ± 7.76 | 67.34 ± 7.76 | 68.86 ± 8.12 | <0.001 |
| Caucasian | 73% (74/102) | 62% (61/99) | 65% (66/102) | 66% (63/96) | 0.410 |
| Diabetes mellitus | 36% (36/101) | 35% (35/99) | 38% (38/101) | 34% (33/96) | 0.971 |
| Hypertension | 72% (73/101) | 72% (71/99) | 82% (83/101) | 78% (75/96) | 0.248 |
| Heart failure | 11% (11/101) | 12% (12/99) | 13% (13/101) | 24% (23/96) | 0.037 |
| MI | 37% (37/101) | 43% (43/99) | 48% (48/101) | 46% (44/96) | 0.421 |
| Previous stroke | 6% (6/101) | 4% (4/99) | 13% (13/101) | 17% (16/96) | 0.0089 |
| Claudication | 14% (14/101) | 14% (14/99) | 9% (9/101) | 18% (17/96) | 0.347 |
| Current smokers | 32% (23/72) | 28% (21/74) | 25% (16/63) | 20% (13/65) | 0.445 |
| Body mass index (kg/m 2 ) | 29.41 ± 5.53 | 30.86 ± 6.09 | 30.90 ± 6.25 | 31.59 ± 6.34 | 0.083 |
| Systolic blood pressure (mm Hg) | 136.60 ± 18.85 | 136.47 ± 18.92 | 140.25 ± 18.67 | 142.26 ± 22.30 | 0.108 |
| Diastolic blood pressure (mm Hg) | 75.40 ± 10.19 | 76.69 ± 10.30 | 75.20 ± 10.21 | 75.71 ± 10.60 | 0.746 |
| C-reactive protein (mg/dl) | 0.49 ± 0.42 | 0.66 ± 0.63 | 0.58 ± 0.57 | 0.66 ± 0.67 | 0.134 |
| Total cholesterol (mg/dl) | 205.19 ± 41.29 | 196.60 ± 42.87 | 198.29 ± 39.29 | 200.08 ± 43.45 | 0.494 |
| Low-density lipoprotein cholesterol (mg/dl) | 112.17 ± 36.44 | 110.81 ± 34.96 | 113.87 ± 36.30 | 113.56 ± 35.63 | 0.930 |
| High-density lipoprotein cholesterol (mg/dl) | 50.43 ± 12.46 | 49.48 ± 13.75 | 49.11 ± 10.45 | 51.48 ± 13.33 | 0.554 |
| Triglyceride (mg/dl) | 177.84 ± 96.63 | 165.95 ± 93.93 | 147.47 ± 80.62 | 147.91 ± 72.66 | 0.033 |
| Glycosylated hemoglobin (%) | 6.77 ± 2.14 | 6.63 ± 1.72 | 6.61 ± 1.67 | 6.44 ± 1.40 | 0.717 |
| Cystatin C (mg/dl) | 0.72 ± 0.15 | 1.01 ± 0.05 | 1.22 ± 0.08 | 1.94 ± 0.71 | <0.001 |
| eGFR (ml/min/1.73 m 2 ) | 97.13 ± 30.34 | 94.01 ± 26.80 | 82.52 ± 27.37 | 71.41 ± 24.06 | <0.001 |
| Medications | |||||
| Anticlotting agents | 84% (86/102) | 91% (89/98) | 90% (92/102) | 90% (86/96) | 0.440 |
| Dihydropyridine | 18% (18/102) | 13% (13/98) | 18% (18/102) | 13% (12/96) | 0.624 |
| Angiotensin-converting enzyme inhibitors | 39% (39/101) | 35% (34/98) | 41% (42/102) | 47% (45/96) | 0.368 |
| β blockers | 62% (63/102) | 65% (64/98) | 69% (70/102) | 52% (50/96) | 0.095 |
| Calcium channel blockers | 27% (28/102) | 27% (26/98) | 22% (22/102) | 40% (38/96) | 0.038 |
| Insulin | 16% (16/102) | 11% (11/98) | 16% (16/102) | 19% (18/96) | 0.540 |
| Antidiabetic agents | 18% (18/102) | 23% (23/99) | 22% (22/102) | 18% (17/96) | 0.669 |
| Lipid-lowering agents | 62% (63/102) | 57% (56/98) | 55% (56/102) | 58% (56/96) | 0.794 |
| Antioxidants | 50% (51/102) | 46% (46/99) | 48% (48/101) | 53% (51/96) | 0.794 |
| Hormone replacement therapy | 42% (43/102) | 52% (51/99) | 57% (58/102) | 49% (47/96) | 0.206 |
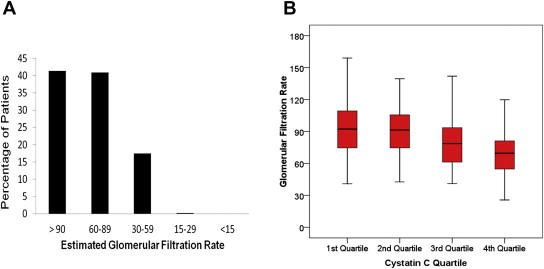
The mean eGFR was 86.52 ± 29.3 ml/min/1.73 m 2 , and the mean cystatin C level was 1.21 ± 0.57 mg/dl. Table 2 lists the distribution of chronic kidney disease stages and cystatin C levels in the study population. Figure 1 shows the distribution of eGFR in cystatin C quartiles. It is important to note that women with creatinine levels >2.0 mg/dl were excluded from the study, rendering only 17.7% of the women in the study with GFRs <60 ml/min/1.73 m 2 . Even in the highest quartile of cystatin C (>1.37 mg/dl), only 36% of patients had GFRs <60 ml/min/1.73 m 2 .
| eGFR (ml/min/1.73 m 2 ) | Cystatin C Level (mg) | Cystatin C (mg/dl) | |||
|---|---|---|---|---|---|
| Quartile 1 (0.41–0.91) (n = 100) | Quartile 2 (0.92–1.09) (n = 99) | Quartile 3 (1.10–1.36) (n = 98) | Quartile 4 (1.37–3.37) (n = 95) | ||
| >90 | 57 | 54 | 34 | 18 | 1.07 ± 0.47 |
| 60–89 | 36 | 40 | 43 | 41 | 1.21 ± 0.52 |
| 30–59 | 7 | 5 | 21 | 35 | 1.56 ± 0.77 |
| 15–29 | 0 | 0 | 0 | 1 | 1.67 |
| <15 | 0 | 0 | 0 | 0 | — |
| Mean ± SD | 97.14 ± 20.34 | 94.01 ± 26.80 | 82.53 ± 27.38 | 71.41 ± 24.06 | |
As listed in Table 3 , annualized changes in minimal luminal diameter and average luminal diameter for diseased and nondiseased segments were similar in each quartile. The rate of the composite end point of all-cause mortality and MI was significantly increased in the highest cystatin C quartile. Similarly, composite outcomes of cardiovascular death and MI as well as cardiovascular events were significantly higher in women with cystatin C levels in the highest quartile ( Table 3 ).
| Variable | Cystatin C Level (mg/dl) | p Value | |||
|---|---|---|---|---|---|
| Quartile 1 (<0.92) | Quartile 2 (0.92–1.09) | Quartile 3 (1.10–1.37) | Quartile 4 (>1.37) | ||
| Nondiseased segment atherosclerosis progression | |||||
| MLD at baseline (mm) | 2.55 ± 0.59 | 2.66 ± 0.55 | 2.70 ± 0.57 | 2.65 ± 0.70 | 0.556 |
| MLD at follow-up (mm) | 2.52 ± 0.54 | 2.62 ± 0.57 | 2.71 ± 0.61 | 2.60 ± 0.56 | 0.283 |
| Annual change in MLD (mm) | −0.0112 ± 0.109 | −0.0101 ± 0.111 | 0.0035 ± 0.090 | −0.0175 ± 0.219 | 0.834 |
| ALD at baseline (mm) | 2.75 ± 0.62 | 2.86 ± 0.56 | 2.88 ± 0.60 | 2.85 ± 0.71 | 0.624 |
| ALD at follow-up (mm) | 2.71 ± 0.56 | 2.83 ± 0.59 | 2.91 ± 0.64 | 2.81 ± 0.57 | 0.285 |
| Annual change in ALD (mm) | −0.0138 ± 0.124 | −0.0101 ± 0.117 | 0.0147 ± 0.095 | −0.0144 ± 0.229 | 0.638 |
| Diseased segment atherosclerosis progression | |||||
| MLD at baseline (mm) | 1.94 ± 0.54 | 2.03 ± 0.52 | 2.03 ± 0.47 | 1.98 ± 0.42 | 0.563 |
| MLD at follow-up (mm) | 1.88 ± 0.46 | 1.97 ± 0.61 | 1.98 ± 0.49 | 1.89 ± 0.45 | 0.541 |
| Annual change in MLD (mm) | −0.0404 ± 0.159 | −0.0381 ± 0.139 | −0.0260 ± 0.151 | −0.0374 ± 0.146 | 0.934 |
| ALD at baseline (mm) | 2.43 ± 0.60 | 2.54 ± 0.54 | 2.54 ± 0.51 | 2.51 ± 0.47 | 0.541 |
| ALD at follow-up (mm) | 2.42 ± 0.54 | 2.51 ± 0.60 | 2.52 ± 0.47 | 2.45 ± 0.48 | 0.569 |
| Annual change in ALD (mm) | −0.0184 ± 0.150 | −0.0187 ± 0.101 | 0.0086 ± 0.125 | −0.0239 ± 0.168 | 0.924 |
| Clinical events | |||||
| All-cause death and MI | 5.88% (6/102) | 2.02% (2/99) | 2.94% (3/102) | 15.63% (15/96) | 0.0003 |
| Cardiovascular death and MI | 2.94% (3/102) | 2.02% (2/99) | 1.96% (2/102) | 13.54% (13/96) | 0.0002 |
| Cardiovascular events | 3.92% (4/102) | 3.03% (3/99) | 3.92% (4/102) | 13.54% (13/96) | 0.0052 |
There was a prominent increase in adverse clinical events in the highest cystatin C quartile compared with the lower 3 quartile, regardless of a significant difference in the change of luminal narrowing ( Table 4 ). Hence, multivariate regression analysis for clinical events was performed between women with cystatin C levels in the highest quartile and those with levels in the lower 3 quartiles ( Table 5 ). The unadjusted odds ratio for the primary end points of all-cause mortality and MI was significantly greater with cystatin C in the highest quartile (4.91). The odds ratio remained statistically significant after adjustment for baseline differences and traditional cardiovascular risk markers (3.70). Cardiovascular death and MI were also significantly higher in the highest cystatin C quartile after adjustment for baseline differences as well as traditional cardiovascular risk factors. Moreover, clinical events remained significantly higher among postmenopausal women with cystatin C levels in the highest quartile after body mass index as well as the use of antioxidants and hormone replacement therapy during the follow-up were period added to the multivariate model ( Table 5 ). When cystatin C and eGFR were added to the multivariate logistic regression model, cystatin C emerged as an independent predictor of clinical events.


