There are limited data on reference values of left atrial volume indexes (LAVIs) in adults without known cardiovascular disease or risk factors, as well as their stratification by age, gender, and diastolic stage. LAVIs were calculated using the biplane area-length method in accordance with guidelines in 966 consecutive patients (mean age 48.0 ± 15.7 years) with no known cardiovascular disease or risk factors, with preserved left ventricular systolic function and normal or grade I diastolic dysfunction (DD). The mean LAVI was 23 ± 8 ml/m 2 . Using a conventional cut-off value of 34 ml/m 2 (mean + 2 SDs of the values derived from the guidelines) to define abnormal LAVI would label about 10% of patients as having dilated left atria and structural heart disease, whereas using the American Society of Echocardiography’s recommended cutoff of the mean + 1 SD (i.e., 28 ml/m 2 ) would do so for up to about 20%. The mean LAVI was similar between the genders (p = 0.10) and among different age groups (p = 0.60 for the trend across decades). Finally, when stratified by diastolic function, the mean LAVIs were 23.2 ± 8.3 and 22.2 ± 8.7 ml/m 2 for patients with normal (n = 653) and grade I DD (n = 313), respectively (p = 0.10). In conclusion, in this cohort of patients without known cardiovascular disease or risk factors, the cut-off values for abnormal LAVI were greater than those adopted in the guidelines. There was no variation, however, by gender, age, or grade I DD, although subjects with long-standing grade I DD and/or high filling pressures were likely underrepresented.
The left atrium acts as a contractile pump, reservoir, and conduit. Increased left atrial (LA) size has been associated with higher incidence of atrial fibrillation, stroke, congestive heart failure, diastolic dysfunction (DD), hospitalization, and death. It is a marker of the severity and chronicity of DD, as well as LA pressure. The strength of the association between LA size and outcomes is strongest with LA volume index (LAVI) rather than linear dimensions. Normal reference values have been adopted by the American Society of Echocardiography (ASE) on the basis of 4 publications, 2 of which were by the same investigators. The largest of these studies (n = 140) used the biplane area-length method to calculate LAVI, whereas the other 3 used disc methods with similar results. However, the adopted reference values have been called into question given the small numbers of patients and differing measurement methods. There are also limited data evaluating the effect of aging on LAVI. In addition, the effect of impaired left ventricular (LV) relaxation or grade I DD on LA size has been a subject of debate. Although the current ASE guidelines state in the text that LAVI can be within normal limits in patients with grade I DD, the diagram on page 127 (Figure 16) gives the impression that LAVI ≥34 ml/m 2 (2 SDs above the reference mean) is required to classify a patient as having grade I DD. Hence, we sought to determine the reference values of LAVI in a relatively large cohort of adult patients without known cardiovascular disease or risk factors and to assess the impacts of age, gender, and DD (in particular normal diastolic function vs grade I DD) on the reference values and compare them with those adopted in the guidelines.
Methods
The study cohort consisted of consecutive patients who underwent outpatient echocardiography and had LV ejection fractions (LVEFs) ≥55% at the Cleveland Clinic or its satellite facilities from January 1, 1996 to December 31, 2005. These data were derived from a previous study of diastolic function, and the original data set was used. There were 21,666 patients with normal LVEFs, mild or no significant valvular disease, and available body mass index values in whom diastolic function was assessed. Because the aim of the study was to determine reference values for LAVI in “low-risk adults,” we excluded 20,627 patients with documented known cardiovascular disease, risk factors, and co-morbidities (i.e., coronary artery disease, atrial fibrillation, congestive heart failure symptoms, peripheral vascular disease, transient ischemic attack, stroke, chronic obstructive pulmonary disease, chronic kidney disease, diabetes mellitus, hypertension, smoking, overweight or obesity, malignancy, right ventricular dysfunction or pulmonary hypertension, hypertrophic cardiomyopathy, congenital heart disease, liver disease, anemia, and bleeding). We also excluded patients taking antihypertensive or congestive heart failure medications. There were 11 patients, however, who were started on β blockers after echocardiography for symptomatic palpitations and were left in the analysis. Of the remaining 1,039 patients, we excluded an additional 73 patients (55 in whom we could not retrieve the echocardiograms and 18 with grade II DD). There were 966 patients left for analysis, 653 with normal diastolic function and 313 with grade I DD.
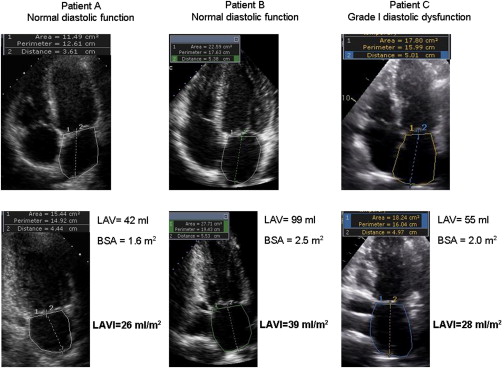
Images were obtained with patients in the left lateral decubitus position using commercially available systems, per standard protocol. LV systolic function was assessed predominately qualitatively by visual evaluation of the LVEF (and with semiquantification, more commonly used at the end of the study period) in accordance with published guidelines. LV mass was calculated using the formula LV mass (g) = 0.8 × {1.04 [(LV internal diastolic dimension + posterior wall diastolic thickness + interventricular septal thickness) 3 − (LV internal diastolic dimension) 3 ]} + 0.6 g; LV mass index was calculated as LV mass/height 2.7 . LA areas and volumes were remeasured by the study investigators, and LAVIs were calculated using the biplane area-length method (most commonly used at our institution) in accordance with the guidelines ( Figure 1 ). Specifically, at the end of LV systole and before the opening of the mitral valve, the area of the left atrium was obtained from the 4- and 2-chamber apical views; special care was made not to foreshorten the chambers, and the LA appendage and pulmonary veins were excluded from the tracing.
Diastolic function was assessed at our institution in a standardized method, in accordance with published and relevant guidelines, using a combination of echocardiographic variables, including transmitral inflow pattern, pulmonary venous flow pattern, and, beginning in the late 1990s and almost uniformly after 2001, mitral annular velocities assessed using tissue Doppler imaging. Diastolic function was then labeled as normal or abnormal (DD). DD was then categorized as mild (grade I, impaired relaxation), moderate (grade II, pseudonormal), or severe (grade III, restrictive).
Patients’ heights, weights, and systolic and diastolic blood pressures were measured by the sonographers at the time of echocardiogram acquisition. All echocardiograms were interpreted by experienced and board-certified readers. The interobserver agreement of reproducibility and DD classification extrapolated from our ongoing quality assurance effort in our imaging core laboratory was on average 83%, and intraobserver agreement was 94%. In this instance, because all patients with DD had grade I DD (there were none with grade III DD, and those with grade II DD [n = 18] were excluded), there was less room for variability in interpreting the presence and grade of DD.
Clinical data were obtained from review of the electronic medical records from a period starting 6 months before the first echocardiographic examinations and ending 6 months afterward. The indications for echocardiography were retrieved through chart review ( Table 1 ). Clinical diagnoses of co-morbidities and cardiovascular risk factors were established by reviewing records documented by a health care provider in an electronic medical record system (EpicCare; Epic Systems Corporation, Madison, Wisconsin) that was linked to relevant International Classification of Diseases, Ninth Revision, codes, as previously described.
| Variable | Value |
|---|---|
| Age (yrs) | 48.0 ± 15.7 |
| Women | 702 (73%) |
| Caucasians | 742 (77%) |
| African-Americans | 181 (19%) |
| Hispanics, Asians, and Native Americans | 43 (4%) |
| Body mass index (kg/m 2 ) | 22.4 ± 1.7 |
| Body surface area (m 2 ) | 1.7 ± 0.2 |
| Systolic blood pressure (mm Hg) | 120 ± 11 |
| Diastolic blood pressure (mm Hg) | 75 ± 7 |
| Serum creatinine (mg/dl) | 0.84 ± 0.20 |
| Total cholesterol (mg/dl) | 217 ± 48 |
| Low-density lipoprotein (mg/dl) | 118 ± 33 |
| High-density lipoprotein (mg/dl) | 53 ± 8 |
| Triglyceride (mg/dl) | 88 ± 17 |
| Hemoglobin (mg/dl) | 14 ± 1 |
| Aspirin use | 20 (2.1%) |
| β-blockers use | 11 (1.1%) |
| Statin use | 19 (2%) |
| LVEF (%) | 58.5 ± 3.3 |
| LV end-diastolic diameter/height (mm/m) | 26 ± 0.4 |
| LV end-systolic diameter/height (mm/m) | 16 ± 3 |
| LV mass (g) | 171 ± 70 |
| LV mass/height 2.7 (g/m 2.7 ) | 43 ± 19 |
| LA diameter (cm) | 3.2 ± 0.5 |
| LA area, 4-chamber view (cm 2 ) | 14.1 ± 3.6 |
| LA area, 2-chamber view (cm 2 ) | 14.2 ± 3.8 |
| LA volume (ml) | 39.2 ± 14.7 |
| LAVI (ml/m 2 ) | 22.8 ± 8.4 |
| Right ventricular systolic pressure (mm Hg) | 19 ± 5 |
| Assessment of LVEF | 309 (32%) |
| Chest pain | 341 (35%) |
| Heart murmur | 124 (13%) |
| Abnormal electrocardiographic findings/palpitations | 142 (15%) |
| Dizziness | 50 (5%) |
Hypertension was defined as systolic blood pressure ≥140 mm Hg or diastolic blood pressure ≥90 mm Hg at the time of echocardiography or clinic visit, self-reported history of hypertension, or the use of antihypertensive medications. Diabetes mellitus was defined as fasting glucose ≥126 mg/dl, self-reported history, or the use of hypoglycemic medications. Chronic kidney disease was defined as a glomerular filtration rate <60 ml/min using the Modification of Diet in Renal Disease (MDRD) formula. Body mass index was calculated using the standard formula as weight in kilograms divided by the square of height in meters, and patients were classified as normal weight (<25 kg/m 2 ), overweight (25 to 29.9 kg/m 2 ), or obese (≥30 kg/m 2 ). Body surface area was calculated using the Mosteller formula: body surface area (m 2 ) = {[height (m) × weight (kg)]/36} 0.5 . The study was approved by the Cleveland Clinic institutional review board, with a waiver of the requirement for informed consent, and was in compliance with the Declaration of Helsinki.
Continuous data were compared using unpaired Student’s t tests or Wilcoxon’s rank tests as appropriate and are expressed as mean ± SD. Categorical data were compared using chi-square or Fisher’s exact tests as appropriate and are expressed as frequencies and percentages. Linear regression was used to assess the correlation between LAVI and age. All statistical tests were 2 sided. A p value <0.05 was set a priori and considered statistically significant. All statistical analyses were performed using SPSS version 11.5 for Windows (SPSS, Inc., Chicago, Illinois).
Results
There were 966 patients (mean age 48.0 ± 15.7 years, 73% women), with normal body mass indexes and blood pressures ( Table 1 ). Patients were not taking any cardiac medications, except for about 1% who were taking β blockers for palpitations (starting after echocardiography) and 2% who were taking aspirin and statins for primary prevention. Echocardiographic parameters and indications for testing are listed in Table 1 .
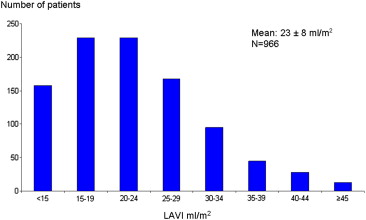
The mean LAVI was 22.8 ± 8.4 ml/m 2 , and the corresponding distribution is illustrated in Figure 2 . Using a conventional cut-off value of 34 ml/m 2 (mean + 2 SDs of the values derived from the guidelines) to define abnormal LAVI would label about 10% of patients without cardiovascular disease or risk factors as having dilated left atria (compared with a cut-off value of 39.6 ml/m 2 derived from our cohort), whereas using the more stringent ASE-recommended cut-off of the mean + 1 SD (i.e., 28 ml/m 2 ) would do so for about 20% of patients.
There was no significant difference in mean LAVI between women and men (23.1 ± 8.5 and 22.2 ± 8.2 ml/m 2 , respectively, p = 0.10; Figure 3 ) or among different races (p = 0.90). Also, there was no difference in LAVI among different age groups (p = 0.60 for the trend, R = −0.002, p = 0.96; Figure 4 ), although the prevalence of DD increased significantly with age (p <0.001). In addition, stratification by diastolic function was performed. There were 653 patients with normal diastolic function and 313 with grade I DD. There was no significant difference in LAVI between patients with normal diastolic function and those with DD (23.2 ± 8.3 vs 22.2 ± 8.7 ml/m 2 , respectively, p = 0.10; Figure 5 ); results were similar when stratified by gender.


