Proprotein convertase subtilisin/kexin type 9 (PCSK9) is a key regulator of serum low-density lipoprotein cholesterol levels. Although statins increase serum PCSK9 levels, the effects of different types of statins on the serum PCSK9 levels have not been examined in detail. The purpose of the present study was to compare the effects of pitavastatin versus pravastatin on the serum PCSK9 levels. A total of 164 patients with coronary artery disease who were not receiving lipid-lowering therapy were randomly assigned to receive either 4 mg/day of pitavastatin (intensive lipid-lowering therapy) or 20 mg/day of pravastatin (moderate lipid-lowering therapy). The serum PCSK9 levels were measured before statin treatment and 8 months after therapy. A significantly greater reduction in low-density lipoprotein cholesterol was observed in the pitavastatin group (−41% vs −28%, p = 0.0001). The serum levels of total PCSK9 and heterodimer PCSK9 significantly increased from 192 to 249 ng/ml (37%, p <0.0001) and 147 to 206 ng/ml (78%, p <0.0001) in the pitavastatin group and from 192 to 249 ng/ml (39%, p <0.0001) and 143 to 201 ng/ml (65%, p <0.0001) in the pravastatin group, respectively. The increase in total and heterodimer PSCK9 did not differ between the 2 groups. No significant correlations were found between the percentage of changes in heterodimer PCSK9 and changes in the various lipid parameters in either group. In conclusion, significant increases in the total and heterodimer PSCK9 levels were observed at 8 months after treatment with pitavastatin and pravastatin; however, these increases did not differ between the 2 statins.
Proprotein convertase subtilisin/kexin type 9 (PCSK9) is a key regulator of serum low-density lipoprotein (LDL) cholesterol levels. PCSK9 is secreted by the liver into the plasma and binds the hepatic LDL receptors, causing their subsequent degradation. Although the mechanism by which PCSK9 degrades LDL receptors is extremely complex, this process reduces the capacity of the liver to bind LDL cholesterol and remove it, resulting in increased LDL cholesterol levels. It has been reported that statins upregulate PCSK9 mRNA expression and increase circulating PCSK9 levels. These observations explain the “rule of 6%” for statins, which indicates that each doubling of the statin dose results in only an approximate 6% additional reduction in LDL cholesterol levels. However, the effects of different types of statins on serum PCSK9 levels have not been examined in detail. Therefore, we compared the effects of pitavastatin versus pravastatin on the serum PCSK9 levels in statin-naive patients with coronary artery disease.
Methods
The present observational longitudinal study compared the intensive lipid-lowering effects of pitavastatin with the moderate lipid-lowering effects of pravastatin on serum PCSK9 levels. The results were obtained during the Treatment With Statin on Atheroma Regression Evaluated by Intravascular Ultrasound With Virtual Histology (TRUTH) study. The TRUTH study was a prospective, open-labeled, randomized, multicenter trial performed at 11 Japanese centers to compare the effects of 8 months of treatment with pitavastatin versus pravastatin on coronary atherosclerosis using virtual histology-intravascular ultrasound. In brief, 164 patients with angina pectoris who were not receiving lipid-lowering therapy were randomly treated with either pitavastatin (4 mg/day, intensive lipid-lowering group) or pravastatin (20 mg/day, moderate lipid-lowering group).
The patients were included in the present study if they fulfilled the following criteria: the allocated statins were continued during the study period (8 months), and an adequate serum volume was available in frozen samples for the required measurements. A total of 101 patients met the inclusion criteria.
The TRUTH study was conducted in accordance with the Declaration of Helsinki and with the approval of the ethical committees of the 11 participating institutions. Each patient enrolled in the present study provided written informed consent.
The serum lipid levels and inflammatory markers were measured before treatment (baseline) and at the 8-month follow-up point. The serum PCSK9 levels in the conserved frozen samples obtained before treatment and at the 8-month follow-up point were annually measured by a central laboratory (BML, Kawagoe, Japan) using sandwich enzyme-linked immunosorbent assays.
Statistical analysis was performed using StatView, version 5.0 (SAS Institute, Cary, North Carolina). The results are expressed as the mean ± SD. Unpaired Student’s t tests were used to compare the normally distributed continuous variables between the 2 groups, and Mann-Whitney U tests were used when normal distributions were not observed. Paired Student’s t tests were also used to compare the normally distributed continuous variables within each group, and the Wilcoxon signed rank-sum tests were used when the variables were not normally distributed. The categorical variables between the 2 groups were compared using chi-square tests or Fisher’s exact tests. Univariate regression analyses were performed to assess the relation between the percentage of changes in heterodimer PCSK9 and the various lipid parameters. Statistical significance was set at p <0.05.
Results
The baseline characteristics of the subjects are listed in Table 1 . Pitavastatin was used to treat 51 patients (50%) and pravastatin to treat 50 patients (50%). No differences in the baseline characteristics were found between the 2 groups, except for the frequency of calcium channel blocker use.
| Variable | Pitavastatin (n = 51) | Pravastatin (n = 50) | p Value |
|---|---|---|---|
| Age (yrs) | 66 ± 9 | 67 ± 10 | 0.59 |
| Men | 45 (88%) | 39 (78%) | 0.17 |
| Body mass index (kg/m 2 ) | 24.3 ± 3.6 | 24.3 ± 3.3 | 0.97 |
| Status of coronary artery disease | 0.88 | ||
| Stable angina pectoris | 36 (71%) | 36 (72%) | |
| Unstable angina pectoris | 15 (29%) | 14 (28%) | |
| Hypertension | 31 (61%) | 35 (70%) | 0.33 |
| Diabetes mellitus | 20 (39%) | 25 (50%) | 0.28 |
| Family history of coronary artery disease | 5 (10%) | 5 (10%) | 0.97 |
| Smoker | 18 (35%) | 17 (34%) | 0.73 |
| Angiotensin-converting enzyme inhibitors or angiotensin-receptor blockers | 25 (49%) | 30 (60%) | 0.27 |
| Calcium channel blockers | 20 (39%) | 34 (68%) | 0.004 |
| β blockers | 6 (12%) | 4 (8%) | 0.53 |
The serum LDL cholesterol levels were significantly decreased in both groups, with a significantly greater reduction observed in the pitavastatin group (−41% vs −28%, p = 0.0001). The mean LDL cholesterol levels at the 8-month follow-up point were significantly lower in the pitavastatin group. The serum levels of apolipoprotein B and small, dense LDL were significantly decreased in both groups. Furthermore, the high-density lipoprotein cholesterol levels and high-sensitivity C-reactive protein levels were significantly increased and decreased, respectively, in both groups. However, at the 8-month follow-up point, these levels did not differ between the 2 groups ( Table 2 ).
| Variable | Pitavastatin (n = 51) | Pravastatin (n = 50) | p Value Between Groups | |||||
|---|---|---|---|---|---|---|---|---|
| Baseline | Follow-Up | p Value | Baseline | Follow-Up | p Value | Baseline | Follow-Up | |
| Total cholesterol (mg/dl) | 196 ± 31 | 145 ± 26 | <0.0001 | 207 ± 37 | 170 ± 23 | <0.0001 | 0.11 | <0.0001 |
| Change (%) | −25 ± 13 | −17 ± 11 | — | 0.0006 | ||||
| Low-density lipoprotein cholesterol (mg/dl) | 123 ± 24 | 72 ± 21 | <0.0001 | 135 ± 35 | 95 ± 23 | <0.0001 | 0.047 | <0.0001 |
| Change (%) | −41 ± 15 | −28 ± 15 | — | 0.0001 | ||||
| Triglycerides (mg/dl) | 128 ± 75 | 106 ± 56 | 0.04 | 129 ± 56 | 125 ± 71 | 0.7 | 0.94 | 0.16 |
| Change (%) | −9 ± 42 | 3 ± 48 | — | 0.18 | ||||
| High-density lipoprotein cholesterol (mg/dl) | 47 ± 12 | 51 ± 14 | 0.007 | 46 ± 11 | 51 ± 12 | 0.01 | 0.83 | 0.85 |
| Change (%) | 10 ± 21 | 12 ± 27 | — | 0.72 | ||||
| Apolipoprotein A-I (mg/dl) | 118 ± 21 | 131 ± 25 | <0.0001 | 118 ± 20 | 132 ± 26 | <0.0001 | 0.9 | 0.87 |
| Change (%) | 12 ± 17 | 13 ± 20 | — | 0.87 | ||||
| Apolipoprotein B (mg/dl) | 99 ± 19 | 66 ± 17 | <0.0001 | 107 ± 27 | 80 ± 16 | <0.0001 | 0.06 | <0.0001 |
| Change (%) | −32 ± 15 | −24 ± 13 | — | 0.004 | ||||
| Lipoprotein (a) (mg/dl) | 19 ± 13 | 24 ± 26 | 0.02 | 19 ± 14 | 24 ± 25 | 0.01 | 0.94 | 0.96 |
| Change (%) | 27 ± 57 | 20 ± 49 | — | 0.5 | ||||
| High-sensitivity C-reactive protein (ng/ml) | 15,859 ± 40,903 | 2,673 ± 5,147 | 0.02 | 9,367 ± 16,055 | 2,674 ± 5,710 | 0.001 | 0.3 | 0.99 |
| Change (%) | −36 ± 120 | −43 ± 83 | — | 0.74 | ||||
| Platelet-activating factor acetylhydrolase (μg/ml) | 1.60 ± 0.49 | 1.09 ± 0.38 | <0.0001 | 1.56 ± 0.59 | 1.24 ± 0.42 | <0.0001 | 0.74 | 0.07 |
| Change (%) | −30 ± 17 | −18 ± 17 | — | 0.0005 | ||||
| High-density lipoprotein platelet-activating factor acetylhydrolase (ng/ml) | 210 ± 92 | 144 ± 70 | <0.0001 | 204 ± 108 | 155 ± 66 | <0.0001 | 0.76 | 0.4 |
| Change (%) | −27 ± 32 | −15 ± 34 | — | 0.07 | ||||
| Oxidized low-density lipoprotein (U/ml) | 12.0 ± 8.8 | 11.5 ± 10.7 | 0.7 | 11.6 ± 8.3 | 9.5 ± 6.2 | 0.04 | 0.8 | 0.28 |
| Change (%) | 15 ± 158 | −7 ± 36 | — | 0.35 | ||||
| Small dense low-density lipoprotein (mg/dl) | 23.4 ± 11.2 | 16.5 ± 8.3 | 0.0003 | 28.2 ± 15.9 | 21.0 ± 9.4 | 0.0002 | 0.08 | 0.01 |
| Change (%) | −18 ± 54 | −16 ± 34 | — | 0.84 | ||||
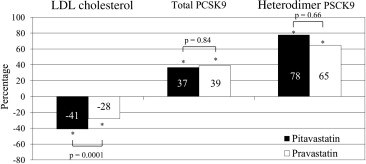
The serum PCSK9 levels before treatment and at the 8-month follow-up point are listed in Table 3 . Significant increases in the total and heterodimer PCSK9 levels were observed in both groups (pitavastatin 37%, p <0.0001, and 78%, p <0.0001; and pravastatin 39%, p <0.0001 and 65%, p <0.0001, respectively). The serum free-fragment PCSK9 levels showed no significant changes in either group. A slightly greater increase in the heterodimer PCSK9 levels was observed in the pitavastatin group; however, this increase was not statistically significant ( Figure 1 ).
| Variable | Pitavastatin (n = 51) | Pravastatin (n = 50) | p Value Between Groups | |||||
|---|---|---|---|---|---|---|---|---|
| Baseline | Follow-Up | p Value | Baseline | Follow-Up | p Value | Baseline | Follow-Up | |
| Total (ng/ml) | 192 ± 65 | 249 ± 84 | <0.0001 | 192 ± 67 | 249 ± 81 | <0.0001 | 0.99 | 0.99 |
| Change (%) | 37 ± 46 | 39 ± 51 | — | 0.84 | ||||
| Heterodimer (ng/ml) | 147 ± 64 | 206 ± 85 | <0.0001 | 143 ± 57 | 201 ± 75 | <0.0001 | 0.73 | 0.75 |
| Change (%) | 78 ± 180 | 65 ± 115 | — | 0.66 | ||||
| Free fragment (ng/ml) | 45 ± 29 | 43 ± 22 | 0.63 | 49 ± 34 | 47 ± 31 | 0.8 | 0.53 | 0.4 |
| Change (%) | 21 ± 82 | 24 ± 89 | — | 0.84 | ||||