There is a lack of clarity concerning the clinical implications of myocardial injury occurring after transcatheter aortic valve implantation (TAVI) procedures. The aim of this study was to determine the incidence, degree, and timing of myocardial injury associated with TAVI procedures and to evaluate its 1-year prognostic value. Among 68 consecutive patients (mean age 80.9 ± 6.4 years) treated with TAVI, 3 patients who died within 24 hours, precluding cardiac biomarker measurements, and 3 patients with major procedural complications were excluded. Cardiac troponin I, creatine kinase-MB, and creatinine levels were determined at baseline and 6, 12, 24, 48, and 72 hours after TAVI. All complications were defined according to the Valve Academic Research Consortium. Myocardial injury was observed in all patients (n = 62), as determined by an increase in cardiac troponin I (median peak at 12 hours 3.8 μg/L, interquartile range 1.8 to 25.67), and a higher degree of myocardial injury was observed in patients (n = 9) who developed acute kidney injury (AKI) (p = 0.026). Periprocedural myocardial infarction was not found. At 1-year follow-up, 5 patients had died, and 7 patients had been hospitalized for heart failure. The development of AKI, not the degree of peak cardiac troponin I (p = 0.348), was identified as the only strong independent predictor of 1-year mortality from any cause (including heart failure) after TAVI (hazard ratio 4.74, 95% confidence interval 1.12 to 20.03, p = 0.034). In conclusion, TAVI was systematically associated with myocardial injury, occurring with a higher degree in patients who developed AKI. However, the simultaneous development of AKI occurring after TAVI is the strongest predictor of 1-year mortality.
Transcatheter aortic valve implantation (TAVI) procedures are frequently associated with some degree of myocardial injury. Several mechanisms may explain the occurrence of myocardial damage after TAVI. The myocardial tissue compression caused by the balloon and valve prosthesis as well as several short episodes of extreme hypotension and global ischemia (balloon valvuloplasty, valve implantation) might induce some degree of myocardial injury. In addition, coronary embolism and the rare occurrence of coronary ostia occlusion after TAVI might induce myocardial injury. Although the association with worse outcomes of myocardial injury occurring during percutaneous coronary intervention or cardiac surgery has been extensively shown, the significance of myocardial injury after TAVI is not fully clarified. Importantly, most reports on TAVI to date have not provided a definition of periprocedural myocardial infarction, and some studies have used arbitrary definitions of periprocedural myocardial infarction or the same definition as used for spontaneous myocardial infarction. Moreover, it has been well demonstrated that elevated cardiac troponin level, as a marker of myocardial injury, and its change (increase) remains an important prognostic factor despite the presence of renal dysfunction. However, the significance of myocardial injury in patients developing acute kidney injury (AKI) after TAVI remains to be elucidated. In this study, we sought (1) to determine the incidence, degree, and timing of the increases in serum markers of myocardial injury (cardiac troponin I [cTnI] and creatine kinase-MB [CK-MB]) associated with uncomplicated TAVI and (2) to evaluate the 1-year prognostic value of myocardial injury associated with TAVI using the Valve Academic Research Consortium (VARC) definitions of complications.
Methods
The study population consisted of 68 consecutive patients who underwent TAVI for severe symptomatic aortic stenosis with valve area <1 cm 2 . Eligibility for TAVI was established by consensus of a local multidisciplinary team, including clinical cardiologists, cardiac surgeons, and cardiac anesthesiologists. Patients who died <24 hours after TAVI, precluding cardiac biomarker measurements (n = 3: 1 with cardiac tamponade, 1 with life-threatening arrhythmias, and 1 with failure to implant the CoreValve Revalving System [Medtronic, Inc., Minneapolis, Minnesota]), and those with major procedural complications (n = 3: 1 with stroke, 1 with lung failure, and 1 with irreversible shock) were excluded. Thus, 62 patients with TAVI were included in a prospective database, and procedural characteristics were recorded. According to the VARC definitions, patients were divided into those with and those without AKI occurring after TAVI. The decision of whether to revascularize a coronary vessel with an obstructive coronary lesion (70% diameter stenosis on visual estimation) before TAVI depended on the criteria of the physician responsible for the patient and the TAVI team. Electrocardiography was performed <24 hours before TAVI, immediately after the procedure, and at hospital discharge. All electrocardiograms were evaluated for the purpose of the study by a cardiologist blinded to clinical data. All patients had continuous electrocardiographic monitoring until hospital discharge. Complete 2-dimensional echocardiography was performed before the procedure, immediately after the procedure, and at hospital discharge. All procedures were performed under a compassionate clinical program approved by Careggi Hospital, and all patients provided signed informed consent for the procedures.
The CoreValve aortic valve prosthesis consists of a porcine pericardial tissue valve, mounted and sutured in a self-expanding nitinol stent. Three sizes are available (26, 29, and 31 mm) for aortic valve annular sizes of 20 to 29 mm. Transfemoral and subclavian procedures were performed with an 18Fr delivery catheter. Our center adopted a policy of using the transfemoral approach first, with criteria for the use of subclavian approaches that were based on the size and degree of tortuosity, calcification, and atheroma of the aortoiliofemoral arterial tree, as evaluated by the systematic and integrated evaluation from angiographic, multislice computed tomographic, and echocardiographic assessment. Vascular access was obtained through the subclavian artery in 3 patients and the common femoral artery in the remaining patients. The procedure was performed with the patient under general anesthesia in the case of the subclavian approach and under conscious sedation in most transfemoral cases. Balloon valvuloplasty was performed before device placement. During balloon valvuloplasty, rapid ventricular pacing was used to decrease forward ejection force. Correct positioning of the device was confirmed by fluoroscopy. Aortography and transthoracic echocardiography were performed at baseline and after valve placement to assess paravalvular regurgitation, and aortography was used to ensure coronary and/or bypass graft patency. Femoral access was closed percutaneously (Prostar XL; Abbott Laboratories, Abbott Park, Illinois), and subclavian access was closed surgically. After the procedure, the patient was transferred to the intensive care unit. All patients received aspirin (100 to 325 mg/day) and clopidogrel (600-mg loading dose, then 75 mg/day) before the procedure and aspirin alone after 3 months of dual therapy.
Blood samples were collected at baseline and 6 to 12, 24, 48, and 72 hours after the procedure. CK-MB and cTnI mass levels were measured at each point time. CK-MB and cTnI measurements were performed by immunochemiluminescence assay using a Centaur XP (Siemens Healthcare, Erlangen, Germany). On the basis of the 99th percentile in a healthy population and the requirement of a 10% coefficient variation, the upper normal limits for cTnI and CK-MB levels in our institution were 0.15 and 3.6 μg/L, respectively. Myocardial injury was defined as a cTnI level >0.15 μg/L or a CK-MB level >3.6 μg/L. In patients with elevated cTnI or CK-MB levels at baseline, myocardial injury was defined as any increase >20% after the procedure. Periprocedural myocardial infarction was identified when all criteria of the VARC definition were satisfied. AKI was identified according VARC criterion as level I, II, or III according to an increase of creatinine value from 150% to 200%, from 200% to 300%, or >300% in comparison with baseline creatinine value, respectively.
Patients were followed clinically, and complete 2-dimensional echocardiography was performed at 1, 6, and 12 months after the procedure. Death at any time during the follow-up period was recorded and further classified as of cardiac or noncardiac origin.
Continuous variables are expressed as mean ± SD or median (interquartile range [IQR]) depending on variable distribution. Group comparisons were analyzed using Student’s t tests and Mann-Whitney rank-sum tests for continuous variables as appropriate and chi-square or Fisher’s exact tests for categorical variables. Analysis of variance for repeated measures was performed to test for equal means at different times (baseline and 6 to 12, 24, 48, and 72 hours) for the cardiac enzyme values as well as for creatinine values. Relations between peak cTnI and the left ventricular ejection fraction (LVEF) changes were tested using Spearman’s correlation. The normality of distribution and the homogeneity of variance were verified using the Shapiro-Wilk test and the Levene test, respectively. Cardiac enzyme and creatinine values were log transformed to fulfill the normality and variance assumptions. A multivariate Cox regression analysis was used to determine the variables predictive of mortality from any cause and heart failure at 1-year follow-up, including all baseline and procedural variables with p values <0.10 in the univariate analysis. Event-free survival was estimated using the Kaplan-Meier method. The log-rank test was used to compare mortality from any cause and heart failure between patients with and those without AKI after TAVI procedures. The results were considered significant with p values <0.05. All tests were 2 sided. Analyses were performed using SPSS version 19 (IBM Corporation, Somers, New York).
Results
The clinical and echocardiographic characteristics of the study population are listed in Table 1 . At baseline, patients who developed AKI after TAVI (n = 9) compared with those who did not (n = 53) were older and showed a trend toward higher European System for Cardiac Operative Risk Evaluation scores. No significant difference were revealed in terms of baseline creatinine values, cTnI and CK-MB values, co-morbidities, history of coronary revascularization, and LV EF (see Table 1 ) between groups. On echocardiography, the mean aortic gradient decreased from 46.9 ± 8.6 mm Hg at baseline to 6 ± 2.9 mm Hg after TAVI in patients with AKI and from 43.7 ± 13.5 to 6.7 ± 3.5 mm Hg in patients without AKI, and mean aortic valve area increased from 0.47 ± 0.09 cm 2 at baseline to 1.76 ± 0.25 cm 2 and from 0.53 ± 0.13 cm 2 at baseline to 1.75 ± 0.24 cm 2 after TAVI, respectively. From baseline to 1 year, increases in the LVEF were found in patients who developed AKI as well as in patients who did not (5 ± 7.1% vs 2.7 ± 7%, p = 0.367). No differences were observed in terms of the amount of iodinated contrast agent used (121 ± 78 vs 138 ± 63 mL, p = 0.473), procedure-related fluoroscopy time (13.6 ± 8.4 vs 15.2 ± 6.2 minutes, p = 0.50), number of rapid pacing runs (1.22 ± 0.44 vs 1.13 ± 0.34, p = 0.484), and distribution of different CoreValve sizes (for the 26-mm device, 5 [56%] vs 21[40%]; for the 29-mm device, 4 [44%] vs 32 [60%]; p = 0.370) between patients with and those without AKI, respectively.
| Variable | All Patients | No AKI | AKI | p Value |
|---|---|---|---|---|
| (n = 62) | (n = 53) | (n = 9) | ||
| Age (yrs) | 80.9 ± 6.4 | 80.3 ± 6.4 | 85.2 ± 5.0 | 0.033 |
| Logistic EuroSCORE (%) ∗ | 14.75 (10–24.26) | 12.3 (9.075–18.91) | 24.26 (15.14–41.80) | 0.058 |
| Men | 33 (53%) | 30 (57%) | 3 (33%) | 0.196 |
| Arterial hypertension | 37 (60%) | 31 (58%) | 6 (67%) | 0.643 |
| Dyslipidemia | 11 (18%) | 10 (19%) | 1 (10%) | 0.573 |
| Diabetes mellitus | 18 (29%) | 15 (28%) | 3 (33%) | 0.758 |
| Current smokers | 7 (11%) | 7 (13%) | 0 (0%) | 0.247 |
| Peripheral artery disease | 7 (11%) | 5 (9%) | 2 (20%) | 0.262 |
| Previous myocardial infarction | 5 (8%) | 5 (9%) | 0 (0%) | 0.336 |
| Previous percutaneous coronary intervention | 11 (18%) | 10 (19%) | 1 (10%) | 0.573 |
| Previous coronary artery bypass graft | 4 (6%) | 4 (7%) | 0 (0%) | 0.394 |
| Previous stroke | 5 (8%) | 5 (9%) | 0 (0%) | 0.336 |
| Chronic obstructive pulmonary disease | 11 (18%) | 9 (17%) | 2 (20%) | 0.703 |
| Creatinine (mg/dl) | 0.89 (0.74–1.10) | 0.88 (0.71–1.07) | 1.055 (0.77–1.53) | 0.309 |
| cTnI (μg/L) | 0.04 (0.02–0.10) | 0.04 (0.02–0.85) | 0.055 (0.03–0.97) | 0.911 |
| CK-MB (μg/L) | 2.0 (1.05–2.70) | 1.9 (1.05–2.65) | 2.4 (1.7–3.0) | 0.985 |
| Peak aortic gradient (mm Hg) | 78.7 ± 23.3 | 77.7 ± 23.5 | 85.2 ± 22.2 | 0.376 |
| LVEF (%) | 53 (38–60) | 54 (39–60) | 50 (30.5–60) | 0.468 |
| LVEF <40% | 9 (14%) | 8 (15%) | 1 (10%) | 0.753 |
∗ The logistic European System for Cardiac Operative Risk Evaluation (EuroSCORE) is a scoring system ranging from 0% to 100% used to predict 30-day mortality in patients who undergo cardiovascular surgery.
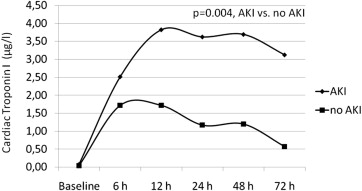
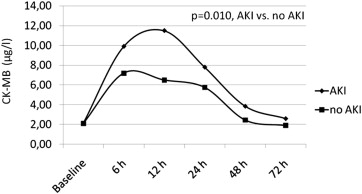
The mean values of cTnI and CK-MB and at each time point within the 72 hours after the procedure for patients with and those without AKI are shown in Figures 1 and 2 , respectively. The cTnI levels were within the normal limits at baseline in 78% of the patients with AKI and increased above the upper normal limit in all patients after TAVI, with a median peak of 3.8 μg/L (IQR 1.8 to 25.67) at 12 hours after the procedure ( Figure 1 ). The cTnI values had started to decrease but continued to be higher than baseline values at 72 hours after TAVI ( Figure 1 ). In patients without AKI, cTnI levels were within the normal limits at baseline in 85% of patients and increased above the upper normal limit in all patients after the procedure, with a median peak of 1.72 μg/L (IQR 0.91 to 2.62) at 12 hours after the procedure. After 12 hours, cTnI values decreased but continued to be higher than baseline values at 72 hours after TAVI ( Figure 1 ). Analysis of variance showed a significant difference between groups (p = 0.004), a significant time difference within groups (p <0.0001), and a significant time-group interaction (p = 0.014). CK-MB levels were within normal limits in all patients with AKI at baseline but 1 (89%) and increased above the upper normal limit in all patients, with a median peak of 11.5 μg/L (IQR 4.2 to 35.15) at 12 hours after the procedure. After 12 hours, values of CK-MB had decreased but continued to be higher than baseline values at 72 hours after TAVI ( Figure 2 ). In patients without AKI, CK-MB levels were within normal limits in 89% of patients and increased above the upper normal limit in all patients, with a median peak of 7.2 μg/L (IQR 5 to 9.6) at 6 hours after the procedure. After 6 hours, CK-MB values had decreased and returned to lower than baseline values at 72 hours after TAVI ( Figure 2 ). Analysis of variance showed a significant difference between groups (p = 0.010), no significant time difference within groups (p = 0.379), and a significant time-group interaction (p <0.0001). No patient developed new Q waves in the inferior or anterior leads on electrocardiography after the procedure. In patients who developed left bundle branch block, no new akinetic regional wall motion abnormalities were found.
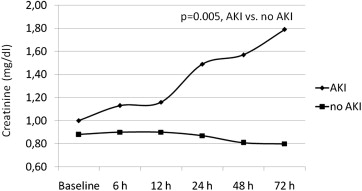
After TAVI procedures, AKI developed in 9 patients (15%; 3 patients requiring ultrafiltration) showing an increase of creatinine reaching the median peak value of 1.79 mg/dl at 72 hours (IQR 1.28 to 2.2). Specifically, according the VARC definition AKI level I was found in 5 patients, AKI level II in 2 patients, and AKI level III in 2 patients. Among patients who did not develop AKI after TAVI, the median value of creatinine remained substantially unchanged during each time in point of measurement from baseline to 72 hours, with a median peak value of 0.9 mg/dl (IQR 0.74 to 1.07) at 6 hours ( Figure 3 ). Analysis of variance showed a significant difference between groups (p = 0.005), a significant time difference within groups (p <0.0001), and a significant time-group interaction (p <0.0001).