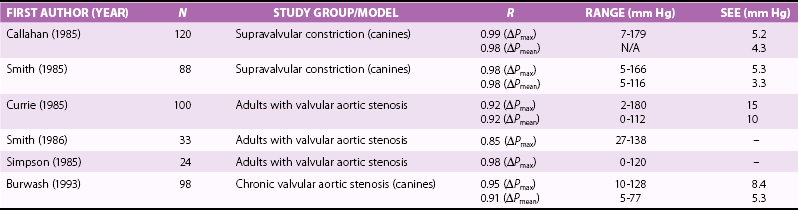
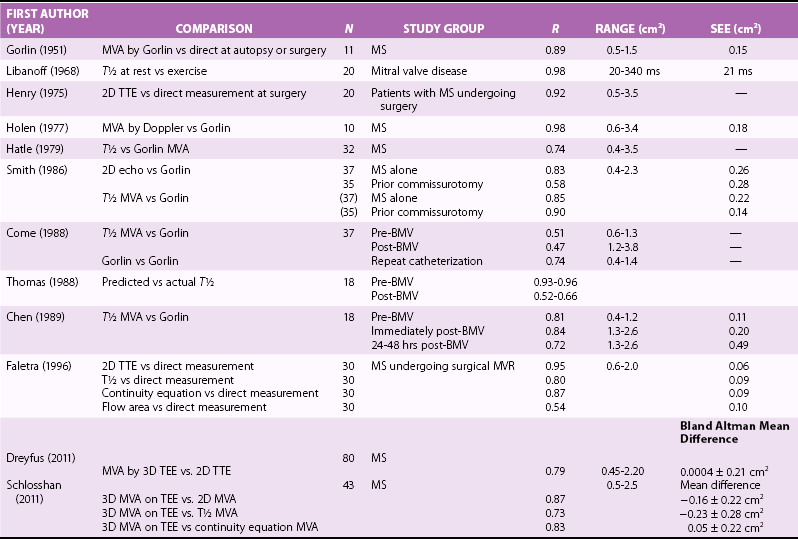
Chapter 6 Echocardiography allows evaluation of valve anatomy, etiology of disease, severity of stenosis and regurgitation, and consequences of valve disease including left ventricular (LV) hypertrophy, dilation, systolic and diastolic function, effects on other cardiac chambers, and changes in pulmonary pressures or vascular resistance. In current clinical practice, echocardiography is the standard diagnostic approach to the patient with suspected or known valvular heart disease. This chapter provides a concise overview of echocardiographic evaluation of the patient with valvular heart disease; more detailed discussions are available in standard echocardiography texts.1,2 The use of echocardiography for specific valve lesions is included in subsequent chapters in this book, including the role of echocardiography in evaluation of patients with endocarditis (see Chapter 25) and prosthetic valves (see Chapter 26). The first step in evaluation of the patient with valvular heart disease is assessment of valve anatomy ( Table 6-1). In many cases, the specific valve involved is known from the clinical history, physical examination, or previous diagnostic studies, but in other cases, the exact diagnosis may be unknown or may have been incorrectly inferred from clinical data. Thus, a careful examination of all four valves and screening for other lesions that might be mistaken for valvular disease are important aspects of the examination. For example, in a patient with a systolic murmur referred for suspected valvular aortic stenosis, other diagnostic possibilities include a subaortic membrane, mitral regurgitation, ventricular septal defect, and hypertrophic cardiomyopathy. An appropriate examination includes exclusion (or confirmation) of each differential diagnosis, as well as evaluation of the aortic valve itself. TABLE 6-1 Echocardiographic Evaluation of the Patient with Valvular Heart Disease 2D and 3D Imaging Valve anatomy and etiology of disease 2D or 3D valve area Quantitative LV dimensions, volumes, ejection fraction, and mass Associated chamber enlargement (e.g., left atrium) Right heart structure and function Complications of valve disease (i.e., left atrial thrombus) Aortic sinuses and ascending aortic anatomy and dimensions Doppler Evaluation of Severity of Valve Disease Valve Stenosis Maximum velocity Mean pressure gradient Valve area (continuity equation and/or pressure half-time) Other measures of stenosis severity, if needed Valve Regurgitation Vena contracta width CW Doppler signal Distal flow reversals Regurgitant volume and orifice area Speckle Tracking Strain Imaging LV strain and strain rate Other Doppler Data LV diastolic function Pulmonary pressures at rest and with exercise 2D, two-dimensional; 3D, three-dimensional; CW, continuous wave; LV, left ventricular. Standard two-dimensional (2D) transthoracic echocardiography (TTE) in multiple image planes identifies involved valve and often allows precise definition of the etiology of valve disease, on the basis of the typical anatomic features of each disease process. When TTE image quality is suboptimal, transesophageal echocardiography (TEE) may be appropriate. Three-dimensional (3D) imaging is increasingly important in evaluation of valve disease, particularly for TEE evaluation of myxomatous mitral valve disease and for guidance of transcatheter valve interventions.3–5 Mitral stenosis most often is due to rheumatic disease with the pathognomonic features commissural fusion, thickening of the leaflet tips, and chordal thickening, fusion, and shortening, all of which are easily recognized on 2D and 3D imaging ( Figures 6-1 and 6-2). In contrast, the occasional elderly patient with functional mitral stenosis due to extension of mitral annular calcification onto the valve leaflets has thin, mobile leaflet tips, with calcification and thickening at the leaflet bases. The specific anatomic features of the rheumatic mitral valve, including severity of leaflet calcification, extent of chordal fusion, and asymmetry in commisural calcification, are important factors in predicting prognosis and in decision making for percutaneous or surgical intervention, discussed in Chapter 17. FIGURE 6-1 Anatomic findings in mitral stenosis. FIGURE 6-2 Mild rheumatic mitral stenosis. Although aortic valve stenosis of any cause is characterized by thickened, stiff leaflets with reduced systolic opening, calcific aortic valve disease is typified by increased echogenicity and thickness in the body of the leaflets without evidence of commissural fusion, resulting in a stellate orifice in systole ( Figure 6-3). It may be difficult to separate calcific changes superimposed on a bicuspid aortic valve from calcification of a trileaflet valve, although 3D TEE may help with this distinction. Rheumatic aortic valve disease is characterized by commissural fusion with increased thickening and echogenicity along the leaflet closure lines and is invariably associated with rheumatic mitral valve disease. Congenital aortic stenosis, seen in young adults, is characterized by a deformed (often unicuspid) valve that “domes” in systole with a restrictive orifice. FIGURE 6-3 Causes of aortic stenosis. Evaluation of the etiology of a regurgitant lesion by echocardiography is more challenging, given the wide range of abnormalities that can lead to valvular incompetence. Mitral regurgitation may be due to abnormalities of the mitral annulus, leaflets, subvalvular apparatus, papillary muscle, or regional or global LV dysfunction ( Figure 6-4). Echocardiographic imaging allows assessment of each of these valve components, so that the etiology of the regurgitant lesion can be discerned in many cases, as discussed in detail in Chapters 18 and 19. Selection of patients for surgical and percutaneous mitral valve interventions is discussed in Chapters 17, 21 and 22. In adults with secondary “functional” mitral regurgitation due to ischemic disease or dilated cardiomyopathy, imaging allows evaluation of both valve anatomy and the left ventricle. Quantitative evaluation of regurgitant severity also may be helpful in determining whether mitral regurgitation is the cause or consequence of ventricular dysfunction. FIGURE 6-4 Cardiac valve anatomy in the long-axis view. Aortic regurgitation may be due to abnormalities of the valve leaflets (such as a bicuspid valve and endocarditis), inadequate support of the valve structures (for example, a subaortic ventricular septal defect), or aortic root dilation (such as in Marfan syndrome or annuloaortic ectasia) ( Figure 6-5). Echocardiographic imaging provides accurate measurements of aortic root dimensions and allows detailed evaluation of valve anatomy and dynamics. A bicuspid valve is diagnosed on the basis of the typical appearance in systole of two open leaflets with two commissures; the closed valve in diastole may mimic a trileaflet valve if there is a raphe in one leaflet. Other recognized abnormalities of the valve leaflets that correspond to a specific etiology include valvular vegetations in endocarditis, redundant leaflets in myxomatous disease, and commissural thickening and associated mitral valve involvement in rheumatic disease, all of which can be recognized on echocardiographic imaging. FIGURE 6-5 Aortic valve anatomy. With aortic root disease, the specific pattern of root dilation and associated features may indicate a specific etiology, such as the “water balloon” appearance of the root in Marfan syndrome with loss of the normal tapering at the sinotubular junction and associated mitral valve abnormalities. In other cases, the pattern of root dilation is nonspecific, so incorporation of other clinical information is needed to determine the etiology of disease. For example, aortic root dilation in a patient with a systemic immune-mediated process (such as rheumatoid arthritis) is probably due to this systemic disease process. In contrast, dilation of the ascending aorta in a patient with a bicuspid aortic valve is likely related to bicuspid aortic valve disease.6,7 TTE provides diagnostic images in the vast majority of patients with valvular heart disease and is the standard approach both for initial evaluation and for follow-up studies. However, TTE image quality may be suboptimal in patients in whom ultrasound access is poor because of body habitus, hyperexpanded lungs, or the postoperative state. Even when TTE images are adequate, TEE provides better image resolution for posterior structures, including the mitral valve, left atrium (LA), and atrial appendage. 3D TEE imaging provides a “surgical” view of the mitral valve from the perspective of the LA, demonstrating the presence, location, and severity of prolapse; identification of chordal rupture; and evaluation of the valve commissures ( Figure 6-6).8,9 TEE or intracardiac echocardiography is essential for excluding left atrial thrombus in candidates for balloon mitral valvotomy. FIGURE 6-6 Three-dimensional images of the mitral valve. Other indications for TEE in patients with valvular disease include assessment of regurgitant severity when TTE images are nondiagnostic or when a prosthetic mitral valve is present, monitoring of surgical and transcatheter valve repair procedures (see Chapters 17 and 22), measurements for valve sizing with transcatheter valve procedures ( Figures 6-7 and 6-8), and determining the exact level of obstruction in a patient with a differential diagnosis of valvular or subvalvular obstruction. Rarely, TEE is needed for evaluation of stenosis severity when TTE data are not diagnostic. FIGURE 6-7 Measurement of aortic annulus diameter for transcatheter aortic valve implantation. FIGURE 6-8 Mitral valve annular dimensions. The fluid dynamics of a stenotic valve are characterized by a high-velocity jet in the narrowed orifice; laminar, normal velocity flow proximal to the stenosis; and a flow disturbance distal to the obstruction.10,11 The pressure gradient across the valve (ΔP) is related to the high-velocity jet (Vmax) in the stenosis, the proximal velocity (Vprox), and the mass density of blood (ρ), as stated in the Bernoulli equation, which includes terms for conversion of potential to kinetic energy (convective acceleration), the effects of local acceleration, and viscous (v) losses: where the constant 4 accounts for the mass density of blood and conversion factors for measurement of pressure in mm Hg and velocity in m/s. When the proximal velocity is low (<1.5 m/s) and the jet velocity is high (v12 Maximum instantaneous gradient is calculated from the maximum transvalvular velocity, whereas mean gradient is calculated by averaging the instantaneous gradients over the flow period. The accuracy of the simplified Bernoulli equation in measuring transvalvular pressure gradients has been shown in in vitro studies, animal models, and clinical studies of patients with valvular disease ( Table 6-2). However, accuracy depends on optimal data acquisition; specifically, care is needed to obtain a parallel intercept angle between the continuous-wave (CW) Doppler beam and the direction of blood flow in order to avoid underestimation of the velocity and, hence, pressure gradient across the valve. The high velocities encountered in aortic and pulmonic stenosis mandate the use of CW Doppler echocardiography to avoid signal aliasing. A dedicated small dual-crystal CW Doppler transducer is recommended. Pulsed or high pulse repetition frequency Doppler echocardiography can be used for evaluation of the lower velocities seen in mitral and tricuspid stenosis with the advantage of a better signal-to-noise ratio and clearer definition of the diastolic deceleration slope than with CW Doppler echocardiography. Other potential technical sources of error in measuring transvalvular velocities include poor acoustic access with an inadequate flow signal, incorrect identification of the flow signal (e.g., mistaking the mitral regurgitation signal for aortic stenosis), respiratory motion, and measurement variability. In addition, physiologic sources of error include beat-to-beat variability with irregular rhythms and interim changes in volume flow rates leading to changes in velocity and pressure gradient. TABLE 6-2 Selected Studies Validating Doppler Pressure Gradients in Valvular Aortic Stenosis * SEE, standard error of the estimate. *Data from Callahan et al, Am J Cardiol 1985;56:989–993; Smith et al, J Am Coll Cardiol 1985;6:1306–1314; Currie et al, Circulation 1985;71:1162–1169; Smith et al, Am Heart J 1986;111:245–252; Simpson et al, Br Heart J 1985;53:636–639; Burwash et al, Am J Physiol 1993;265:H1734–H1743. From Otto CM. Textbook of clinical echocardiography. 5th ed. Philadelphia: Elsevier/Saunders; 2013. Pressure gradients and velocities depend on the volume flow rate across the valve as well as the degree of valve narrowing. Valve area (or the size of the stenotic orifice) is a useful measure of stenosis severity that, at least in theory, more closely reflects valve anatomy independent of the flow rate across the valve. Valve area can be calculated from invasive data as discussed in Chapter 7 or noninvasively from 2D and Doppler echocardiographic data using the continuity equation. The valve orifice in rheumatic mitral stenosis is a relatively planar structure with a constant shape and size throughout diastole (see Figure 6-2). From a parasternal short-axis view, the orifice can be imaged, with care taken to identify the minimum orifice area by scanning from the apex toward the base, using low gain settings, and tracing the inner border of the black-white interface. 12 Measurement of 2D mitral valve area has been well validated in comparison with direct measurement at surgery and with invasive valve area calculations ( Table 6-3). Planimetry of the stenotic mitral valve orifice from a 3D volumetric data set or image ensures that the minimal orifice area at the leaflet tips is correctly measured; 3D measurements show improved reliability with less experienced sonographers ( Figure 6-9). 13 TABLE 6-3 Selected Studies of Mitral Valve Area Determination * *Data from Gorlin et al, Am Heart J 1951;41:1–29; Libanoff et al, Circulation 1968;38:144–150; Henry et al, Circulation 1975;51:827–831; Holen et al, Acta Med Scand 1977;201:83–88; Hatle et al, Circulation 1979;60:1096–1104; Smith et al, Circulation 1986;73:100–107; Come et al, Am J Cardiol 1988;61:817–825; Thomas et al, Circulation 1988;78:980–993; Chen et al, J Am Coll Cardiol 1989;13:1309–1313; Faletra et al, J Am Coll Cardiol 1996;28:1190–1197; Dreyfus et al, Eur J Echocardiogr 2011;12:750–755; Schlosshan et al, JACC Cardiovasc Imaging 2011;4:580–588. From Otto CM. Textbook of clinical echocardiography. 5th ed. Philadelphia: Elsevier/Saunders; 2013. FIGURE 6-9 Three-dimensional measurement of mitral valve area. The anatomy of valvular aortic stenosis is variable and more complex than mitral stenosis. A congenitally unicuspid valve may have a relatively symmetric orifice that can be imaged in a single tomographic plane and is well seen on 3D imaging. Although the opening of a bicuspid valve often is clearly seen early in the disease course, superimposed calcific changes result in shadowing and reverberations, making planimetry of the stenotic valve orifice problematic, although 3D imaging may be helpful when calcification is not severe. The orifice of a calcified trileaflet valve may be quite complex with a nonplanar stellate shape. Although not routine clinical practice, 3D TEE imaging is helpful for planimetry of aortic valve area, in selected patients ( Figure 6-10).14,15 FIGURE 6-10 Measurement of aortic valve area by 3D transesophageal echocardiography.
Echocardiographic Evaluation of Valvular Heart Disease
 Key Points
Anatomic Imaging
Echocardiographic Valve Anatomy
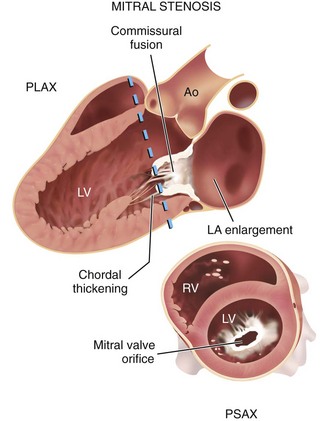
In the parasternal long-axis view (PLAX), commissural fusion with diastolic doming of the mitral leaflets is seen, as well as chordal thickening and fusion. In a parasternal short-axis view (PSAX), at the mitral valve orifice, the area of opening can be determined by planimetry at the white-black interface of the orifice. The plane of the short-axis view is indicated by a dashed line on the long-axis image. Ao, Aorta; LV, left ventricle; RV, right ventricle. (From Otto CM. Textbook of clinical echocardiography. 5th ed. Philadelphia: Elsevier/Saunders; 2013.)
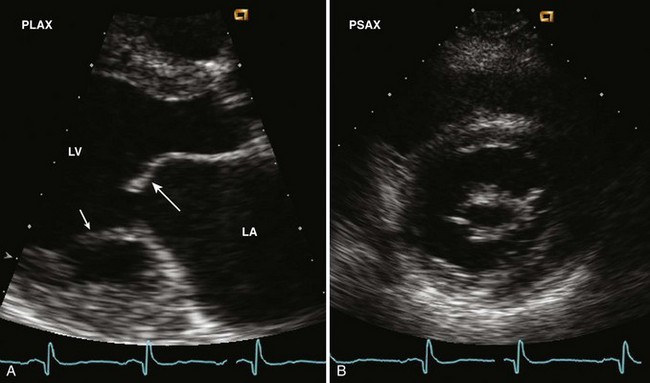
A, The parasternal long-axis view shows the typical doming (long arrow) of the anterior mitral leaflet due to commissural fusion as well as chordal shortening and fusion (short arrow). Left atrial (LA) enlargement is present. B, The short-axis view allows accurate planimetry of the mitral orifice area if care is taken to identify the smallest opening by scanning slowly from apex toward the base. LV, left ventricle. (From Otto CM. Textbook of clinical echocardiography. 5th ed. Philadelphia: Elsevier/Saunders; 2013.)
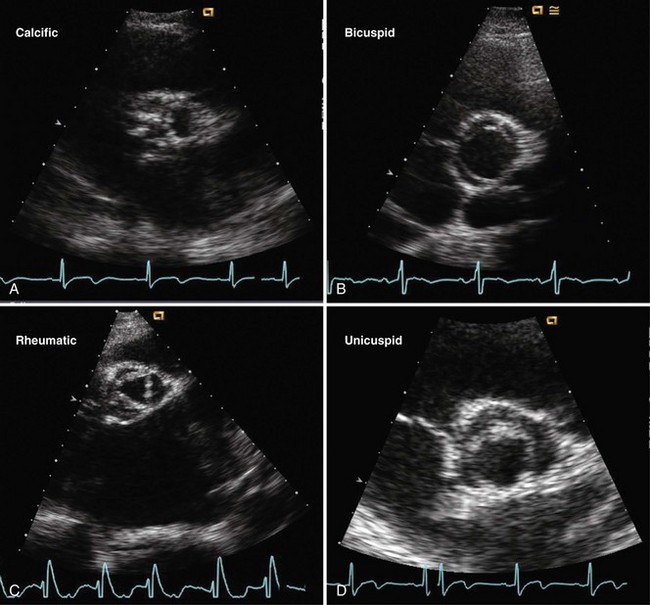
A, In a parasternal midsystolic short-axis view, calcific aortic stenosis is characterized by fibrocalcific masses on the aortic side of the leaflet that result in increased leaflet stiffness without commissural fusion. Calcific shadowing and reverberations limit image quality. B, With a congenital bicuspid valve, the two leaflets (with a raphe in the anterior leaflet) open widely in systole. C, The diagnostic features of rheumatic stenosis are commissural fusion and mitral valve involvement, with the characteristic triangular aortic valve opening in systole. D, The unicuspid valve has only one point of attachment (at the 6 o’clock position) with a funnel-shaped valve opening. (From Otto CM. Textbook of clinical echocardiography. 5th ed. Philadelphia: Elsevier/Saunders; 2013.)
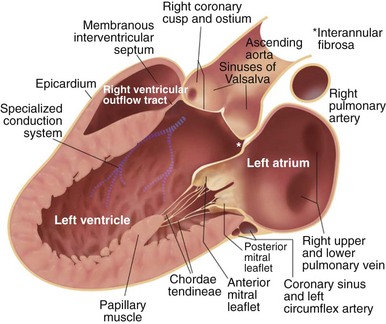
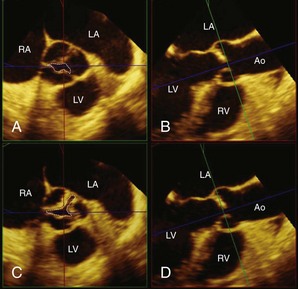
The parasternal long-axis view in diastole shows: the closed right and noncoronary cusps of the aortic valve; the aortic sinuses, sinotubular junction, and proximal ascending aorta; the open anterior and posterior mitral valve leaflets; the basal and midventricular segments of the anterior septum and posterior LV wall; the RV outflow tract anteriorly; and the coronary sinus in the atrioventricular groove. The medial papillary muscle is shown for reference, although slight medial angulation is typically needed to visualize this structure in the long-axis view.
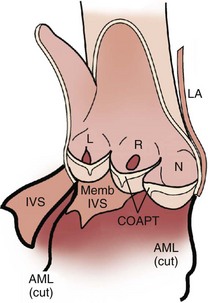
Detailed view of the aortic valve with the aorta opened to show the valve leaflets and the interventricular septum (IVS) and anterior mitral leaflet (AML) bisected. The aortic valve consists of three leaflets and associated sinuses of Valsalva; the left (L) right (R), and noncoronary (N) leaflets and sinuses. Each leaflet-sinus pair forms a cup-shaped unit when the valve is closed. The load-bearing section of the leaflet appears linear when viewed in long axis but curved in cross-section, consistent with a hemicylindrical shape. The coaptation surfaces of the leaflets thicken toward the center of each leaflet with areas of prominent thickening termed the nodes of Arantius. Lambl excrescences, filamentous attachments on the ventricular side of the nodules of Arantius, are common in older subjects. (From Otto CM. Textbook of clinical echocardiography. 5th ed. Philadelphia: Elsevier/Saunders; 2013.)
Transthoracic versus Transesophageal Echocardiographic Imaging
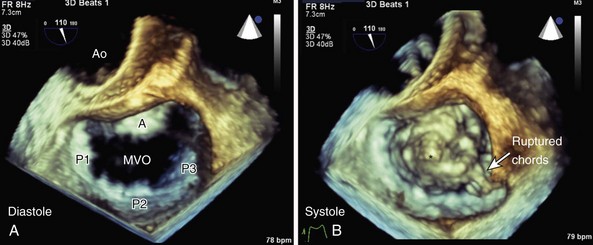
A, The surgeon’s view from the left atrial side of the mitral valve with the aortic valve (Ao) at the top of the image, showing the anterior leaflet and posterior leaflet (with P1, P2, and P3 scallops) are seen in diastole in the open position with a normal mitral valve orifice (MVO). B, In systole, severe prolapse of the anterior leaflet is seen. One bulging section (asterisk) and a flail segment with two small ruptured chords are particularly well visualized, which results in severe posteriorly directed mitral regurgitation. This patient also a bileaflet mechanical aortic prosthesis; the open leaflets can be seen in the systolic image. (From Otto CM. Textbook of clinical echocardiography. 5th ed. Philadelphia: Elsevier/Saunders; 2013.)
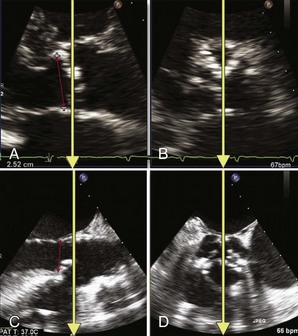
A and B, Biplane echocardiographic imaging identifies the sagittal imaging plane that bisects the largest dimension of the aortic annulus. Biplane transthoracic imaging shows the sagittal (A) and corresponding transverse (B) planes. The yellow arrows define the imaging planes for the orthogonal view. The red line shows the appropriate annular measurement in the on-axis sagittal plane. C and D, Biplane transesophageal imaging shows the sagittal (C) and corresponding transverse (D) planes. Red arrow in (C) shows the appropriate annular measurement in the on-axis sagittal plane. (From Bloomfield GS, Gillam LD, Hahn RT, et al. A practical guide to multimodality imaging of transcatheter aortic valve replacement. JACC Cardiovasc Imaging 2012;5:441–55.)
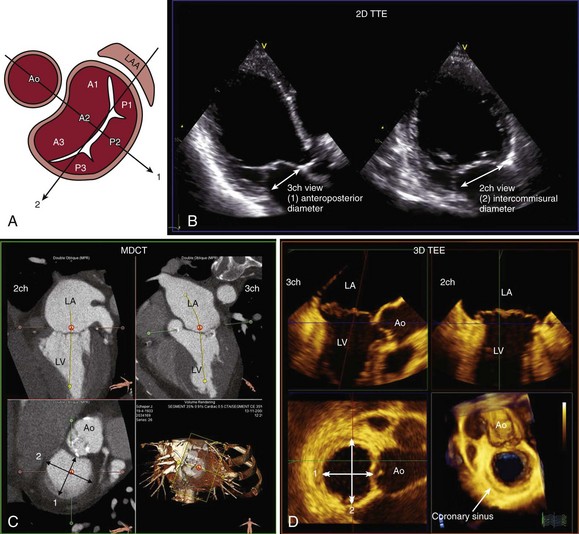
Accurate assessment of mitral valve annular dimensions is highly relevant to planning of the therapeutic strategy. A, The anteroposterior (1) and intercommissural (2) diameters are commonly measured. B, With 2D TTE, the anteroposterior diameter (arrow) is measured at the apical three-chamber (3ch) view whereas the inter commissural diameter (arrow) can be measured in the apical two-chamber (2ch) view. Three-dimensional (3D) imaging techniques, such as multidetector computed tomography (MDCT) (C) and 3D transesophageal echocardiography (3D TEE) (D), permit correct alignment of the orthogonal multiplanar reformation planes to obtain the most accurate cross-sectional visualization of the mitral valve annulus. The maximum and minimum diameters can be assessed. These two orthogonal diameters commonly correspond to the intercommissural and anteroposterior diameters, respectively. A1 to A3, Anterior mitral valve leaflet scallops; Ao, Aorta; LA, left atrium; LV, left ventricle; P1 to P3, posterior mitral valve leaflet scallops . (From Delgado V, Kapadia S, Marsan NA, et al. Multimodality imaging before, during, and after percutaneous mitral valve repair. Heart 2011;97:1704–14.)
Evaluation of Stenosis Severity
Velocity Data and Pressure Gradients
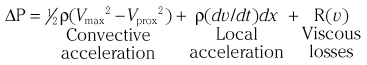
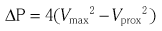
 v22), this equation can be further simplified as follows:


Valve Area Concept and Measurement
Imaging the Stenotic Valve Orifice
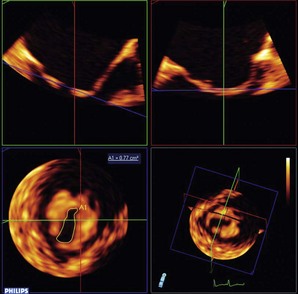
A full-volume image of the mitral valve was acquired in a patient with mitral stenosis and asymmetric fusion of the commissures. For measurement of the mitral valve area, offline analysis of the three-dimensional (3D) volume used three orthogonal planes (x, y, and z, shown in red, green, and blue to align an image plane at the tips of the stenotic valve. The resulting tomographic image at the minimal orifice area in diastole (lower left) was traced to determine mitral valve area (A1). (From Otto CM. Textbook of clinical echocardiography. 5th ed. Philadelphia: Elsevier/Saunders; 2013.)
The tip of the aortic valve was obtained as the smallest possible area (A1, A2). The shape and area of the aortic valve changed (from A1 to B1) as the green plane moved slightly from the tip to the base (from A2 to B2). Dotted lines indicate aortic valve area at each level. Ao, Ascending aorta; LA, left atrium; LV, left ventricle; RA, right atrium. (From Saitoh T, Shiota M, Izumo M, et al. Comparison of left ventricular outflow geometry and aortic valve area in patients with aortic stenosis by 2-dimensional versus 3-dimensional echocardiography. Am J Cardio 2012;109:1626–31.)![]()
Stay updated, free articles. Join our Telegram channel

Full access? Get Clinical Tree


Echocardiographic Evaluation of Valvular Heart Disease


Only gold members can continue reading. Log In or Register to continue
