Doppler Echocardiography
Frank A. Flachskampf
Overview
Doppler echocardiography (DE), an ultrasound-based noninvasive diagnostic technique, measures velocities of blood or solid tissue relative to the transducer. From blood flow velocities, pressure gradients across stenotic, regurgitant, or shunt lesions can be calculated. Estimates of cardiac output, severity of regurgitation, shunt magnitude, and systolic pulmonary artery pressure are obtainable. Tissue DE, together with blood flow DE, allows assessment of global systolic and diastolic myocardial function, detection of myocardial diseases in early stages, assessment of synchronicity of myocardial contraction, and identification of regional ischemia. Thus, DE is an integral and mandatory part of every complete echocardiographic examination.
Glossary
Aliasing
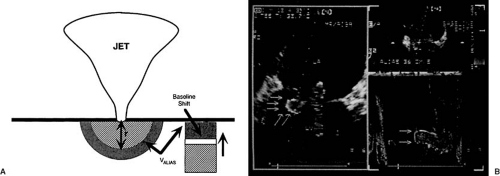
The maximal velocity unambiguously identifiable by pulsed (and color) DE is the aliasing velocity, which depends on the pulse repetition frequency, the frame rate, the sampling depth, and the carrier frequency.
Color Doppler flow mapping
A Doppler display that codes blood flow velocities by colors (red toward the transducer, and blue away from the transducer) and superimposes this color map on the 2D image. Thus, a cross-sectional display of blood flow velocities is created. Color Doppler is a way of simultaneously displaying Doppler data from multiple sites in an easily interpretable way. This modality serves for quick orientation about pathologic blood flow (turbulence, regurgitation, shunt flows) and for analysis of valvular regurgitation.
Continuous wave Doppler
A Doppler modality that measures velocities along one scan line. Any velocities are measured unequivocally, but along the scan line there is no spatial resolution. This modality serves to measure the high velocities encountered in valvular stenosis or regurgitation.
Flow profile
The plot of flow velocities measured by pulsed or continuous wave Doppler over time (e.g., diastole for the mitral valve). Essentially synonymous with spectral Doppler display.
Gradient
Pressure drop (or difference) across a restrictive orifice (e.g., a valve).
Jet
A flow stream created by discharge from a narrow orifice (e.g., valvular regurgitation occurs as a jet).
Myocardial velocity gradient
Conceptually equivalent to strain rate.
Pressure half-time
The time that it takes for a pressure gradient to decay to half of its peak value. The pressure half-time is used to evaluate mitral stenosis and aortic regurgitation.
Pulsed wave Doppler
A Doppler modality that measures blood flow velocity in a specific region, the “sample volume.” Thus, unlike continuous wave Doppler, pulsed wave Doppler allows the choice of the site of measurement. The trade off is that the maximal unequivocally identifiable velocity is limited (see aliasing).
Restrictive orifice
Narrowing in the path of flow stream. Stenotic and regurgitant lesions are restrictions to forward and backward flow, respectively. Restrictive orifices have a geometrical or anatomic orifice area, which is the smallest cross-sectional area between the solid boundaries of the lesion, and an effective area, which is the smallest cross-section of the jet created by such a lesion.
Sample volume
The volume of blood or tissue from which an average velocity is measured by pulsed Doppler. Technically, the length of the sample volume depends on the pulse length (the number of ultrasound wavelengths in one pulse), and the axial position of the sample volume along the cursor depends on the range gate, which defines which time interval is allowed to elapse between transmit and receive. Spatial position and sample volume length can be chosen by the operator, and angle correction is also possible.
Spectral Doppler
Display of continuous or pulsed wave Doppler plotting blood flow velocity against time.
Strain (rate)
The deformation (lengthening or shortening, thickening or thinning) of myocardium during the cardiac cycle. It is dimensionless (e.g., a strain of 0.2 means a 20% elongation). Strain rate (strain divided by corresponding time, in 1/s units) is measurable by tissue Doppler between two chosen points in the myocardium by subtracting the tissue velocities at these points and dividing by the distance between the points. From strain rate, strain is obtained by temporal integration. Strain rate and myocardial velocity gradient are conceptually equivalent.
Stroke length, stroke distance
Synonymous with velocity–time integral.
Tissue Doppler
Pulsed or color Doppler modality measuring the velocity of solid cardiac structures with respect to the transducer. These are low-velocity (typically <15 cm/s), high-amplitude signals, in contrast to signals from intracardiac blood flow measured by classic Doppler, which even in normals reach 1 m/s and more and have low amplitudes.
Velocity–time integral
The area enclosed by the envelope (the boundary) of the spectral pulsed or continuous wave Doppler display (unit: centimeter). This term is synonymous with stroke length.
Turbulence
Characteristic of flow under certain conditions (especially at high velocities) where fluid particle velocity and direction changes rapidly and chaotically.
Historical Perspective
The Austrian physicist Christian Doppler (1803–1853) first precisely analyzed the effect of motion of the observer relative to the source of a wave on the perceived wave frequency (the Doppler effect) (1). Ultrasound Doppler was first used in medicine to measure intravascular blood flow (2,3). Whereas the first instruments used a continuous emission of ultrasound, pulsed Doppler devices were introduced at the end of the 1960s (4,5). The breakthrough for DE came with its success in quantifying pressure drops across valvular stenoses by means of the simplified Bernoulli equation in the late 1970s (6,7). Since then, the Doppler technique became progressively integrated into ultrasound equipment, and “duplex” instruments emerged, combining two-dimensional (2D) imaging and Doppler blood velocimetry. With the use of multigated pulsed DE, a color-encoded display or “map” of velocities could be superimposed on M-mode and later 2D echocardiographic images (8,9,10,11). Transesophageal Doppler recordings of aortic blood flow velocity were obtained as early as 1973 (12), and in the 1980s Doppler capabilities were added to transesophageal imaging probes. Finally, tissue DE was introduced in the early 1990s (13).
From Doppler Signals to Hemodynamics: Basic Concepts
The Doppler Signal
The Doppler signal contains the following data:
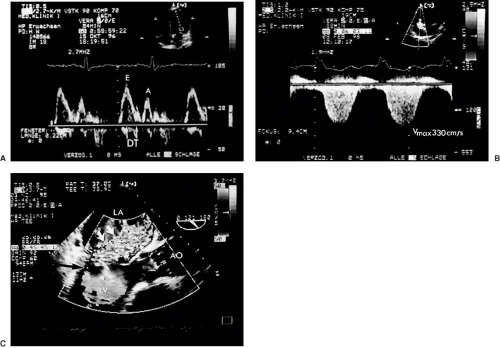
The Doppler frequency shift (between transmitted and received ultrasound) quantifies the instantaneous velocity component of the moving reflectors (blood cells or tissue) toward or away from the transducer at a site determined by the sample volume of the pulsed Doppler, or along the scan line in continuous wave Doppler. The display of this instantaneous velocity over time is called the spectral Doppler display (Fig. 51.1). If velocities are integrated over time, the time velocity integral (in centimeters) is obtained. With color Doppler, multiple measurements at different sites in the heart cavities are made simultaneously and represented qualitatively in colors (see Fig. 51.1). Velocities toward the transducer typically are represented in shades of red, and away from the transducer in shades of blue. Rapid variations in velocity, as in turbulent flow, can be characterized by an admixture of other colors. It is crucial to understand that any velocity at an angle α with the Doppler scan line will be underestimated by the factor cos α. This angle error occurs regardless of the modality, that is, with pulsed, continuous, color, or tissue DE.
The intensity (amplitude) of the signal is represented in shades of grey in the spectral display. It is related to the number of scatterers (red blood cells or tissue reflectors) found within the sample volume moving with the measured velocity. The width of the signal reflects the variation in velocity within the sample volume. The brightest line is the “modal” velocity, which is the velocity most frequently measured by the Doppler device in the sample volume (Fig. 51.1). This is important when calculating flow rates from cross-sectional areas and blood flow velocities. In contrast, continuous wave spectral displays are filled with white signals up to the maximal velocity, the envelope. The reason is that the continuous wave Doppler device measures velocities along a whole scan line, so that all flow velocities which the scan line encounters are represented.
The audio signal (with blood flow DE). Experienced echocardiographers use the audio signal to optimize the angulation of the transducer. The magnitude of the Doppler shift caused by blood flow velocity lies within the audible range (<20 kHz). Therefore, high pitch corresponds to high blood flow velocity, and purity of tone to a narrow range of flow velocities.
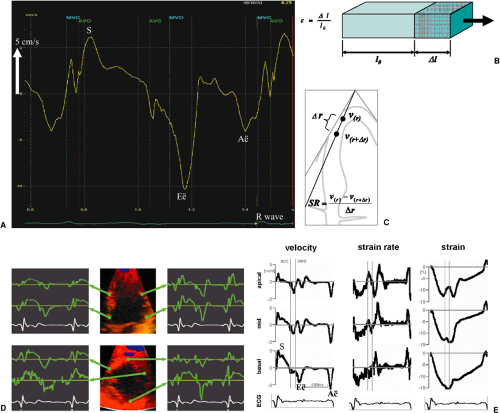
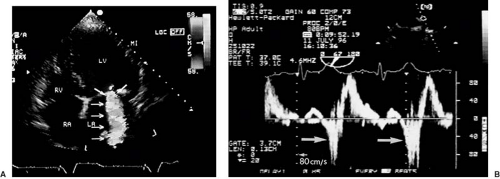
Tissue DE (Fig. 51.2A). This technique provides analogous information as blood flow DE, except that solid tissue velocities (usually from the myocardium) instead of blood flow velocities are measured. This is accomplished by a set of filters which largely eliminates the high-velocity, low-intensity signals from blood and retains the low-velocity, high-intensity signals from tissue. The results are displayed either as a spectral pulsed Doppler display (velocity over time) or as a color coded map. Because of the low velocities of tissue (typically <15 cm/s), neither continuous wave nor
audio signals are used in tissue DE.
A derived modality is deformation imaging, also known as strain or strain rate imaging, which extracts the local deformation rate in the direction of the ultrasound beam (percentage elongation or shortening divided by time). Strain rate (equivalent to the myocardial velocity gradient), and its temporal integral, strain, can be calculated by subtracting the simultaneous velocities at two myocardial points along a scan line at a small distance (<1 cm) and dividing the results by the distance between the two points; its unit is Hz (s-1). Integrating strain rate over time yields strain, a dimensionless number indicating the fractional elongation or shortening; for example, a strain of +30% means that the tissue has elongated in the direction of the Doppler beam by 30% compared to baseline (Fig. 51.2B–F). In contrast to tissue velocities, strain rate and strain are largely unaffected by movements of the heart as a whole with respect to the transducer or by tethering from adjacent myocardial regions and therefore are truly regional parameters.
Basic Hydrodynamic Principles
The Continuity Principle
This is an application of the law of the conservation of mass in a closed system (Fig. 51.3). In steady flow of an incompressible fluid through a tube, the volume flow rate (mL/s) is equal at any cross-section of the tube. Because flow rate is equal to the product of (mean) velocity v and cross-sectional area A,
at any cross-sections 1 and 2 of the flow stream. Thus, effective orifice area AEFF of a narrowed flow cross-section (e.g., a stenosis) can be calculated from the maximal flow velocity across the orifice vMAX, cross-sectional area A1, and mean flow velocity v1 of any other cross-section by:
This relationship is the basis for calculation of stenotic aortic valve area by continuity. The effective orifice area of flow is always smaller than the geometrical orifice area and is situated slightly downstream from the restrictive orifice. The ratio between effective and geometric area is called the coefficient of contraction and is always smaller than 1. Hence, effective orifice area by the continuity equation is smaller by a variable factor than orifice area by planimetry or by the Gorlin equation. The continuity principle is valid instantaneously, and thus effective area can be calculated both from the time–velocity integrals or the maximal instantaneous velocities at two cross-sections. Both are equal if the cross-sections are constant over time.
Restrictions to Flow: Stenotic, Regurgitant, and Shunt Lesions
Because of the continuity principle, any narrowing of the cross-sectional area of flow implies an increase in flow velocity. The “convective” flow acceleration necessary for this increase in flow velocity is the main cause of the pressure drop across cardiac restrictive lesions, whereas factors such as viscosity, pulsatile acceleration of stagnant blood, and others only play a minor role. In contrast, normal cardiac valves pose very little restriction to flow, such that the energy consumed to propel blood across native valves is largely due to pulsatile acceleration of blood mass. The general relationship between pressure difference and velocity difference between two points along a streamline is expressed by the Bernoulli equation, which is
derivable from the more general Euler and Navier–Stokes equations of flow. It is an application of the principle of energy conservation:
derivable from the more general Euler and Navier–Stokes equations of flow. It is an application of the principle of energy conservation:
where p1, v1, and p2, v2 are pressure and velocity at points 1 and 2 on a streamline, respectively, v(s,t) is blood velocity as a function of distance s along the streamline between points 1 and 2 and of time t, ρ is blood density (1.05 g/cm3), and R(v) is viscous friction loss between 1 and 2 as a function of velocity. The first term on the right side describes “convective” acceleration (acceleration to overcome the decreased flow cross-section), the second term flow acceleration over time (e.g., acceleration of stagnant blood at valve opening and closure), and the third term viscous loss. For clinical purposes, the proximal velocity v1 and the second and third term on the right are neglected, and the Bernoulli equation is “simplified” to
where Δp is the pressure drop in mm Hg and vMAX is the maximal velocity in m/s. Under some conditions, however, the simplified version does not apply:
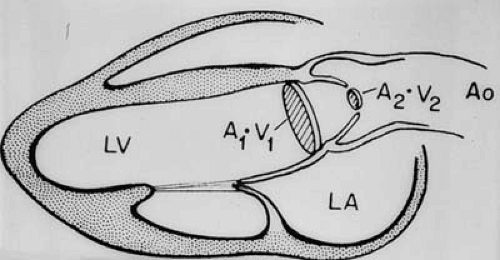 FIGURE 51.3. Schematic drawing of the continuity principle. See text for details. (Source: From Weyman AE. Principles and practice of echocardiography. 2nd ed. Philadelphia: Lea & Febiger; 1994. ) |
In normal native valves. Proximal velocity is not negligible in relation to maximal transvalvular velocity, and time dependent, “pulsatile” flow acceleration is not negligible compared to convective acceleration.
In the presence of high prestenotic velocities, as in subaortic obstruction or significant regurgitation coexisting with stenosis. Here, the proximal velocity vPROX has to be taken into account

If pressure recovery occurs, the kinetic energy present at the effective orifice area of restrictive cardiac lesions is partly dissipated in turbulent eddies and, ultimately, heat. This energy is lost irretrievably. However, restriction geometries that allow the jet to expand gradually until reaching the boundaries of the receiving chamber minimize eddy formation and allow some of the kinetic energy to be reconverted into static pressure energy downstream. The most prominent example of this is seen in bileaflet prostheses in the aortic position (see below and Chapter 25). The amount of pressure recovery depends on the morphology of the obstruction and the receiving chamber, being large in gradually tapering and flaring obstructions and in narrow receiving chambers (e.g., a narrow ascending aorta) and low in abrupt narrowings and wide receiving chambers (e.g., the left ventricle).
In tunnel-like lesions, where the length of the obstruction is not negligible, as in some forms of congenital subaortic stenosis. Here, Poiseuille’s law (see next section) is more appropriate.
Laminar and Turbulent Flow
Laminar flow ideally occurs in separate layers of velocity without mixing between the layers. In a tube, laminar flow generates a parabolic flow profile, where the maximal velocity occurs at the central axis and is approximately twice the mean velocity. Poiseuille’s law applies:

where Δp is pressure drop, Q is volume flow, R is vascular resistance, v is mean velocity, η is viscosity, L is tube length, and r is tube radius. Pressure drop is directly and linearly proportional to flow rate (as opposed to the simplified Bernoulli equation, where pressure drop is proportional to flow rate squared), and inversely proportional to the fourth power of tube radius. Flow in the heart chambers and through normal heart valves is laminar. However, in stenotic and regurgitant lesions, from certain velocities on flow becomes turbulent. Fluid velocity layers break down, and mixing occurs in eddies. Turbulence is characterized by random fluctuations of fluid velocity and pressure at any location. The velocity profile is flattened and no longer parabolic. Poiseuille’s law no longer applies; turbulent pressure drop is proportional to flow rate squared. Hence, flow resistance increases if flow becomes turbulent. The transition from laminar to turbulent flow depends on the relation of inertial to viscous forces in a flow field, described by the dimensionless Reynolds number (2r * v * ρ/η), where r is radius of the flow cross-section, v is mean velocity, ρ is density, and η is viscosity. Flow becomes turbulent if this number exceeds approximately 2,300; however, in vivo the transition may occur at lower or higher Reynolds numbers. The continuity principle and the Bernoulli equation are valid independently of the occurrence of turbulence. Turbulent jets at their orifice contain a very small, tapering laminar flow core, which extends for approximately six orifice diameters or less (14) into the receiving chamber, from where on the jet is fully turbulent. The jet maintains the maximal velocity in the laminar core; after becoming fully turbulent, flow velocity decays inversely proportional to the distance from the orifice.
The Proximal Convergence Zone Concept
This is a continuity-based approach to measure flow rate through an orifice (usually in regurgitant lesions) by analysis of the flow velocity field proximal of the orifice (15) (Fig. 51.4). For this purpose, it is assumed that concentric hemispheric layers of fluid particles of the same velocity centered at the orifice are formed at each moment in time (hence, this concept is also called proximal isovelocity surface area). The smaller the radius of the hemisphere, the higher the flow velocity toward the orifice. Because of the continuity principle, flow rate through the orifice is equal to flow rate across each hemisphere, which is the product of hemisphere surface area and corresponding flow velocity. If the radius r of a hemisphere and the corresponding velocity v are known, instantaneous flow rate Q can be calculated as
Color DE can be used to measure r and v. This concept can in principle be applied to restrictive as well as stenotic and shunt lesions. The assumption of hemispheric isovelocity surfaces is a simplification neglecting irregular orifices, solid boundaries, simultaneous other intracardiac flows and so on.
Evaluation of Stenotic Lesions
A stenosis is a restriction to flow and thus characterized by a reduction in the geometrical cross-section of flow, a pressure drop, and an increase in local flow velocity. The maximal instantaneous pressure drop can be calculated from the maximal instantaneous blood flow velocity by the simplified Bernoulli equation:
where Δp is pressure drop in mm Hg, and v is velocity in m/s. For calculating mean pressure drop, the instantaneous pressure drops are averaged over the duration of flow.
Another way to quantify stenoses is the calculation of stenotic orifice area, which is usually accomplished by the continuity equation (see Fig. 51.3):
where A2 is the stenotic orifice area, A1 is the area of a nonstenotic flow cross-section (usually calculated as π * d2/4 where d is the left ventricular outflow tract diameter), TVI1 is the time velocity integral at the nonstenotic flow cross-section by pulsed wave DE, usually in the left ventricular outflow tract, and TVI2 is the transstenotic time velocity integral (by continuous wave DE). Instead of time velocity integrals, the maximal transstenotic velocity and the maximal velocity in the outflow tract can also be used.
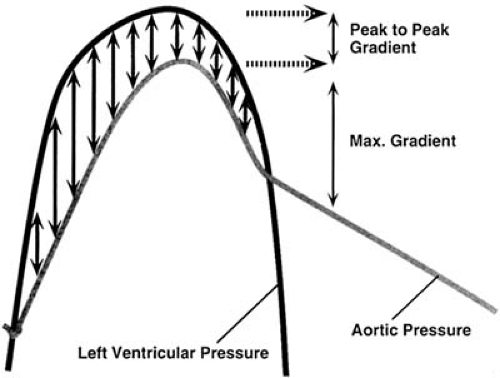
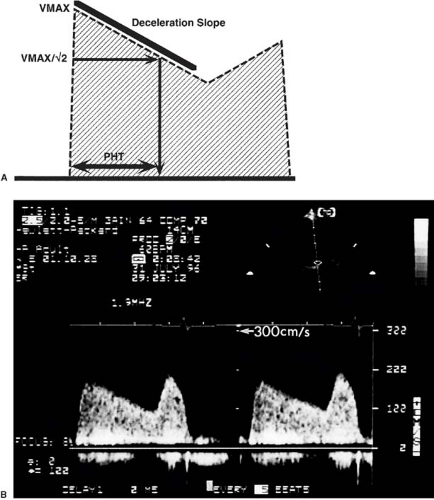
From the instantaneous pressure drop calculated by the simplified Bernoulli equation maximal and mean pressure drops, or “gradients” in cardiology parlance, can be calculated and are in principle identical to invasively measured maximal instantaneous and mean gradients (but not to “peak-to-peak” gradients) (Fig. 51.5). Note that the mean gradient is the mean of 4v12, 4v22…, where v1, v2…are the maximal instantaneous velocities, which is not identical to 4vMEAN2. Clinically, the pressure drop depends not only on the stenotic orifice area, but also on other factors, most prominently stroke volume. Orifice area can be measured directly by planimetry from 2D images in mitral and, transesophageally, in aortic stenosis. Alternatively, the continuity principle can be used, and stroke volume from another valve is divided by time–velocity integral of the stenotic valve to yield effective orifice area (if both valves are competent). It must be kept in mind, however, that the orifice area calculated by continuity is smaller than planimetric or (invasively obtained) Gorlin orifice area. Native mitral stenosis can also be estimated using the pressure half-time concept (Fig. 51.6). This concept, derived from hemodynamics, uses the time in which the pressure drop falls to one half of its initial value as an estimate of the severity of obstruction, which is less flow dependent than the pressure drop itself. Additionally, resistance of a stenosis can be calculated by dividing the mean pressure gradient (from the simplified Bernoulli equation) by the stroke volume. However, resistance appears to have no clear advantage over pressure drop and orifice area (16,17) in characterizing stenosis.
Evaluation of Regurgitation
Regurgitation is flow through a valve occurring in the wrong direction. Regurgitant flow velocities in the receiving chamber (e.g., the left atrium in mitral regurgitation) can be recorded by any DE modality. Regurgitation is easily identified on spectral or color DE as reverse flow, but difficult to quantify. In more than “trace” regurgitant lesions, regurgitant jets by color DE usually do not have a single color, but instead have a core region with a mosaic appearance containing all colors appearing in a rapidly changing pattern, surrounded by larger regions of pure red or blue (see Fig. 51.1). Most color DE algorithms also add a green hue to the basic red and blue to denote rapid velocity changes. The two main reasons for the mosaic appearance are that (i) jet core velocities in mitral and aortic regurgitation, and often in tricuspid regurgitation, are much higher than the aliasing velocity of the color map and thus, multiple aliasing occurs; and (ii) regurgitant jets almost always are truly turbulent, so that flow velocities in all directions occur in random fashion. Note that the color mosaic appearance does not necessarily denote true turbulence, and, on the other hand, in very severe regurgitation, when there is nearly pressure equalization between issuing and receiving chamber, the driving pressure difference between the chambers may become so small that a typical “turbulent jet” is absent.
The easiest way to grade regurgitation severity is by eyeballing or measuring the maximal color jet area of the regurgitant jet in the frame and the cross-section where it appears largest. Although a rough estimate of severity, it is more strongly related to the square of regurgitant flow velocity than to flow rate and therefore is highly load dependent. Specifically, color jet area is proportional to the transfer of momentum (the product of mass and velocity) over time in the regurgitant jet (18). Because color jet area is proportional to jet momentum flux, it is quadratically related to regurgitant flow velocity, whereas regurgitant volume or regurgitant fraction are linearly related to regurgitant velocity. In other words, a volume of blood regurgitating at a high velocity owing to a
high pressure difference has a larger color jet area than the same amount of blood regurgitating at a lower velocity owing to a lower pressure difference. Another important problem is that jets often are eccentric and may spread out on an adjacent wall (in the left atrium) or hug the anterior mitral leaflet (in aortic regurgitation). Eccentric jets are therefore substantially underestimated by color area (19). Finally, instrument settings, carrier frequency, and other factors influence the area of a regurgitant jet. Assessment of color jet size reliably discriminates mild from more severe regurgitation, but is unreliable to distinguish moderate and severe degrees of regurgitation. Several other methods are available to assess the severity of regurgitant lesions (20):
high pressure difference has a larger color jet area than the same amount of blood regurgitating at a lower velocity owing to a lower pressure difference. Another important problem is that jets often are eccentric and may spread out on an adjacent wall (in the left atrium) or hug the anterior mitral leaflet (in aortic regurgitation). Eccentric jets are therefore substantially underestimated by color area (19). Finally, instrument settings, carrier frequency, and other factors influence the area of a regurgitant jet. Assessment of color jet size reliably discriminates mild from more severe regurgitation, but is unreliable to distinguish moderate and severe degrees of regurgitation. Several other methods are available to assess the severity of regurgitant lesions (20):
The proximal jet diameter (Fig. 51.7A). This parameter, measured as the smallest diameter immediately downstream of the jet’s anatomic orifice, ideally represents the diameter of the regurgitant orifice area (ROA). Since this area is not necessarily circular, it can also be planimetered or two orthogonal diameters can be measured to calculate an ellipse area. Cut-off values with good discriminating power have been reported especially for mitral regurgitation, with diameters of more than 7 mm indicating severe regurgitation. The limiting factors are image quality, influence of gain, and measurement error.
Comparison of the stroke volume of different valves, if only one of them is insufficient. In mitral regurgitation, regurgitant volume is calculated by subtracting aortic stroke volume from total stroke volume, which is obtained either as mitral stroke volume or as the difference of diastolic and systolic left ventricular volumes. Aortic regurgitant volume can be calculated analogously. From the regurgitant volumes, ROA can be calculated by dividing regurgitant volume by the continuous wave time velocity integral of regurgitation. A ROA of more than 0.3 cm2 indicates severe mitral or aortic regurgitation. Although validated in dedicated hands, its accuracy depends on the reliability of all the stroke volume calculations and therefore is prone to errors.
The proximal convergence zone method (see Fig. 51.4). The concept is outlined above. Several derived parameters can be calculated from the maximal regurgitant flow rate Qmax:
ROA, for which maximal regurgitant flow velocity (vmax) must be additionally measured (by continuous wave DE): ROA = Qmax/vmax; for cut-off points see above. ROA can vary over the duration of regurgitation (21,22), but is less load dependent than maximal regurgitant flow rate.
Regurgitant volume (RV), which is the product of the regurgitant time velocity integral from continuous wave DE (TVI) and ROA: RV = TVI * ROA. Application of the proximal convergence zone method requires good image quality and works best for severe regurgitation because of the better delineation of the proximal convergence zone (see Fig. 51.4). Although applicable to any flow through a restrictive orifice, the method has been clinically validated for mitral regurgitation and stenosis (23). Its application to aortic regurgitation is less well validated than for mitral regurgitation (24).
Another useful approach is to search for reverse flow patterns upstream of the lesion (e.g., pulmonary or hepatic venous flow reversal in mitral and tricuspid regurgitation).
Flow Rates and Cardiac Output
Stroke volume across any flow cross-section and thus across any valve can in theory be calculated by multiplying the time–velocity integral across that valve by the corresponding valve orifice area. Usually, stroke volume (and hence, by multiplication with heart rate, cardiac output) is measured by multiplying the time–velocity integral of the pulsed DE signal of systolic transaortic flow by the aortic annular area (calculated by π * d2/4 where d is the aortic annulus diameter). An apical long axis view is used to acquire the pulsed DE recording, with the sample volume positioned at the annulus or, in the presence of aortic stenosis, in the outflow tract directly below the aortic valve (25). Stroke volume clinically is also frequently measured across the mitral and pulmonary valves. For mitral stroke volume, diameter of the annulus is measured in early diastole in the four-chamber view, a circular orifice is assumed, and area is multiplied with the time–velocity integral from pulsed DE at the annulus level. From such calculations, regurgitant volumes or shunt ratios (QP/QS) are derived (as the ratio of pulmonary stroke volume and left ventricular outflow tract stroke volume, if no pulmonary or aortic regurgitation is present). It should be noted that considerable errors may occur, mainly because of angle errors, skewed flow profiles, and irregular flow cross-sections. Techniques for automated integration of color DE velocities are becoming available, which in principle
take into account true flow profiles and compensate for angle errors.
take into account true flow profiles and compensate for angle errors.
Tissue Doppler Echocardiography and Deformation Imaging
These techniques provide information on global and regional left ventricular systolic and diastolic function. The largest clinical experience to date has been obtained with longitudinal shortening and elongation velocities of the left ventricular walls assessed by tissue DE in the three apical views. There is a systolic longitudinal shortening wave, leading to positive velocities toward the transducer, and two diastolic elongation waves, leading to negative velocities away from the transducer (see Fig. 51.2). Peak systolic velocity and early diastolic velocity (E′) are closely related to myocardial contraction and relaxation, and measurement of these velocities at the base of the left ventricular walls, for example, at the base of the septum and the lateral wall, give useful estimates of global systolic and diastolic function. Regional wall motion abnormalities, for example, in ischemic, stunned, hibernating, or scarred myocardium, exhibit lower than normal velocities (26). Furthermore, in ischemia, shortening in systole is delayed and reduced and extends past aortic valve closure into early diastole (“postsystolic shortening”). From the parasternal window, radial myocardial velocities (thickening and thinning) of posterior and anterior segments can be evaluated. Some instruments provide an angle correction to enable assessment of other short axis segments as well.
Unfortunately, discrimination of normal and abnormal velocities is not easy; longitudinal contraction velocities decrease from base to apex, are age and heart rate dependent, vary by segment, and are subject to tethering by the physical continuity between wall segments. Therefore, measurement of deformation (strain and strain rate) is theoretically better suited to regional analysis, because it largely eliminates tethering and translational effects (see Figs. 51.2B–F). However, deformation parameters are noisier than tissue velocities and prone to artifacts and thus often difficult to interpret.
The Clinical Blood Flow Doppler Examination
DE is performed via the same transducer used for 2D imaging. The position of the continuous wave cursor or the pulsed wave sample volume is displayed in the 2D image, and color DE maps are superimposed on the 2D image. The following practical points should be observed:
The interrogating beam should be aligned as well as possible with the direction of the flow interrogated. It is better to optimize the transducer position to enable optimal alignment than to use the angle correction option.
Several heart cycles should be recorded, especially in atrial fibrillation. Measuring only the highest velocities in a patient with atrial fibrillation leads to overestimation of gradients.
Both visual and audio output should be used to optimize the signal.
Attention should be paid to the timing of Doppler signals. For example, the mitral regurgitation signal, which may be mistaken for an aortic stenosis signal, begins earlier (immediately after mitral valve closure) than the aortic ejection signal.
There is no formal proof that the recorded velocities are truly the highest ones, because there is always the possibility of false placement or malalignment of the echo beam. Thus, especially in aortic stenosis all echo windows must be used to search for the highest velocities.
Artifacts: Clear flow velocity recordings by DE represent true blood velocities, but they can represent a flow that was not intended to record. An exception are mirror artifacts, which are created by very high amplitude signals (or too high gain) and duplicate an existing signal with inverse sign, or reverberations of color DE signals, which also duplicate real existing flow at a manifold of the real depth. An important example of the latter is “phantom flow” in transesophageal color DE images of the descending aorta, resulting in a “double-barrel” descending aorta.
Normal values for forward flow velocities depend on cardiac output, heart rate, and other factors. For instance, the ratio of early to late velocity of transmitral flow decreases with age, and so does the ratio of diastolic to systolic peak velocity of pulmonary venous flow.
Minimal or “trace” regurgitation by color and pulsed DE is frequently seen in all valves without clinical evidence of heart disease. The incidence increases with age.
All 2D windows are used for DE recordings. However, the best transducer position for DE interrogation almost regularly is not the best position for imaging. DE recordings can be sufficient even if 2D image quality is impaired, because the signal to noise ratio in DE recordings is higher than for 2D echo. Right parasternal windows (for aortic stenosis, with the patient in the right lateral decubitus position) and suprasternal windows (for aortic stenosis or aortic coarctation) are often helpful, as well as epigastric windows.
Gain, scale (which in pulsed and color DE is equivalent to pulse repetition frequency), baseline, and filter settings should be individualized to obtain a well-defined signal.
The Routine Examination and Normal Findings
Stay updated, free articles. Join our Telegram channel

Full access? Get Clinical Tree


