42 Atrial fibrillation (AF) is the most common cardiac arrhythmia in humans, is associated with increased morbidity and mortality, and has become a public health problem of the first order.1 However, currently available treatments for AF are less than satisfactory. On one hand, available antiarrhythmic drugs for the management of AF are not sufficiently effective and are hampered by significant cardiac and extracardiac side effects that frequently offset their therapeutic benefits.2 On the other hand, the demonstration of AF triggers in the atrial sleeves of the pulmonary veins (PVs)3 led to the adoption of interventional approaches to AF treatment that, by creating a set of circumferential lesions around the PV ostia, achieved substantial clinical success.4 However, the effectiveness of this therapy among the more prevalent and highly heterogeneous persistent and long-term persistent AF populations has been disappointing.5,6 This is mainly due to the incomplete understanding of the mechanisms underlying this complex arrhythmia.7,8 Traditionally, the study of AF has been based in the time-domain analysis of the signals recorded by a number of electrodes positioned at different locations. However, the ever-changing nature of AF showing extremely complex spatiotemporal activation precludes a straightforward interpretation. Thus, our understanding of the mechanisms of AF maintenance has been hindered in part by our inability to reproducibly quantify atrial rate and activation patterns during ongoing AF. To enhance our understanding of AF maintenance mechanisms, we followed a different approach that consisted of analysis of recordings of the arrhythmia in the frequency domain.9–18 The central objective of this chapter is to discuss experimental and clinical data from our laboratory supporting the hypothesis that acute AF in sheep and in some groups of human patients is not a totally random phenomenon. As will be demonstrated, the spatiotemporal organization of waves and dominant frequency (DF) in the isolated sheep heart suggests that AF maintenance depends on localized reentrant sources in the left atrium (LA) and fibrillatory conduction in its periphery.9–14 Motivated by these studies, we translated the analysis on the organization of DF to human AF. Using electroanatomic mapping in humans, we generated three-dimensional, whole-atrial DF maps and found that AF reentrant sources are localized primarily to the pulmonary veins in the case of paroxysmal AF but elsewhere in the case of chronic AF.15–18 An electropharmacologic approach was used to demonstrate the reentrant nature of this process and to successfully terminate AF targeting maximal DF (DFmax) sites in paroxysmal AF patients.16,17 Finally, simultaneous time and frequency-domain analyses in paroxysmal AF demonstrated that electrogram fractionation at the posterior LA wall is a reflection of fibrillatory conduction—a consequence of the dynamic interaction between high-frequency reentrant sources and the atrial anatomy—and should not be considered a target for ablation.18 The mechanisms of human AF are complex and are still poorly understood.7,8 The notion that a localized source of reentrant activity could maintain AF was first postulated by Lewis in the early part of the 20th century. A few decades later, the single reentrant mechanism evolved into a more complex proposition, which hypothesized that AF is maintained by randomly propagating multiple wavelets that meander, usually for a short time, then annihilate and perpetuate the regeneration of new wavelets.7,19 Nevertheless, toward the end of the 20th century, clinical studies provided evidence in support of a local driver mechanism of some cases of AF by observing sustained focal activity at the PVs, coronary sinus (CS), or superior vena cava that initiated and maintained AF and could be eliminated by discrete ablation.3,20 To this date, whether such sites are automatic, triggered, or reentrant remains unresolved. Overall, it has been established that the remodeling induced by persistent AF is probably increasing both the prevalence of spontaneous ectopic firing of atrial cells and the propensity for impulse reentry in the atrial substrate.21 Several lines of experiments have contributed to the assessment of the role of reentrant and ectopic activity in AF: pharmacologic22,23 and gene transfer24 reduction of outward K+ currents that prolong action potential duration (APD), thus suggesting a reduced propensity for reentry by suppressing AF. On the other hand, reducing inward Ca2+ current by stabilizing the sarcoplasmic reticulum release of Ca2+ can prevent AF, suggesting an important role for ectopic activity in the arrhythmia.25,26 Overall, from single reentry and multiple wavelets to single source focus propositions, we still lack a unifying hypothesis capable of convincingly explaining the mechanisms responsible for initiation and maintenance of the different types of AF. Characterizing the rate, regularity, and spatial patterns of electrical activation is the cornerstone of arrhythmia diagnosis and treatment. Early studies on regional differences in activation cycle length (CL) demonstrated that measurements of AF CL could contribute to discerning AF mechanisms and treatment.27–30 However, time-domain analyses of the signals recorded during ongoing AF are complex and are considerably subjective, often leading to inaccurate activation pattern characterization.18,31,32 In contrast, analysis in the frequency domain offers an alternative way to visualize AF electrograms for estimating the rate and regularity of activation without the need to manually measure intervals in the time domain.31,32 Fourier analysis provides the spectral decomposition of any time series into its constituent sinusoidal waveforms at all frequencies. The fast Fourier transform (FFT) enables estimation of the power spectrum of activity and provides a description of the stationary properties of the entire signal, where the highest peak corresponds to the dominant frequency (DF). When the activation amplitude and the CL are stable during the recording period, the DF corresponds to 1/CL and provides a robust estimation of CL.31 Which should be the preferable method for quantifying the local activation rate? To answer this question, we recently compared time- and frequency-domain methods, taking optical mapping recordings as a reference, and found a more robust correlation of the local activation rate in electrical versus optical signals by DF quantification than by the average CL quantification.32 The notion that the spatiotemporal complexity of wave propagation during AF was reflected in the local activation rate dispersion led us to characterize DF in the power spectrum throughout both atria; we found the DFs to be organized in discrete domains.9 Most notably, during the arrhythmia, the activation frequencies in certain areas of the LA were consistently faster than those in any other areas.9–12 In a search for the mechanisms underlying such frequency distribution in space, subsequent studies demonstrated the way interatrial pathways (i.e., Bachmann’s bundle and the inferoposterior interatrial pathway) mediate fibrillatory conduction and the establishment of frequency gradients between the LA and the right atrium (RA).12,13,33,34 In Figure 42-1, A, a DF map with a high degree of organization is shown, with discrete frequency domains and an LA-to-RA frequency gradient.12 For the most part, the DF was highest at the LA (18.8 Hz), intermediate at the right end of Bachmann’s bundle (14.5 Hz) and lowest at the RA (9.8 Hz). This pattern of DF domain distribution persisted for several minutes, with less than about 20% temporal variability.12 Moreover, results indicated that the largest decay in frequency occurred at the junction between Bachmann’s bundle and the RA, suggesting that the intricate three-dimensional architecture of the pectinate muscle network might be the substrate for fibrillatory propagation on the RA free wall.13,35 Further support for this hypothesis was sought by monitoring the direction of conduction along the preferential interatrial pathways.13 Figure 42-1, B illustrates an example of left-to-right propagation along Bachmann’s bundle during AF, where wave fronts propagated from left to right in 81% and 80% of the activations along Bachmann’s bundle and the inferoposterior interatrial pathway, respectively, in the direction of a decrease in DF value.13 These data suggest that in our model, AF results from impulses generated at high frequency by sources in the LA that propagate along interatrial pathways to activate the RA in a spatially complex manner. To further clarify the nature of LA-to-RA conduction, we used drugs that modified AF frequency. As shown in Figure 42-1, C, D, the reduction in the fastest LA frequency after D600 administration was followed by an increase in RA DF, whereas increasing acetylcholine (ACh) concentrations increased the LA-to-RA frequency gradient. An increase in the source frequency results in intermittent blockade caused by sink-to-source mismatch between the interatrial pathways and the RA components. In contrast, when the source frequency was reduced, RA DF increased (remaining lower than the DF of the LA), which indicates lesser mismatch at lower frequencies. Such a result is incompatible with the multiple wavelet hypothesis and can be explained only by a frequency-dependent change in fibrillatory propagation away from a source in the LA, allowing a greater number of waves to reach the RA at lower source frequencies. Thus it becomes evident that the RA frequency and, consequently, the LA-to-RA frequency gradient are determined by the LA frequency. Figure 42-1 Relation between activity in the left atrium and the right atrium While both atria are excited in a 1 : 1 manner at frequencies as high as 300 beats/min (5 Hz) during atrial flutter, AF ensues in the RA when stationary reentrant sources in the LA rotate at frequencies greater than 7 Hz.12,13 Does such a transformation depend on the input frequency? This suggests that there must be a critical frequency at which the 1 : 1 input-output relation between the LA and RA breaks down. In Figure 42-2, we show results of optical mapping experiments and DF analysis that demonstrate the principle of frequency-dependent breakdown in conduction.13 The preparation was subjected to periodic pacing at Bachmann’s bundle to simulate activity arriving from a periodic LA source into the RA. Although stimulation at 5.0 Hz resulted in 1 : 1 activation of the entire RA, a heterogeneous distribution of DF domains was established during pacing at 7.7 Hz, with frequencies ranging between 3.5 and 7.7 Hz. Figure 42-2 The “breakdown frequency” concept in a sheep heart In Figure 42-2, B, DFs are plotted as a function of the pacing frequency, showing that below 6.7 Hz, the activation response was 1 : 1 everywhere in the RA. Above the breakdown frequency of 6.7 Hz, a large DF dispersion manifested as multiple domains whose individual frequencies were equal to or lower than the pacing frequency. In addition, we found that intermittent block resulted in significant loss of consistency in the beat-to-beat direction of wave-front propagation, which provided a direct explanation for the difficulty involved in finding an origin of the activation during fibrillatory conduction.13 The general working hypothesis that acute AF results from the activity of a small number of high-frequency reentrant sources localized in one atrium, with fibrillatory conduction to the other atrium, is based primarily on results obtained in the isolated, Langendorff-perfused, sheep heart.9–12 We localized the sources that maintain AF by a combined use of optical mapping and frequency analysis. Figure 42-3, A, shows an AF episode in which the site of the high-frequency periodic activity was localized to the LA and persisted for the entire length of the episode (25 minutes).11 The fact that the frequency of this reentrant source (rotor) was equal to the highest and narrowest DF peak (most regular signal) recorded from all sites (optical and electrical recordings) provides direct evidence that it was the mechanism underlying AF (Figure 42-3, B).11 To assess the nature of the mechanism determining the DF of an episode, we studied the ACh dose dependence of its frequency.36 Figure 42-3, C, presents results in which a direct ACh dose dependence of rotor frequency was demonstrated in both atria, with the frequency being higher in the LA than in the RA at all concentrations. Figure 42-3 Reentrant sources of AF Several studies have suggested that AF is characterized by incomplete reentry and multiple unstable reentrant circuits,9,29,35,37,38 which seems to be consistent with the multiple wavelet hypothesis.7,19 However, in the presence of a single high-frequency source of stable reentry, electrical activity elsewhere could still present as incomplete or as short-lived and unstable reentrant circuits because of fibrillatory conduction.13 For instance, Schuessler et al.39 found that in an isolated canine right atrial preparation, increasing concentrations of ACh converted multiple reentrant circuits into a single, relatively stable high-frequency reentry that generated fibrillatory conduction. In agreement with this, our results (see Figure 42-3) support the hypothesis that a single source or a small number of sources of ongoing reentrant activity is the mechanism underlying AF in this setting.36 Adenosine and ACh are known to activate the same Kir3.x subfamily of inward-rectifier potassium channels through different signaling pathways.40 The current that arises from such activation is the same and may be termed IK,ACh or IK,Ado, depending on whether ACh or adenosine is the agonist.41,42 By increasing K+ conductance in the atrium, both ACh and adenosine hyperpolarize the cell membrane and abbreviate the action potential duration and refractory period, causing sinus slowing and acceleration of activation frequency.43 In our sheep model of AF, ACh increased atrial activation frequency (rotor DF) in a dose-dependent manner, with the effect being larger in LA than in RA, leading to an increase in the LA-to-RA frequency gradient (see Figure 42-3, C).36 Besides, adenosine inhibits isoproterenol-stimulated ICa,L, delayed rectifier K+ current, chloride current (Icl), the transient inward current, and the pacemaker current If in rabbit sinoatrial (SA) node43 and atrioventricular (AV) nodal cells,44 with a small inhibitory effect on basal L-type calcium current (ICa,L).42 As a consequence, afterdepolarizations and triggered arrhythmic activity induced by catecholamines are attenuated or abolished by adenosine.42 Several clinical studies have confirmed the existence of a hierarchical organization in the rate of activation of different regions in the atria of patients with paroxysmal and chronic AF.15–17,45,46 However, the reasons for such a specific frequency distribution and the underlying mechanisms responsible for AF maintenance remained unknown. We analyzed the effects of adenosine infusion on local activation frequency at different sites of the fibrillating atria to determine whether such sites are automatic, triggered, or reentrant and whether changes in the driver activity would alter spatial frequency gradients.15 The experimental observation of ACh dose-dependent acceleration of rotor frequency enabled translation of animal experiments to the patient with the use of adenosine.36 Thus, we determined the effects of adenosine infusion on DF at varying locations of both atria during ongoing AF.15 We also generated baseline DF maps of the LA using real-time spectral analysis that allowed determination of the specific DFmax sites likely to harbor the AF drivers. Figure 42-4 shows a representative example wherein the primary DFmax site located near the right inferior pulmonary vein (RIPV) (Panel A) significantly accelerated from 4.64 Hz at baseline to 6.35 Hz at the peak of the adenosine effect (Panel B). This observation clearly rules out late phase 3 early afterdepolarization (EAD)-induced triggered activity due to pause-dependent calcium overload after termination of rapid excitation.47–49 In this patient, the arrhythmia terminated during ablation at the primary DFmax site, supporting again the critical role of such sites as AF drivers. In a larger cohort, we analyzed the effect of adenosine on the activation rate in specific atrial regions. In paroxysmal AF patients, adenosine infusion increased local DF, particularly at the PV/LA region, amplifying a left-to-right frequency gradient (Figure 42-5).15 In persistent AF, baseline DF was significantly higher than in paroxysmal AF patients at all atrial sites, and the highest-frequency sources accelerated by adenosine were located in either atrium but not at PV sites.15 In sum, adenosine infusion increased frequency primarily at sites that activated at the highest rate at baseline, demonstrating that those sites are involved in the maintenance of AF. Adenosine-induced acceleration of activation frequency points toward reentry as the mechanism of AF maintenance in these patients and all but rules out an automatic or triggered mechanism.15,49 These results support the idea that AF in humans is maintained by high-frequency reentrant sources that have different locations in paroxysmal compared with persistent AF patients.15,49 Figure 42-4 Accelerating effect of adenosine on DFmax sites Figure 42-5 IK,ACh current distribution and density parallel DF spatial distribution and adenosine response in paroxysmal and persistent AF patients
Dominant Frequency and the Mechanisms of Initiation and Maintenance of Atrial Fibrillation
Background
Current Strategies and Shortcomings in AF Treatment
Hypothesized Mechanisms Initiating and Maintaining AF
Localized Ectopic Triggers Versus Reentry
The Dominant Frequency Concept and Translation from Bench to Bedside
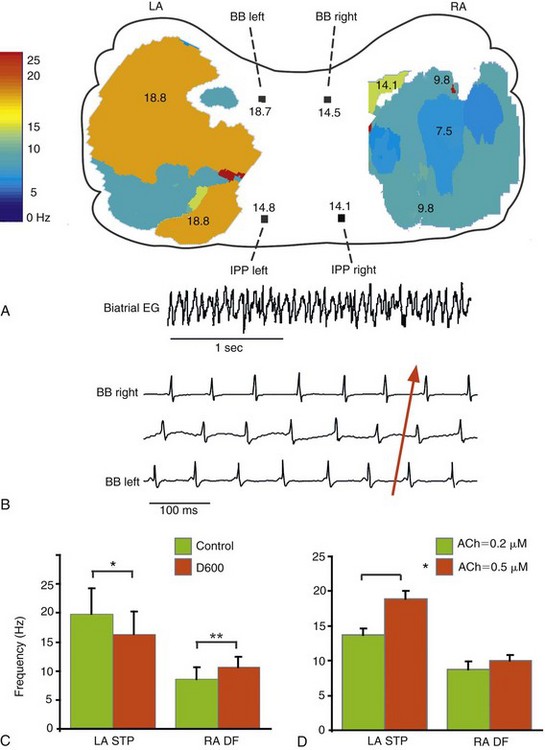
A, LA-to-RA gradient in dominant frequency (DF). DF maps of the epicardial surfaces of LA and RA, with values of DF along Bachmann’s bundle (BB) and the inferoposterior pathway (IPP). Numbers are expressed in Hertz. The colored areas of the DF maps indicate the optical mapping fields. B, Left-to-right directionality of impulse propagation during AF. Recordings from a bi-atrial ECG (top trace) and three bipolar electrodes along BB, the tracing on the bottom being most leftward. Effect of D600 (C) and acetylcholine (D) on LA and RA frequencies. LA STP, Frequencies of LA spatiotemporal periodicity; RA DF, right atrial dominant frequency. ACh, Acetylcholine; EG, electrogram; LA, left atrium; RA, right atrium. (Reproduced from Mansour M, Mandapati R, Berenfeld O, et al: Left-to-right gradient of atrial frequencies during acute atrial fibrillation in the isolated sheep heart. Circulation 103:2631-2636, 2001.)
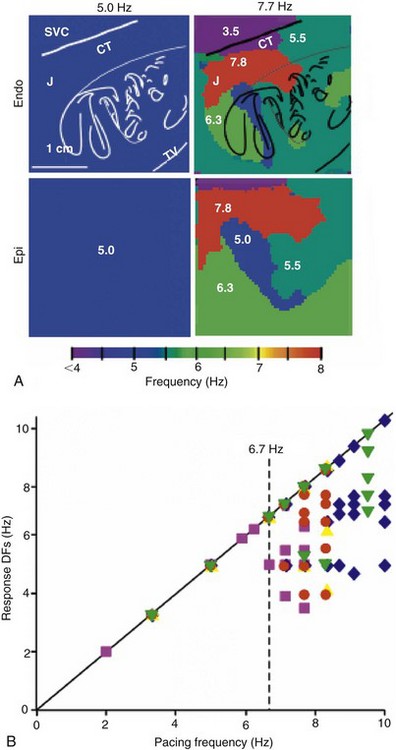
Left, Endocardial and epicardial DF maps of the same isolated RA preparation paced at 5.0 and 7.7 Hz. Note the appearance of the heterogeneous DF domains at 7.7 Hz. Right, Response of DFs versus pacing rate (n = 5). Each symbol represents one experiment. Pacing BB at rates below ≈6.7 Hz results in 1 : 1 activation. At higher rates, the number of domains increases but the value of the DFs decreases. (Reproduced from Berenfeld O, Zaitsev AV, Mironov SF, et al: Frequency-dependent breakdown of wave propagation into fibrillatory conduction across the pectinate muscle network in the isolated sheep right atrium. Circ Res 90:1173-1180, 2002.)
Activation of Inward-Rectifier Potassium Channels to Establish Underlying Mechanisms of AF
ACh and AF Frequency in the Sheep Model
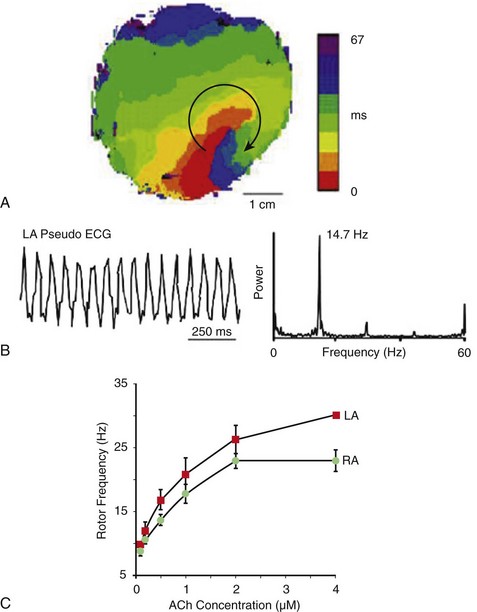
A, Isochrone map of optical activity from the free wall of the LA during sustained AF showing a vortex that rotated clockwise at a period of 68.6 ± 8.9 ms (≈14.7 Hz). B, Optical pseudo-ECG of LA during the same episode of AF with its corresponding power spectrum. C, ACh dose-response curves created using rotation frequencies from the five longest living rotors for each of six experiments during AF at each ACh concentration. An increase in rotor frequency with ACh, as well as LA (red) predominance over RA (green), is visible. (A, B, Reproduced from Mandapati R, Skanes A, Chen J, et al: Stable microreentrant sources as a mechanism of atrial fibrillation in the isolated sheep heart. Circulation 101:194-199, 2000. C, Reproduced from Ortiz J, Niwano S, Abe H, et al: Mapping the conversion of atrial flutter to atrial fibrillation and atrial fibrillation to atrial flutter: Insights into mechanisms. Circ Res 74:882-894, 1994.)
ACh and Adenosine Slow Rate of Automatic Pacemaking
Adenosine and AF Frequency in Patients
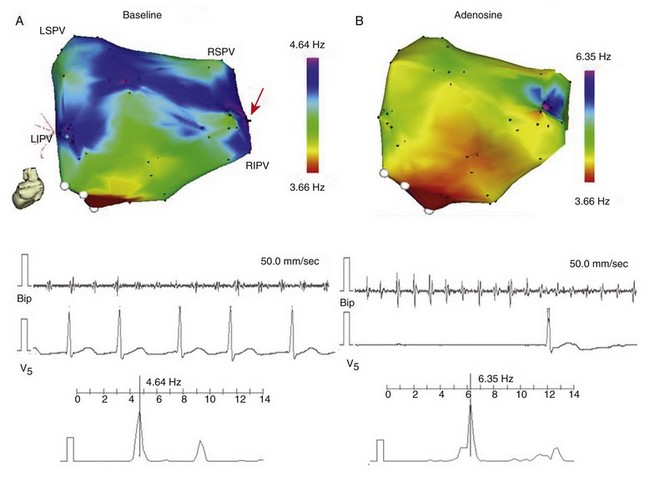
A, Real-time DF map of LA (posterior view) before infusion of adenosine, from a paroxysmal AF patient. Red arrow indicates primary DFmax site near the RIPV. Baseline recording at the primary DFmax site with its power spectrum and simultaneous V5 reference. B, Recording at the primary DFmax site with power spectrum and simultaneous V5 reference during peak adenosine effect, showing increase in DF. LSPV, LIPV, RSPV, RIPV, Left/right superior/inferior pulmonary veins (PVs); Bip, bipolar catheter. (Reproduced from Atienza F, Almendral J, Moreno J, et al: Activation of inward rectifier potassium channels accelerates atrial fibrillation in humans: Evidence for a reentrant mechanism. Circulation 114:2434-2442, 2006.)
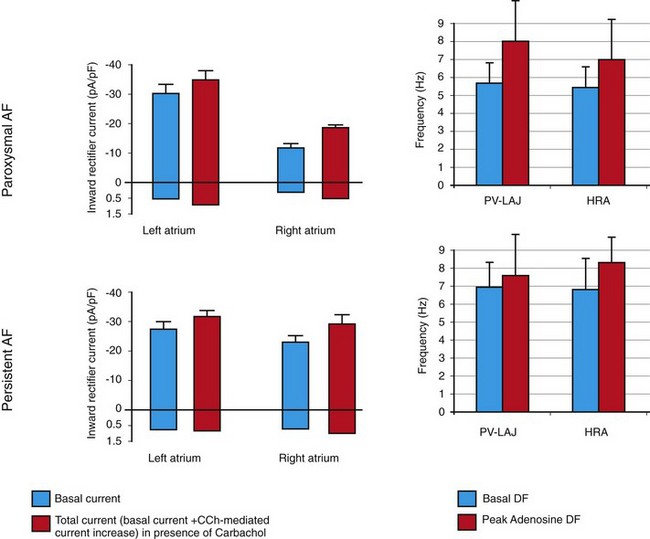
Right panels, Mean ± SD of DF for and high RA (HRA) at baseline (white) and peak adenosine effect (black) in paroxysmal and persistent AF patients. Left panels, Inward-rectifier currents in RA and LA myocytes from paroxysmal and persistent AF patients (mean ± SD). White, Basal current in absence of PV-LA junction (PV-LAJ) carbachol (CCh). Black, Total current (basal current + CCh-mediated current increase) in the presence of CCh. (Right panels, Reproduced from Atienza F, Almendral J, Moreno J, et al: Activation of inward rectifier potassium channels accelerates atrial fibrillation in humans: Evidence for a reentrant mechanism. Circulation 114:2434-2442, 2006. Left panels,![]()
Stay updated, free articles. Join our Telegram channel

Full access? Get Clinical Tree


Dominant Frequency and the Mechanisms of Initiation and Maintenance of Atrial Fibrillation
