Current screening and detection of asymptomatic aortic aneurysms is based largely on uniform cut-point diameters. The aims of this study were to define normal aortic diameters in asymptomatic men and women in a community-based cohort and to determine the association between aortic diameters and traditional risk factors for cardiovascular disease. Measurements of the diameters of the ascending thoracic aorta (AA), descending thoracic aorta (DTA), infrarenal abdominal aorta (IRA), and lower abdominal aorta (LAA) were acquired from 3,431 Framingham Heart Study (FHS) participants. Mean diameters were stratified by gender, age, and body surface area. Univariate associations with risk factor levels were examined, and multivariate linear regression analysis was used to assess the significance of covariate-adjusted relations with aortic diameters. For men, the average diameters were 34.1 mm for the AA, 25.8 mm for the DTA, 19.3 mm for the IRA, and 18.7 mm for the LAA. For women, the average diameters were 31.9 mm for the AA, 23.1 mm for the DTA, 16.7 mm for the IRA, and 16.0 mm for the LAA. The mean aortic diameters were strongly correlated (p <0.0001) with age and body surface area in age-adjusted analyses, and these relations remained significant in multivariate regression analyses. Positive associations of diastolic blood pressure with AA and DTA diameters in both genders and pack-years of cigarette smoking with DTA diameter in women and IRA diameter in men and women were observed. In conclusion, average diameters of the thoracic and abdominal aorta by computed tomography are larger in men compared with women, vary significantly with age and body surface area, and are associated with modifiable cardiovascular disease risk factors, including diastolic blood pressure and cigarette smoking.
In individuals without diagnosed aneurysms, there is a paucity of community-based data in large numbers of men and women regarding aortic diameter thresholds for the detection of aortic dilatation above which patients should be monitored or referred for surgical consultation. According to the 2010 guidelines for the diagnosis and management of patients with thoracic aortic disease, an ascending aortic diameter of 5.5 cm is used for most patients without genetically mediated aortic syndromes, despite the knowledge that important patient variables, such as age, gender, and body surface area (BSA), may be associated with normal aortic dimensions and the significance of relative dilatation. Although data are sparse regarding normal diameters of various aortic cross sections in the general population, such data are needed for evaluating the existing standards for aortic aneurysms and for prevention. A recent analysis of the International Registry of Acute Aortic Dissection (IRAD) database found that 60% of patients with dissections had ascending aortic diameters less than the 5.5-cm cut-off value, demonstrating that a “one-size-fits-all” value may not be sufficient to prevent most thoracic aortic dissections. In this study, we establish the distribution of age- and BSA-specific measurements and cut points for normal aortic diameters assessed by computed tomography (CT) in a community-based cohort of adult men and women and identify the cardiovascular disease risk factor correlates of large aortic diameters.
Methods
Participants were drawn from an imaging substudy of the community-based Framingham Heart Study (FHS) Offspring Study and Third-Generation Study cohorts. Beginning in 1948, 5,209 men and women aged 28 to 62 years were enrolled in the original cohort of the FHS. The offspring and spouses of the offspring of the original cohort were enrolled in the Offspring Study starting in 1971. Beginning in 2002, 4,095 Third-Generation Study participants, who had ≥1 parent in the offspring cohort, were enrolled in the FHS and underwent standard clinic examinations. The standard clinic examination included a physician interview, a physical examination, and laboratory tests, as previously described.
For the present analysis, the substudy sample consisted of Offspring Study and Third-Generation Study participants in the multidetector CT (MDCT) substudy. From June 2002 to April 2005, 3,529 participants underwent MDCT for the assessment of coronary and aortic calcium, 1,418 from the offspring generation and 2,111 from the third generation. Of the 3,529 participants scanned, 3,505 attended offspring exam 7 or generation 3 exam 1. Of these, 3,496 had complete risk factor profiles and were available for analysis. Of the 3,496 participants, 65 (1.9%) had incomplete computed tomographic data. Thus, the final analysis was performed in 3,431 participants of the overall study cohort.
Participant ascertainment for the MDCT study has been previously described. For inclusion, men were aged ≥35 years, women were aged ≥40 years and not pregnant, and all participants weighed <350 lb. The study was approved by the institutional review boards of the Boston University Medical Center and the Massachusetts General Hospital. All participants provided written informed consent.
All participants underwent thoracic electrocardiographically gated, non-contrast-enhanced MDCT in a supine position using an 8-slice multidetector computed tomographic scanner (LightSpeed Ultra; GE Healthcare, Milwaukee, Wisconsin). In the thorax, contiguous 2.5-mm slices (tube voltage 120 kVp, tube current 320 mA if body weight <220 lb and 400 mA if body weight >220 lb, gantry rotation time 500 ms, table feed 3:1) were acquired from the level of the carina to the level of the diaphragm. Two acquisitions were conducted during end-inspiratory breath holds (typical duration 18 seconds). Image acquisition was prospectively triggered in early diastole at 50% of the cardiac cycle. In the abdomen, 25 contiguous 5-mm slices (tube voltage 120 kVp, tube current 400 mA, gantry rotation time 500 ms, table feed 3:1) were acquired covering 125 mm above the level of the first sacral vertebral body.
At each FHS examination, information regarding risk-factor levels was obtained from a history and physical examination obtained by a physician and by laboratory testing, as previously described. Cardiovascular disease outcomes were defined by the presence of coronary heart disease, stroke, peripheral arterial disease, or heart failure and were determined by a 3-physician end point committee, as previously described. A history of valve surgery or of surgery of the thoracic aorta or abdominal aorta was obtained by the physician examiner during the interview portion of the participant examination by a physician.
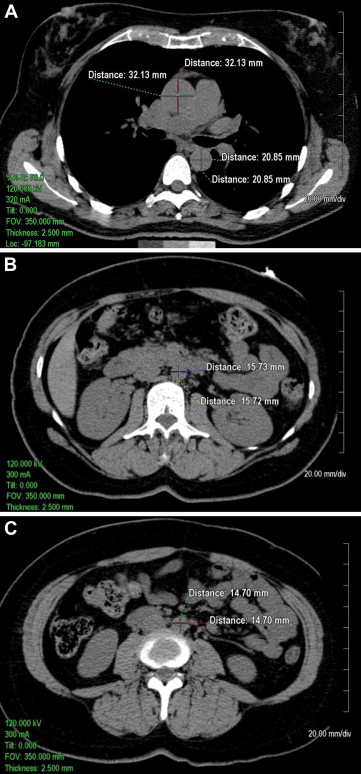
Quantitative measurements of thoracic and abdominal aortic diameters were acquired using the 2.5-mm axial slices acquired during the scan on an Aquarius 3D Workstation (Tera Recon Inc., San Mateo, California). As shown in Figure 1 , measurements of the diameters of the ascending thoracic aorta (AA) and descending thoracic aorta (DTA) were acquired on axial slices at the level of the right pulmonary artery. Measurements of the abdominal aorta were acquired on axial slices at 1 slice level 5 cm above the aortoiliac bifurcation (infrarenal abdominal aorta [IRA]) and at 1 slice level above the bifurcation of the abdominal aorta into the common iliac arteries (lower abdominal aorta [LAA]). The measurements were traced manually from outside wall to outside wall of the aorta in the anteroposterior and transverse planes. At each of the 4 locations (i.e., AA, DTA, IRA, and LAA), the mean of anteroposterior and transverse measurements was calculated (mean AA diameter, mean DTA diameter, mean IRA diameter, and mean LAA diameter, respectively). Mean values were used to help control for obliquity of the vasculature on a small number of scans inherent in the use of axial images.
To assess interobserver and intraobserver measurement reliability, reliability measurements were acquired in a random subset of 100 participants (age range 37 to 83 years, 49% women) drawn from the FHS offspring. The random sample included approximately equal numbers of men and women and approximately equal numbers of participants in the each of the age groups of 35 to 44, 45 to 54, 55 to 64, 65 to 74, and 75 to 84 years. To evaluate interobserver reliability, 2 of the trained observers performed independent measurements of the 100-participant subset in random order. To evaluate intraobserver reliability, 1 of the observers independently repeated these measurements 1 week later in random order. The intraobserver intraclass correlation coefficient was >0.97 (range 0.97 to 0.99), suggesting an excellent correlation between reads, with an average difference of 0.5 mm between reads. There was also an excellent interobserver intraclass correlation between readers (all r values >0.96, range 0.96 to 0.99), with an average difference of 0.8 mm between readers across the measurements.
Gender-specific, age-adjusted Pearson’s correlation coefficients were used to assess univariate correlations between aortic diameters and traditional cardiovascular disease risk factors (age, BSA, systolic blood pressure, diastolic blood pressure, pack-years of smoking, fasting plasma glucose, total cholesterol, triglycerides, and high-density lipoprotein cholesterol). Gender-specific multivariate stepwise linear regression, with age forced into the model, was used to identify traditional risk factors independently associated with aortic diameters; a significance level of 0.05 was used in the stepwise model.
Risk factor data acquired at FHS examinations were then used to create a healthy reference sample after excluding participants with the following conditions from the overall study sample: atherosclerotic cardiovascular disease, hypertension, and previous surgery of the heart valves, thoracic aorta, or abdominal aorta. Mean aortic diameters and percentiles were then calculated for the healthy reference sample, stratified by age (<45, 45 to 54, 55 to 64, and >65 years), gender, and BSA (<1.9, 1.9 to 2.09, and ≥2.1 m 2 for men and <1.7, 1.7 to 1.89, and ≥1.9 m 2 for women). Similar calculations were made for the entire sample.
The 90th-percentile aortic diameter was defined at each measurement location. Multivariate logistic regression analysis in the entire sample was used to further identify independent risk factors for dilatation, defined as aortic diameter >90th percentile of the healthy referent cohort. Covariates included in the multivariate model included age, BSA, hypertension, dyslipidemia, smoking, and diabetes. Finally, we used gender- and age-specific simple linear regression of each diameter versus BSA to create nomograms to demonstrate expected aortic diameter versus BSA by gender and age group and to create a formula for calculating the predicted normal range of aortic diameters at each location, accounting for age, gender, and BSA.
Results
As listed in Table 1 , the mean age and BSA were 52 ± 10 years and 1.8 ± 0.2 m 2 , respectively, for women and 50 ± 11 years and 2.1 ± 0.2 m 2 , respectively, for men. Approximately 27% of women and 32% of men had hypertension. The healthy referent cohort consisted of a total of 2,343 participants after excluding 1,088 participants with cardiovascular disease, hypertension, and/or previous surgery of heart valves, thoracic aorta, or abdominal aorta.
| Variable | Overall (n = 3,431) | Women (n = 1,664) | Men (n = 1,767) |
|---|---|---|---|
| Age (yrs) | 50.9 ± 10.4 | 52.2 ± 9.9 | 49.8 ± 10.7 |
| Body surface area (m 2 ) | 1.9 ± 0.3 | 1.8 ± 0.2 | 2.1 ± 0.2 |
| Body mass index >30 kg/m 2 | 947 (27.6%) | 430 (25.8%) | 517 (29.3%) |
| Systolic blood pressure (mm Hg) | 122 ± 16 | 120.3 ± 18 | 123.6 ± 15 |
| Diastolic blood pressure (mm Hg) | 76 ± 9 | 74 ± 9 | 78 ± 9 |
| Hypertension | 1,006 (29.4%) | 443 (26.6%) | 563 (31.9%) |
| Smoking status | |||
| Current | 444 (12.9%) | 204 (12.3%) | 240 (13.6%) |
| Former | 1,345 (39.2%) | 704 (42.3%) | 641 (36.3%) |
| Never | 1,642 (47.9%) | 756 (45.4%) | 886 (50.1%) |
| Smoking amount (pack-years) | |||
| Current ∗ | 37.7 ± 21.2 | 35.5 ± 18.3 | 40.1 ± 23.9 |
| Former ∗ | 21.5 ± 19.7 | 16.8 ± 16.5 | 26.4 ± 21.5 |
| Diabetes mellitus | 220 (6.4%) | 90 (5.4%) | 130 (7.4%) |
| Fasting plasma glucose (mg/dl) | 99.2 ± 21.4 | 95.7 ± 17.9 | 102.4 ± 23.8 |
| Total cholesterol (mg/dl) | 196.4 ± 35.3 | 198.1 ± 36.3 | 194.8 ± 34.3 |
| Triglycerides (mg/dl) | 128.5 ± 91.5 | 113.5 ± 68.3 | 142.6 ± 107.1 |
| High-density lipoprotein cholesterol (mg/dl) | 53.3 ± 16.6 | 61.3 ± 16.8 | 45.9 ± 12.4 |
| Coronary artery disease | 205 (6%) | 71 (4.3%) | 134 (7.6%) |
| Valvular heart disease | 35 (1%) | 14 (0.8%) | 21 (1.1%) |
For all men, the average diameters were 34.1 ± 3.9 mm (range 23.1 to 49.6) for the AA, 25.8 ± 3.0 mm (range 17.9 to 55.2) for the DTA, 19.3 ± 2.9 mm (range 12.8 to 69.9) for IRA, and 18.7 ± 2.7 mm (range 12.9 to 48.5) for the LAA. For all women, the average diameters were 31.9 ± 3.5 mm (range 21.6 to 48.0) for the AA, 23.1 ± 2.6 mm (range 16.8 to 47.2) for the DTA, 16.7 ± 1.8 mm (range 12.0 to 33.0) for the IRA, and 16.0 ± 1.7 mm (range 11.1 to 33.5) for the LAA.
Gender-specific, age-adjusted univariate Pearson’s correlations between continuous measures of cardiovascular disease risk factors and aortic were calculated. The mean diameters of the AA and DTA were correlated (p <0.0001) with age (0.44 to 0.66), BSA (0.31 to 0.41), systolic blood pressure (0.15 to 0.20), and diastolic blood pressure (0.18 to 0.26) in both genders. The mean diameters of the IRA and LAA were correlated (p <0.0001) with age (0.32 to 0.48) and BSA (0.22 to 0.35) in both genders. Weaker correlations (0.03 to 0.14) were noted for abdominal aortic diameters with blood pressure measurements in both genders, with systolic blood pressure (0.09) and diastolic blood pressure (0.14) associated with IRA mean diameter in women and diastolic blood pressure (0.10) associated with LAA mean diameter in women. There were positive correlations of pack-years of cigarette smoking with IRA (0.34, 0.45) and LAA (0.25, 0.28) diameters in men and women and of fasting plasma glucose with IRA (0.08), LAA (0.06), and DTA (0.09) diameters in women and with AA (0.08) and DTA (0.10) diameters in men. Inverse correlations were noted of high-density lipoprotein cholesterol with IRA (−0.08), LAA (−0.07), and DTA (−0.10) diameters in men and with AA (−0.05) and DTA (−0.09) diameters in women. Paradoxical inverse correlations of very small magnitude were noted for total cholesterol with IRA (−0.07, −0.05) and LAA (−0.08, −0.07) diameters in men and women and with DTA diameter (−0.08) in men.
Multivariate stepwise linear regression analysis was performed between continuous cardiovascular disease risk factors and aortic diameters. For every 1-year increase in age, the mean diameter of the AA was higher by 0.16 mm in women and 0.2 mm in men, the mean DTA diameter was higher by 0.16 mm in women and 0.19 mm in men, the mean IRA diameter was higher by 0.09 mm in women and 0.13 mm in men, and the mean LAA diameter was higher by 0.07 mm in women and 0.12 mm in men. For every 0.1-m 2 increase in BSA, the mean AA diameter was higher by 4.14 mm in women and 5.8 mm in men, the mean DTA diameter was higher by 3.61 mm in women and 4.15 mm in men, the mean IRA diameter was higher by 2.38 mm in women and 2.92 mm in men, and the mean LAA diameter was higher by 3.11 mm in women and 2.90 mm in men. Of note, for every 1 mm Hg increase in diastolic blood pressure, the mean AA diameter was higher by 0.06 mm in women and 0.08 mm in men, and the mean DTA diameter was higher by 0.03 mm in women and men. The mean IRA diameter was higher by 0.3 mm in women and 0.27 mm in men with histories of cigarette smoking.
The distributions of aortic diameters by gender, age, and BSA are listed for all men and all women in Tables 2 to 5 for the AA, DTA, IRA, and LAA, respectively. The distributions of aortic diameters by gender, age, and BSA, along with the prevalence of aortic diameters >90th percentile of the healthy referent group by gender, age, and BSA, are listed for men and women in the healthy referent cohort in Supplemental Tables 1a to 1d for the AA, DTA, IRA, and LAA, respectively. Within each gender, diameter increased with increasing age and BSA. Diameters for participants in the healthy referent group were similar to those of the entire cohort across the spectrum of age and BSA categories and measurement locations. Diameters indexed to BSA by age and gender are presented in Supplemental Tables 2a and 2b .
| Age (yrs) | All Women | All Men | ||||||||||
|---|---|---|---|---|---|---|---|---|---|---|---|---|
| BSA (m 2 ) | Mean | 25th | 50th | 75th | 90th | BSA (m 2 ) | Mean | 25th | 50th | 75th | 90th | |
| <45 | <1.7 | 28.8 | 27.0 | 28.5 | 30.9 | 32.1 | <1.9 | 30.3 | 28.2 | 30.1 | 32.5 | 34.2 |
| 1.7–1.89 | 30.2 | 28.0 | 30.3 | 31.8 | 33.8 | 1.9–2.09 | 31.1 | 29.4 | 31.1 | 32.5 | 34.5 | |
| ≥1.9 | 31.1 | 28.9 | 31.1 | 33.2 | 35.4 | ≥2.1 | 33.2 | 30.8 | 32.8 | 34.9 | 37.0 | |
| 45–54 | <1.7 | 29.8 | 27.9 | 29.7 | 32.0 | 33.8 | <1.9 | 32.6 | 30.1 | 33.0 | 34.5 | 36.4 |
| 1.7–1.89 | 31.5 | 29.7 | 31.5 | 33.3 | 35.0 | 1.9–2.09 | 33.5 | 31.1 | 33.5 | 35.7 | 37.4 | |
| ≥1.9 | 32.8 | 30.8 | 32.5 | 35.1 | 36.8 | ≥2.1 | 34.9 | 32.6 | 34.5 | 36.8 | 39.3 | |
| 55–64 | <1.7 | 32.3 | 30.1 | 32.3 | 34.0 | 37.2 | <1.9 | 34.5 | 32.4 | 34.7 | 36.5 | 38.1 |
| 1.7–1.89 | 33.5 | 31.5 | 33.5 | 35.3 | 37.2 | 1.9–2.09 | 34.7 | 32.5 | 34.3 | 36.6 | 39.0 | |
| ≥1.9 | 33.7 | 31.6 | 33.6 | 35.7 | 37.6 | ≥2.1 | 36.8 | 34.5 | 36.4 | 38.6 | 40.7 | |
| ≥65 | <1.7 | 33.9 | 32.1 | 33.7 | 35.7 | 38.0 | <1.9 | 36.2 | 33.3 | 35.3 | 38.4 | 42.2 |
| 1.7–1.89 | 33.9 | 32.3 | 33.6 | 35.9 | 37.9 | 1.9–2.09 | 36.7 | 34.5 | 36.3 | 39.0 | 40.7 | |
| ≥1.9 | 35.1 | 33.0 | 34.6 | 37.1 | 39.6 | ≥2.1 | 38.6 | 36.1 | 38.3 | 41.3 | 43.4 | |
| Age (yrs) | All Women | All Men | ||||||||||
|---|---|---|---|---|---|---|---|---|---|---|---|---|
| BSA (m 2 ) | Mean | 25th | 50th | 75th | 90th | BSA (m 2 ) | Mean | 25th | 50th | 75th | 90th | |
| <45 | <1.7 | 20.5 | 19.5 | 20.5 | 21.4 | 22.2 | <1.9 | 22.5 | 21.5 | 22.2 | 23.4 | 25.0 |
| 1.7–1.89 | 21.5 | 20.5 | 21.4 | 22.6 | 23.6 | 1.9–2.09 | 23.5 | 22.4 | 23.2 | 24.4 | 25.6 | |
| ≥1.9 | 22.2 | 21.2 | 22.1 | 23.2 | 24.6 | ≥2.1 | 24.7 | 23.2 | 24.6 | 25.9 | 27.0 | |
| 45–54 | <1.7 | 21.5 | 20.2 | 21.5 | 22.6 | 23.8 | <1.9 | 24.3 | 23.2 | 24.0 | 25.5 | 26.8 |
| 1.7–1.89 | 22.7 | 21.5 | 22.5 | 23.8 | 24.8 | 1.9–2.09 | 24.9 | 23.6 | 24.8 | 26.2 | 27.5 | |
| ≥1.9 | 23.6 | 22.2 | 23.6 | 24.8 | 26.0 | ≥2.1 | 26.0 | 24.6 | 26.0 | 27.2 | 28.5 | |
| 55–64 | <1.7 | 23.1 | 21.7 | 23.1 | 24.4 | 25.3 | <1.9 | 25.8 | 24.1 | 25.6 | 27.3 | 28.5 |
| 1.7–1.89 | 24.0 | 22.6 | 24.0 | 25.1 | 26.3 | 1.9–2.09 | 26.4 | 25.0 | 26.3 | 27.7 | 28.8 | |
| ≥1.9 | 24.8 | 23.9 | 24.8 | 26.0 | 27.3 | ≥2.1 | 27.7 | 26.1 | 27.9 | 29.2 | 30.3 | |
| ≥65 | <1.7 | 25.0 | 23.2 | 24.8 | 26.1 | 27.7 | <1.9 | 28.4 | 26.8 | 28.2 | 29.6 | 30.9 |
| 1.7–1.89 | 25.4 | 24.2 | 25.3 | 27.0 | 28.1 | 1.9–2.09 | 28.8 | 27.2 | 28.2 | 30.1 | 31.6 | |
| ≥1.9 | 27.1 | 25.5 | 26.5 | 28.4 | 30.3 | ≥2.1 | 30.3 | 28.4 | 29.9 | 32.0 | 33.0 | |
| Age (yrs) | All Women | All Men | ||||||||||
|---|---|---|---|---|---|---|---|---|---|---|---|---|
| BSA (m 2 ) | Mean | 25th | 50th | 75th | 90th | BSA (m 2 ) | Mean | 25th | 50th | 75th | 90th | |
| <45 | <1.7 | 15.2 | 14.3 | 15.2 | 16.1 | 16.6 | <1.9 | 16.9 | 16.1 | 16.8 | 17.8 | 18.5 |
| 1.7–1.89 | 16.0 | 15.0 | 15.9 | 16.8 | 17.7 | 1.9–2.09 | 17.6 | 16.8 | 17.5 | 18.5 | 19.5 | |
| ≥1.9 | 16.3 | 15.4 | 16.2 | 17.2 | 17.8 | ≥2.1 | 18.5 | 17.6 | 18.5 | 19.5 | 20.2 | |
| 45–54 | <1.7 | 15.8 | 15.0 | 15.7 | 16.5 | 17.5 | <1.9 | 18.4 | 17.4 | 18.5 | 19.1 | 20.7 |
| 1.7–1.89 | 16.6 | 15.6 | 16.5 | 17.6 | 18.4 | 1.9–2.09 | 18.8 | 17.8 | 18.7 | 19.8 | 20.9 | |
| ≥1.9 | 17.0 | 16.1 | 17.0 | 18.0 | 19.0 | ≥2.1 | 19.4 | 18.5 | 19.3 | 20.3 | 21.2 | |
| 55–64 | <1.7 | 16.4 | 15.2 | 16.4 | 17.5 | 18.6 | <1.9 | 18.9 | 17.5 | 18.8 | 20.1 | 21.5 |
| 1.7–1.89 | 17.2 | 16.3 | 17.3 | 18.1 | 19.0 | 1.9–2.09 | 19.4 | 18.0 | 19.0 | 20.6 | 21.5 | |
| ≥1.9 | 17.6 | 16.6 | 17.6 | 18.5 | 19.3 | ≥2.1 | 20.7 | 19.0 | 20.2 | 21.7 | 22.9 | |
| ≥65 | <1.7 | 17.8 | 16.2 | 17.5 | 18.7 | 20.7 | <1.9 | 21.0 | 19.1 | 20.2 | 21.7 | 24.6 |
| 1.7–1.89 | 17.8 | 16.8 | 17.7 | 18.6 | 20.0 | 1.9–2.09 | 21.8 | 19.5 | 20.7 | 22.6 | 25.5 | |
| ≥1.9 | 18.7 | 17.1 | 18.3 | 19.5 | 21.8 | ≥2.1 | 22.5 | 19.8 | 21.4 | 23.3 | 26.0 | |
Stay updated, free articles. Join our Telegram channel

Full access? Get Clinical Tree


