The diagnostic yield of continuous electrocardiographic (ECG) monitoring in children for periods longer than a Holter monitor is unclear. The aim of this study was to characterize diagnostic yield, arrhythmia type, and time to first arrhythmia using a clinical repository of national ambulatory ECG data in children. A cross-sectional study was performed in 3,209 consecutive children receiving a 14-day adhesive patch monitor (Zio Patch) for clinical indications from January 2011 to December 2013. Of the 3,209 children (56% female, mean age 12.5 ± 4.4 years, range 1 month to 17 years), 390 had arrhythmias detected, making the diagnostic yield 12.2%. Of these, 137 patients (4.3%) had arrhythmias deemed clinically significant to warrant urgent physician notification. The most frequent indications for monitoring were palpitations (n = 1,138 [35.5%]), syncope (n = 450 [14.0%]), unspecified tachycardia (n = 291 [9.1%]), supraventricular tachycardia (n = 264 [8.2%]), and chest pain (n = 261 [8.1%]). Arrhythmias were detected in 10.0% of patients with palpitations, 6.7% of patients with syncope, 14.8% of patients with tachycardia, 22.7% of patients with supraventricular tachycardia, and 6.5% of patients with chest pain. The mean times to first detected and first symptom-triggered arrhythmias were 2.7 ± 3.0 and 3.3 ± 3.3 days, respectively. Forty-four percent of first detected arrhythmias and 50.4% of the first symptom-triggered arrhythmias occurred beyond 48 hours of monitoring. In conclusion, the diagnostic yield of continuous ECG patch monitoring in children was substantial beyond 48 hours and should be considered in children who are candidates for longer term ECG monitoring.
The utility of ambulatory electrocardiography has been reported using a variety of devices, including the short-term (24- to 48-hour) Holter monitor, the longer term event monitor (30 days), and mobile cardiac telemetry (30 days). Each monitoring modality has its limitations. The Holter monitor is not ideal for capturing infrequent arrhythmias because of the short wear time, and the multiple leads are cumbersome, leading to compliance limitations. Event monitors require cognitive capacity to press a trigger button, and patient compliance is often difficult in the pediatric population. Mobile cardiac outpatient telemetry devices continuously record and transmit data in real-time but have 3 leads and are bulky. The 14-day adhesive patch monitor (Zio Patch; iRhythm Technologies, San Francisco, California) is a novel single-lead, intermediate-duration, water-resistant adhesive patch monitoring device that could be especially useful in the pediatric population. The adhesive patch monitor detected more arrhythmias in the first 24 hours as well as the total wear time compared with the Holter monitor in adults. Interestingly, the costs of applying a Holter monitor and a patch monitor are comparable. However, the diagnostic yield of the patch monitor has never been reported in the pediatric population. We aimed to characterize diagnostic yield, arrhythmia type, and time to first arrhythmia using a clinical repository of national ambulatory electrocardiographic (ECG) patch data in children.
Methods
We performed a cross-sectional study of 3,209 consecutive children <18 year of age receiving their first adhesive patch monitors (off label) for clinical indications from January 2011 to December 2013. The Zio XT Patch monitor is a compact (123 × 53 × 10.7 mm), lightweight (34 g), water-resistant, cutaneous, single-lead ECG monitor that continuously records ECG data from a single vector for up to 14 days. The single-use device is positioned on the patient’s left pectoral region using skin adhesive at the ordering outpatient physician’s clinic. Patients were not offered the patch if there were known personal or family histories of allergic reactions to adhesives. The patient was able to press a trigger button on the center of the device whenever a symptom was felt. At the same time, the patient was instructed to record the symptoms, duration of symptoms, and activity at the time of the event in the provided diary. After 2 weeks, the device, the symptom diary, and a patient satisfaction survey were mailed back to the central repository at iRhythm headquarters in San Francisco, and the data were uploaded for analysis.
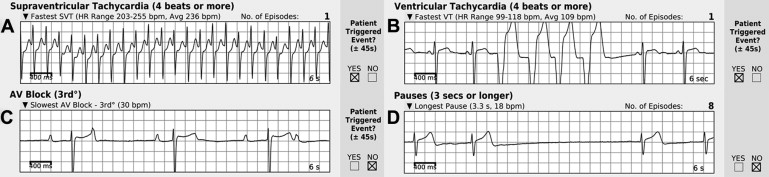
The ECG analysis was done using beat-by-beat QRS detection using the US Food and Drug Administration–cleared proprietary Zeus algorithm. Each patient’s report included arrhythmia findings; monitoring duration; percentage analyzable time on the basis of total time the device was worn; maximum, minimum, and average heart rates across the entire analyzable time; patient-triggered and diary events ±45 seconds of an episode; and trending graphs showing the time of day of the arrhythmias. Sustained supraventricular tachycardia (SVT) or ventricular tachycardia (VT) was considered to be ≥8 consecutive beats; <8 beats was defined as nonsustained SVT or VT. The ECG reports were reviewed and uploaded by a certified cardiographic technician trained in advanced arrhythmia detection. If there were discrepancies in interpretation of the rhythm by the technician and the Zeus algorithm, the report was verified by 1 of 2 board-certified practicing cardiologists. The report ( Figure 1 ) was subsequently uploaded on-line, and the ordering physician could make the final interpretation of the results. If the rhythm was determined to be wide QRS tachycardia >120 beats/min sustained for >30 seconds, complete heart block, symptomatic second-degree atrioventricular block, pause >6 seconds, symptomatic bradycardia <40 beats/min sustained for 60 seconds, or narrow QRS tachycardia >180 beats/min sustained for 60 seconds, this met physician notification criteria.
Approval for the study was obtained from the Children’s Hospital of Orange County Institutional Review Board. The deidentified data were extracted for analysis from the national clinical registry provided by the service provider (iRhythm Technologies). The patient name, ordering physician, and date and location of the service were removed before we received the data. The clinical indication for ECG monitoring, age, gender, geographic location, rhythm strip, and interpretation of the rhythm strip were provided to us. We independently reviewed all reports in which arrhythmias were detected. Descriptive statistics (mean, median, interquartile range, standard deviation [SD], and percentage) were analyzed using Microsoft Excel (Microsoft Corporation, Redmond, Washington).
Results
There were 3,209 children in this analysis cohort (56% female, mean age 12.5 ± 4.4 years, range 1 month to 17 years). Patients represented 38 states within the United States; the highest participating states included California (n = 863), New Hampshire (n = 463), and Michigan (n = 299). Mean monitoring duration was 7.8 ± 4.4 days. Patch wear-time compliance was high over the 14 days; 97.9% of patients wore the patch for ≥24 hours, 90.9% for ≥48 hours, 52.5% for ≥1 week, and 34.5% for 10 to 14 days ( Figure 2 ). Seventy-nine percent of patients (n = 2,546) pressed the trigger button, but only 3.9% (n = 125) had detected arrhythmias correlating to those symptoms. One hundred thirty-seven patients (4.3%) met physician notification criteria. Average analyzable time was 92.6%, with a minimum of 3.8% and a maximum of 100%. This left 7.4% artifact for each recording on average.
We independently verified the patch reports for all 390 patients with detected arrhythmias. Of these 390 patients, 10 patients (2.6%) had reported arrhythmia diagnoses that differed from our interpretations. Sinus tachycardia was misinterpreted as SVT in 3 of the 10 patients, VT was reported as SVT in 3 patients, SVT with aberrancy was reported as VT in 3 patients, and the last patient was reported to have atrial fibrillation, but in fact it was an artifact. We concurred with the interpretations of the remaining 380 positive patch reports (97.4%).
The top 5 indications for ECG monitoring included palpitations (n = 1,138 [35.5%]), syncope (n = 450 [14.0%]), unspecified tachycardia (n = 291 [9.1%]), paroxysmal SVT (n = 264 [8.2%]), and chest pain (n = 261 [8.1%]) ( Table 1 ). Arrhythmias were detected in 10.0% of patients who were referred for palpitations, 6.7% of patients referred for syncope, 14.8% of patients referred for tachycardia, 22.7% of patients referred for paroxysmal SVT, and 6.5% of patients referred for chest pain. The diagnostic yield of symptom-triggered arrhythmias was lower than the yield by continuous beat-by-beat recording for all indications for ECG monitoring ( Table 1 ).
| Top Five Indications for ECG Monitoring | Diagnostic Yield for any Arrhythmia | Diagnostic Yield for Symptom-Triggered Arrhythmia | Diagnostic Yield for Arrhythmias meeting MD Notification criteria | |
|---|---|---|---|---|
| Palpitations | n=1,138 (36%) | n=114 (10%) | n = 46 (4%) | n = 43 (4%) |
| Syncope | n=450 (14%) | n=30 (7%) | n = 6 (1%) | n = 5 (1%) |
| Tachycardia | n=291 (9%) | n=43 (15%) | n = 8 (3%) | n = 15 (5%) |
| SVT | n=264 (8%) | n=60 (23%) | n = 24 (9%) | n = 24 (9%) |
| Chest Pain | n=261 (8%) | n=17 (7%) | n = 5 (2%) | n = 4 (2%) |
The distribution of the time to first arrhythmia and first symptom-triggered arrhythmia is listed in Table 2 . Among the patients with arrhythmias, 44.1% had their first arrhythmias occur >48 hours from the start of monitoring. Among the patients with symptom-triggered arrhythmias, 50.4% occurred >48 hours from the start of monitoring. The diagnostic yield of SVT, VT, second- or third-degree atrioventricular block, pause, and atrial fibrillation all improved with extended monitoring up to 14 days ( Table 2 ). Although the incidence of arrhythmias increased with age, the diagnostic yield of the patch was consistent across age groups ( Table 3 ).
| Variable | All Patients | All Patients With Arrhythmias | Time to First Arrhythmia | Time to First Symptom-Triggered Arrhythmia | ||||
|---|---|---|---|---|---|---|---|---|
| Mean ± SD (days) | Median (IQR) | Occurring After 48 hrs | Mean ± SD (days) | Median (IQR) | Occurring After 48 hrs | |||
| Any Arrhythmia | 12.1% | 100.0% | 2.7 ± 3.0 | 1.4 (0.3 – 4.1) | 44.1% | 3.3 ± 3.3 | 2.0 (0.8 – 5.2) | 50.4% |
| SVT (> 4 beats) | 7.1% | 58.2% | 2.7 ± 3.0 | 1.7 (0.2 – 4.0) | 27.3% | 3.5 ± 3.4 | 2.2 (1.0 – 5.3) | 52.8% |
| VT (> 4 beats) | 3.8% | 31.3% | 3.4 ± 3.4 | 1.7 (0.7 – 5.6) | 14.9% | 3.4 ± 2.8 | 2.5 (1.0 – 4.6) | 59.1% |
| 2° or 3° AV Block | 1.2% | 9.5% | 1.6 ± 1.9 | 0.7 (0.0 – 2.7) | 3.1% | 2.0 ± 3.8 | 0.2 (0.1 – 0.8) | 18.2% |
| Pause | 0.9% | 7.4% | 1.8 ± 1.6 | 1.2 (0.7 – 2.9) | 2.3% | 0.4 ± 0.0 | 0.4 (0.4 – 0.4) | 0.0% |
| Atrial Fibrillation | 0.3% | 2.8% | 1.7 ± 2.7 | 0.5 (0.0 – 1.9) | 0.8% | 3.0 ± 1.6 | 2.5 (1.5 – 4.0) | 57.1% |
Stay updated, free articles. Join our Telegram channel

Full access? Get Clinical Tree


