CHAPTER 107 Diagnostic Imaging
Echocardiography and Magnetic Resonance Imaging
Before the advent of cardiopulmonary bypass in the mid 1950s, little attention was given to the diagnosis of congenital heart disease (CHD), because no effective treatment was available. Physical examination, auscultation, electrocardiography, and radiography were the main diagnostic tools. Progress in open-heart techniques for repair of CHD required accurate and comprehensive delineation of cardiovascular anatomy and function. During the 1960s and 1970s, cardiac catheterization and angiography were the principal tools used for diagnosis of CHD. Echocardiography entered the arena in the late 1970s. The diagnostic capability of M-mode echocardiography proved insufficient for patients with CHD, but the rapid evolution of two-dimensional (2D) echocardiography during the following decade transformed the field. The technological advances in transducer design, and in image processing and display, together with development and refinement of new imaging planes and examination techniques, allowed high-quality tomographic visualization of most cardiac defects.1 The application of Doppler ultrasound to investigate blood flow allowed comprehensive hemodynamic assessment. By the mid 1980s, much of the necessary anatomic and hemodynamic information required for patient management could be obtained noninvasively, obviating the need for a diagnostic catheterization in many patients. During the late 1990s and into the 2000s, the field of pediatric cardiac imaging experienced accelerated progress in areas such as three-dimensional (3D) echocardiography, sophisticated techniques for assessment of myocardial function, and the application of magnetic resonance imaging (MRI) to CHD. At the same time, the proportion of cardiac catheterization procedures performed solely for diagnostic purposes has drastically declined. More recently, the role of cardiac imaging for pre-intervention planning and for guidance of cardiovascular procedures has expanded dramatically.
ECHOCARDIOGRAPHY AND DOPPLER ULTRASOUND
Echocardiography is an ideal diagnostic tool in pediatric cardiology because of its noninvasive nature, relatively low cost, superb spatial and temporal resolutions, and ability to image cardiovascular anatomy, thus allowing evaluation of physiology in real time. In addition, modern cardiac ultrasound equipment is portable and adaptable to different environments, such as the operating room, the intensive care unit, the bedside, and the outpatient office. In today’s pediatric cardiology practice, echocardiography is the primary diagnostic modality used to evaluate anatomy and physiology preoperatively, intraoperatively, postoperatively, during follow-up of CHD, and prenatally.1–3
Technique
To obtain an echocardiographic image, a burst of ultrasound energy is generated by a piezoelectric crystal and travels through the soft tissue at an average speed of approximately 1540 m/sec. When the propagating ultrasound wave encounters an interface between tissues with different acoustic properties, some of the energy is reflected back toward the transducer and some of the energy is refracted and continues to travel in the medium until it encounters the next interface. The returning ultrasound energy is then converted into an electrical energy that goes through a series of electronic processes, including amplification, filtering, post-processing, and display.
M-Mode Echocardiography
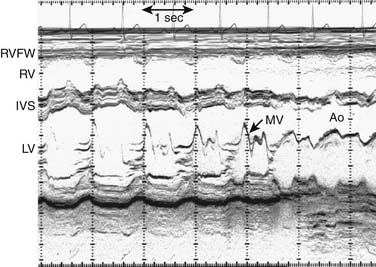
A narrow beam of ultrasound energy is emitted toward the heart, and structures along the beam path reflect echoes back toward the transducer. A dot is displayed on the screen in a position corresponding to its distance from the transducer. This process is repeated rapidly to create an image. The distance from the transducer is displayed on the y-axis, and time is displayed on the x-axis (Fig. 107-1). This provides an anatomically one-dimensional image of the heart that is characterized by excellent temporal and axial resolutions. M-mode echocardiography is no longer used for anatomic imaging of the heart in clinical pediatrics.3 In selected circumstances, when superior temporal resolution is required, 2D directed M-mode may be used to assess motion of specific structures such as native and prosthetic valve leaflets.
Two-Dimensional Echocardiography
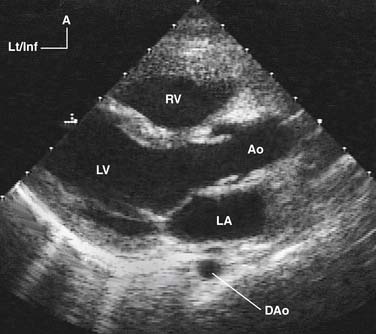
By rapidly sweeping an ultrasound beam through an arc, multiple M-mode lines are placed next to one another to construct a cross-sectional 2D image of the heart (Fig. 107-2). This can be accomplished by electronically sweeping the sound beam through multiple piezoelectric crystals (transducer elements), as in phased-array transducers. Recent advances in transducer technology and image processing permit very high frame rates (>200 Hz), a feature that greatly enhances temporal resolution.4
Three-Dimensional Echocardiography
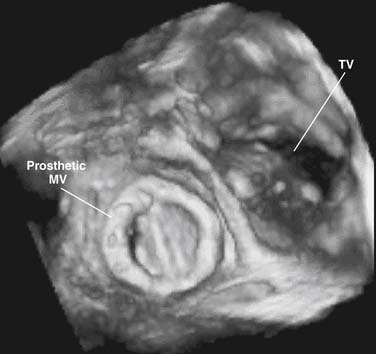
Accurate spatial perception of an object depends on recognition of its three dimensions: length, width, and depth. Although an experienced examiner can mentally construct a 3D image of the heart from serial 2D tomographic images obtained by sweeping the transducer across the chest, 3D echocardiography offers an enhanced perspective of cardiovascular structures and their interrelations. Previously, the approach for obtaining 3D echocardiographic images of the heart was based on computer reconstruction of contiguous 2D cross-sectional images. These efforts were hampered by difficulties in accurately registering the ultrasound image data in time and space and by long processing times. Nowadays, computer reconstruction of 2D images to produce 3D images has largely been replaced by real-time 3D echocardiography. This technology, which is based on a new generation of matrix-array transducers with several thousands of simultaneously transmitting and receiving piezoelectric elements and sophisticated parallel data processing, provides real-time 3D images with sufficient temporal resolution to display in cine-loop format (Fig. 107-3).5–7 More recently, miniaturization of matrix-array transducer technology has allowed development of a real-time 3D transesophageal echocardiographic probe.8 Further refinements of this technology will result in continued improvement of spatial and temporal resolutions as well as better, more intuitive, user interface. Such advances are likely to contribute to the ongoing acceptance of this technology in routine practice.
Doppler Echocardiography
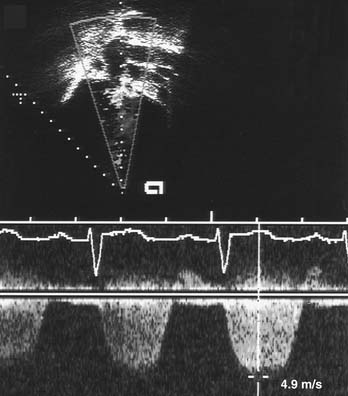
The use of Doppler ultrasound to assess normal and abnormal hemodynamics has become an integral part of the echocardiographic examination.1–3 The advent of 2D-directed Doppler interrogation has greatly enhanced the clinical application of this technique by allowing evaluation of flow characteristics in specific regions in the heart and great vessels. In today’s echocardiography, spectral and color-coded Doppler flow mapping are used extensively to measure velocity and direction of blood flow (Fig. 107-4). Calculations based on Doppler-derived measurements allow quantitative estimation of flow volume (such as cardiac output), pressure gradient across a stenotic region, cross-sectional flow area, and prediction of intracardiac pressures. Doppler echocardiography also provides qualitative and semiquantitative assessment of valve regurgitation, intracardiac and extracardiac shunts, and myocardial motion (tissue Doppler imaging). Detailed discussion of Doppler physics is beyond the scope of this text and can be found elsewhere.1,2,9,10
Contrast Echocardiography
As early as the late 1960s, Gramiak and colleagues11 noted that intravascular injection of almost any solution resulted in a contrast effect detectable by echocardiography. Initially, this technique was used to identify structures seen by M-mode echocardiography. Contrast echocardiography has been used to detect systemic12 and pulmonary venous anomalies,13 and for the detection of intracardiac and great artery level shunts.14 In today’s pediatric echocardiography, contrast studies are infrequently performed and are usually limited to detection of intracardiac shunts in patients with limited echocardiographic windows, patch or baffle leak after cardiac surgery, and pulmonary arteriovenous malformations.2,3
Objectives of the Echocardiographic Examination
The objectives of the echocardiographic examination must be tailored to the individual patient. The initial evaluation should include a comprehensive survey of all anatomic elements of the central cardiovascular system.15 Subsequent examinations are often targeted to answer specific clinical questions. It is important, however, to repeat complete echocardiograms during follow-up, even in patients who underwent a comprehensive initial examination, because of the dynamic nature of CHD. Examples include the late onset of discrete subaortic stenosis in patients with ventricular septal defect or coarctation of the aorta,16 double-chambered right ventricle,17 and supramitral stenosing ring.18
Examination Technique
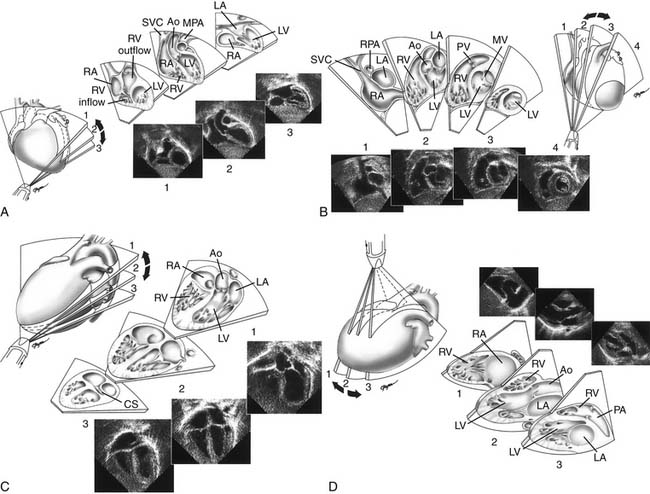
Proper planning of the echocardiographic examination ensures that all diagnostic information is obtained most efficiently. This is particularly relevant in sedated patients, for whom the time available for data acquisition is limited. Ideally, a complete segmental examination of cardiovascular anatomy and function is performed in every new patient. This includes determination of visceral situs, heart position, atrial situs, systemic and pulmonary venous connections, ventricular situs, atrioventricular and ventriculoarterial alignments and connections, and coronary and great arterial anatomy. Assessment of ventricular function, intracardiac and vessel dimensions, and flow analyses across all valves, septa, chambers, and vessels are integral parts of the examination. In young children with suspected heart disease, the examination begins from the subxiphoid approach by determining the abdominal situs and then proceeding by scanning the heart and great vessels, employing a step-by-step segmental analysis (Fig. 107-5A,B).15,19,20 This approach is advantageous because it provides a wide-angle view of heart position and cardiovascular anatomy and function at an early stage in the examination. Subsequent 2D and Doppler analyses from the apical, parasternal, and suprasternal notch views supplement and confirm findings from the subxiphoid window (see Fig. 107-5C-G). The examination strategy should be tailored to the individual patient and modified according to the clinical situation as necessary. Although the standard views just described should be obtained in almost every patient, and represent the minimum acceptable examination, flexibility and improvisation are important to optimally use the full potential of echocardiography.
Anatomic Analysis
When performing and reviewing an echocardiographic examination for a patient suspected of having CHD, a stepwise segmental approach to analysis of cardiac anatomy is taken: each component of the heart is analyzed separately according to its unique morphologic features.19,20 The heart is composed of five segments—three main segments (the atria, the ventricles, and the great arteries) and two connecting segments. The atrioventricular canal, which includes the mitral and tricuspid valves and the atrioventricular septum, connects the atria with the ventricles. The infundibulum (or conus) connects the ventricles with the great arteries. In the analysis of cardiac anatomy, each cardiac chamber must be identified individually according to its unique anatomic-morphologic features and not according to its spatial (right-sided or left-sided) position, valve of entry, or artery of exit. Throughout a systematic echocardiographic study, the examiner must go over a mental checklist of segments, their anatomic organization and position (situs), their connections and alignments with adjacent segments, and associated malformations. Using the aforementioned principles, any potential CHD can be accurately described in specific and precise terms. A detailed review of echocardiographic analysis of each cardiac segment can be found elsewhere.1,2,15,19
Special Echocardiographic Procedures
Transesophageal Echocardiography
Transesophageal echocardiography (TEE) was introduced in 1976 and appeared in pediatric use in 1989. The miniaturization of probes and development of multiplanar imaging have greatly increased its role as an adjunct to transthoracic imaging, during surgical repair of CHD (intraoperative TEE), and to guide interventional catheterization procedures. Advances in transducer technology and image processing now allow real-time 3D TEE.8
Indications and Objectives
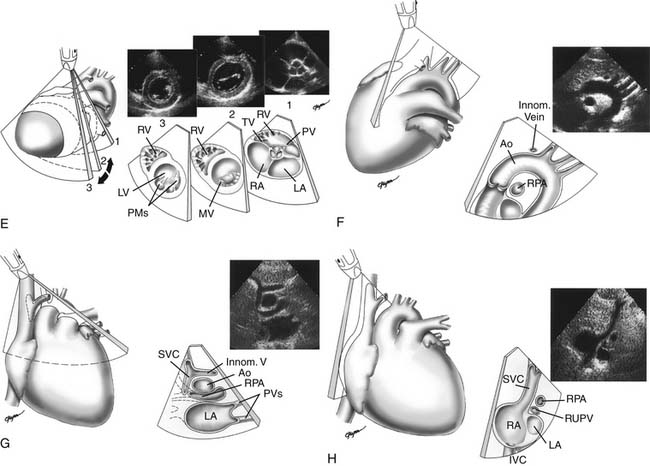
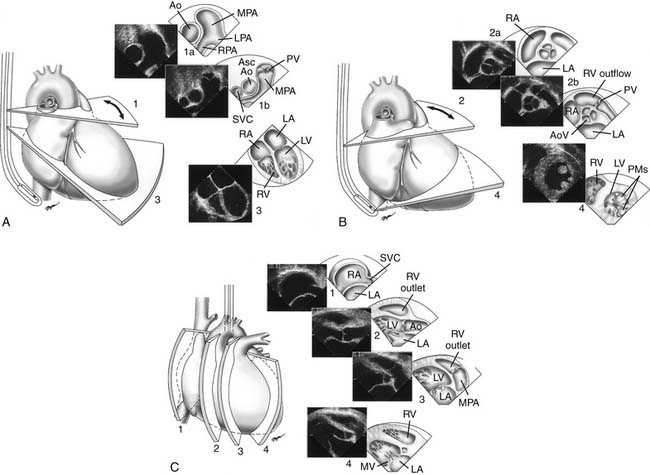
A TEE examination is usually performed to answer a limited set of clinical questions. It is advisable, however, to perform a comprehensive examination of the heart and blood vessels for additional unsuspected anatomic or hemodynamic anomalies (Fig. 107-6).21 Miniaturization of TEE probes designed for use in young infants weighing 3 to 3.5 kg or less has greatly enhanced the scope of TEE in the pediatric age group.22–25 Successful TEE examinations have been reported in patients weighing as little as 2.3 kg.26,27 The role of TEE in pediatric cardiology is continuously evolving. Although the transthoracic window is adequate in most situations, TEE provides distinct advantages during cardiovascular surgery,22,24,27–29 during video-assisted thoracoscopic procedures,30 for guidance of interventional catheter procedures,31,32 in the intensive care unit,22,33 for detection of intracardiac thrombi and vegetations,34 for assessment of prosthetic valves,35 in selected patients on mechanical assist device and extracorporeal membrane oxygenator,36 and in selected patients with poor transthoracic windows, such as adults with CHD.37 Whether to use intraoperative TEE selectively or routinely in patients with CHD deserves further study.21,38
Safety and Complications
Although in expert hands TEE is quite safe, complications have been reported, including oropharyngeal trauma, and compression of airways and vascular structures.39,40 TEE is contraindicated in patients with an unrepaired tracheoesophageal fistula, esophageal obstruction or stricture, perforated viscus, or active gastrointestinal bleeding; in an unwilling or uncooperative patient who is inadequately sedated; or with an uncontrolled airway in a patient with respiratory or cardiac decompensation. Relative contraindications include cervical spine injury, immobility, or deformity; history of esophageal surgery; known esophageal varices or diverticulum; oropharyngeal deformities; and severe coagulopathy.21,41,42
Fetal Echocardiography
Examination of the human fetal cardiovascular system dates back to the late 1960s when continuous wave Doppler was used to record fetal heart rate. Although Kleinman and colleagues43 in the late 1970s had some success in detecting CHD in the fetus by M-mode echocardiography, it was not until high-resolution 2D imaging became available in the mid 1980s that accurate delineation of cardiovascular anatomy became clinically routine. Today, prenatal detection of CHD can be reliably diagnosed by 17 to 20 weeks of gestation by transabdominal imaging. Using the transvaginal window, the heart and great vessels can be imaged as early as late first trimester.44
Indications and Objectives
Although several studies have demonstrated a low detection rate of CHD by routine level I obstetric ultrasound,45 cost–benefit considerations preclude universal fetal echocardiographic screening by expert pediatric echocardiographers. Therefore, pregnancies at high risk for CHD are targeted. This approach increases the echocardiographic yield to approximately 30% when extracardiac anomalies had been detected, to approximately 60% when a level I scan had detected possible CHD, and to nearly 100% when a second opinion had been requested.46,47 The indications for fetal echocardiography are summarized in Box 107-1.
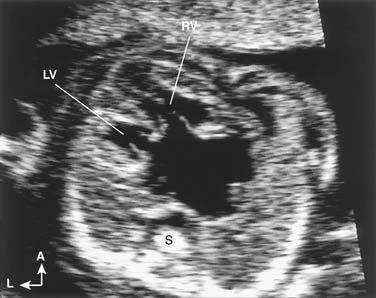
Description of Technique
Echocardiographic examination of the cardiovascular system in the fetus is based on the same segmental approach to diagnosis of CHD that is used in the newborn. The main difference between examination of the fetus and the newborn is that the operator has no control over fetal position and, consequently, over the views obtained. Once fetal position is ascertained and the spatial coordinates are determined, the examination continues according to the principles outlined in the previous sections. Given optimal acoustic windows and favorable fetal position, even the most complex cardiovascular anomalies can be detected (Fig. 107-7).48 Defects that remain difficult to diagnose in utero include secundum atrial septal defect, patent ductus arteriosus, small or moderate ventricular septal defect, coarctation of the aorta, and some valve and great vessel abnormalities.49 The distinction between normal patency of the foramen ovale and an atrial septal defect is usually not possible in the fetus. Similarly, it is not possible to predict whether the normally patent ductus arteriosus will close after birth. In utero diagnosis of aortic coarctation may be difficult because the typical isthmic narrowing may not become apparent until after ductal closure.49 However, the diagnosis may be suspected on the basis of abnormal morphology of the transverse aortic arch (elongation and hypoplasia), size discrepancy between the diameters of the aortic isthmus and patent ductus arteriosus, continuous flow profile in the aortic isthmus, and size discrepancy between the ventricles (right ventricle larger than left ventricle).50,51
Clinical Implications
Early prenatal diagnosis of major CHD allows parents to consider the option to terminate the pregnancy. It is also common to recommend amniocentesis to detect associated genetic abnormalities. When pregnancy continues, prenatal diagnosis of CHD allows proper planning for postnatal cardiac care. When intervention is anticipated immediately or shortly after birth (e.g., for ductal-dependent anomalies or balloon atrial septostomy in transposition of the great arteries), delivery in a pediatric cardiac center is arranged. The currently available literature is conflicted on whether prenatal diagnosis of CHD leads to a significant reduction in mortality.52,53 However, there is evidence it can reduce morbidity in certain cases.52 Other advantages, such as psychological benefits to the parents, are also valuable.54
Fetal Arrhythmia
One of the major reasons for referral to fetal echocardiography is arrhythmia. Most commonly, irregular fetal heart rate is caused by either conducted or blocked premature atrial contractions. These are usually benign and require follow-up only if they are frequent or associated with supraventricular tachycardia. Among the serious arrhythmias encountered in the fetus, supraventricular tachycardia and atrial flutter are the most common.46 Premature ventricular contractions and ventricular tachycardia are rare in the fetus, but both have been reported.46 Transplacental pharmacologic therapy is indicated in fetuses with incessant tachyarrhythmia, especially if signs of heart failure (e.g., enlargement of cardiac chambers, pericardial effusion, hydrops fetalis) are present. Complete heart block is the most common cause of prolonged bradycardia in the fetus.55 The distinction between complete heart block and sinus bradycardia is important, as the latter might indicate fetal distress. In fetuses with a structurally normal heart, maternal lupus erythematosus should be suspected. The most common structural CHDs associated with complete heart block are physiologically corrected transposition of the great arteries {S,L,L} and heterotaxy syndrome with polysplenia.
Fetal arrhythmias have been traditionally diagnosed by Doppler and M-mode echocardiography.46 Both methods rely on simultaneous recording of signals from the atria and ventricles. Fetal position, however, may not always allow optimal alignment of the M-mode cursor or the Doppler beam. A newer method, tissue Doppler imaging with a high frame rate, is a promising alternative to standard M-mode and Doppler echocardiography.56
Quantitative Analysis
Modern echocardiography allows accurate measurements of cardiovascular structures.1–357 These measurements are helpful in deciding whether the size of a certain structure is within normal limits, and to quantify the degree of deviation from the expected norm.
Description of Technique
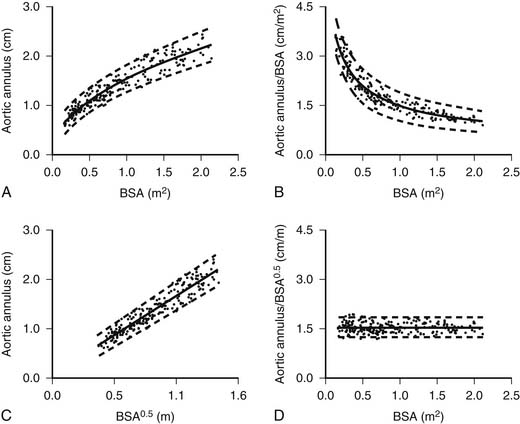
Measurements of linear dimensions (such as vessel diameter), cross-sectional areas (such as valve area), or volumetric dimensions (such as ventricular volume or mass) provide important quantitative information that can be used to assess the severity of the disease process and to predict its course and prognosis. Because the pediatric age group encompasses a wide range of body sizes and because the heart and great vessels grow considerably from birth to adulthood, measured dimensions must be adjusted to allow meaningful comparisons between patients of different ages and body sizes.58 For example, the mean value of the aortic valve anulus diameter is 0.74 cm in a 3.6-kg newborn (body surface area, 0.24 m2) and 1.95 cm in a 60-kg adolescent (body surface area, 1.66 m2). Indexing the aortic anulus diameter to body weight yields vastly different values (0.21 cm/kg in the newborn versus 0.032 cm/kg in the adolescent). Indexing the aortic valve diameter to the body surface area yields similarly unsatisfactory results (3.1 cm/m2 in the newborn versus 1.17 cm/m2 in the adolescent). Tanner and coworkers59 in 1949 and, more recently, Gutgesell and Rembold60 and Sluysmans and Colan58 noted that the growth of cardiac structures is not necessarily a linear function of the body surface area, the weight, the height, or the age. These findings are to be expected because the heart and great vessels grow much faster during the first 2 to 4 years of life compared with later childhood and adolescence. It was found that linear dimensions (such as diameters of valves and great vessels) should be indexed to the square root of the body surface area.58–60 Returning to the preceding example of the aortic valve diameter, indexing the valve diameter to the square root of the body surface area yields 0.74/0.49 = 1.51 cm/m0.5 in the 3.6-kg newborn and 1.95/1.29 = 1.51 cm/m0.5 in the 60-kg adolescent (Fig. 107-8). Cross-sectional measurements (such as valve area) should be indexed to the body surface area.60 Left ventricular volume should be indexed to the body surface area raised to the power 1.28, and left ventricular mass should be indexed to the body surface area raised to the power 1.23.58
An alternative approach to comparing measurements between individuals is the use of z scores.1 The z score is a statistical expression of the position of a data point relative to the regression line of a data set. The z score is expressed as the number of standard deviations from the expected mean of a normal population. It is calculated as follows:
An estimation of left ventricular volume is an important factor in determining the adequacy of chamber size in patients with left ventricular hypoplasia and in the evaluation of patients with volume overload. Numerous algorithms based on several geometric models have been developed for calculation of left ventricular volume, and they have been reviewed elsewhere.1,2 The biplane Simpson rule is considered among the most reliable methods for estimation of left ventricular volume. This method requires imaging of the left ventricle from two orthogonal views that share a common long axis: for example, the apical four- and two-chamber views (Fig. 107-9A). Left ventricular volume is calculated according to the following equation:
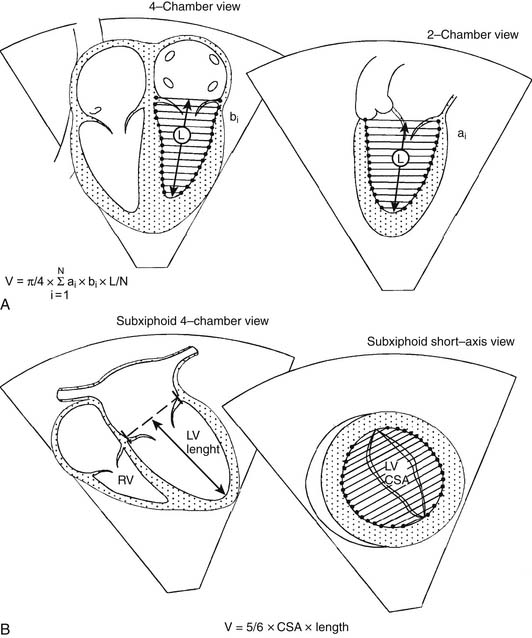
Another method for estimation of left ventricular volume is the biplane area-length method, where V = 5/6 × area × length (Fig. 107-9B). Experience with assessment of left and right ventricular volumes by 3D echocardiography suggests that this technique is potentially more accurate than 2D techniques.7,61–65 Left ventricular myocardial volume can be measured from the 2D echocardiogram by subtracting the endocardial volume from the epicardial volume. Left ventricular mass is calculated by multiplying the resultant myocardial volume by the density of muscle (1.055 g/mL). Because it is not influenced by acoustic windows and is independent of chamber geometry, MRI provides an excellent alternative to echocardiography for measuring chamber volume and mass and is considered the reference standard to which other techniques are compared (see “Magnetic Resonance Imaging,” later).
Ventricular Function
Left ventricular function can be assessed at several levels. The heart may be viewed as a pump designed to maintain adequate flow to vital organs.66 This approach focuses on the external work performed by the heart, but it ignores the internal work and the functional state of the myocardium. Measuring cardiac output and systemic and pulmonary venous blood pressures can assess the pump function of the heart. It is known, however, that cardiac output and blood pressure can remain within the normal limits despite significant myocardial dysfunction.66
Ejection-phase indices of ventricular function, including shortening fraction, fractional area change, ejection fraction, velocity of circumferential fiber shortening (VCF), peak dP/dt, and systolic time intervals, measure global pump function.1–366 Common to these indices is their dependence on loading conditions. These indices are unable to distinguish between the effects of altered loading conditions and abnormalities in myocardial contractility. Hence, abnormalities in preload and afterload can result in depressed shortening or ejection fractions, leading to the erroneous interpretation that myocardial contractility is depressed. On the other hand, left ventricular myocardial contractility may be depressed even in the presence of normal shortening or ejection fractions. The advantage of most of these indices is their relative simplicity and ease of acquisition. Load-independent assessment of left ventricular systolic function requires a more sophisticated analysis. The interested reader is referred to the relevant chapters in this book and to other reviews of this topic.66
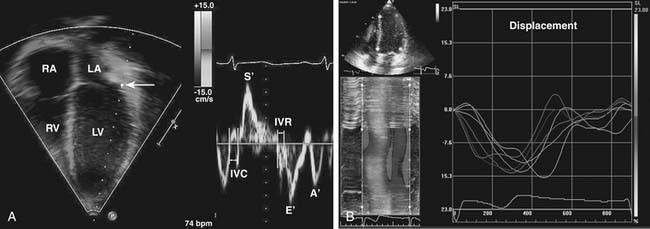
These methods of ventricular function assessment rely in part on measurements of ventricular dimensions. An alternative approach is to evaluate myocardial motion and deformation.67 Several methods have been developed to measure myocardial velocities, strain, strain rate, displacement, and torsion (twist). One method uses Doppler to measure myocardial velocities (Doppler tissue imaging) and to calculate strain, strain rate, and other variables of tissue deformation (Fig. 107-10A).68–70 Another method, called speckle tracking, analyzes the frame-to-frame changes in ultrasonic signal characteristics and uses that information to track the myocardium throughout the cardiac cycle (Fig. 107-10B).71 These methods are independent of ventricular geometry and provide information on systolic and diastolic function.72–74 The reproducibility and the prognostic role of these techniques in patients with CHD are the subject of ongoing investigations.
< div class='tao-gold-member'>
Stay updated, free articles. Join our Telegram channel

Full access? Get Clinical Tree


