CHAPTER 55 Diagnostic Echocardiography (Ultrasound Imaging in Cardiovascular Diagnosis)
Echocardiography has broad utility in the diagnosis and management of cardiovascular disease. Advances in image quality and Doppler quantitation allow real-time, precise anatomic definition and physiologic interrogation of cardiac and vascular structures with minimal risk and discomfort for the patient. Common clinical applications of echocardiography include assessment of myocardial and valvular function, identification of structural abnormalities, and optimization of timing for surgical intervention.1–4 Echocardiography use has expanded beyond the diagnostic laboratory to include the intensive care unit, emergency department, operating room, and electrophysiology and cardiac catheterization laboratories. This chapter reviews the basic principles of ultrasound imaging and Doppler quantitation. A discussion of the application of echocardiography for a range of cardiovascular diseases is then presented.5
BASIC PRINCIPLES
Echocardiographic images are generated from analyses of reflected ultrasound waves. Ultrasound waves are high in frequency, above 20 kHz, beyond the audible sound wave range. A transducer produces ultrasound waves that reflect off tissue boundaries and are received back by the transducer. Reflected waves take longer to return from structures farther from the transducer than from nearby structures. Complex analysis of the intensity and timing of the reflected ultrasound waves provides image generation. Factors that affect image generation include ultrasound beam refraction through different physical media, absorption of ultrasound energy by intervening tissue (attenuation), and disarrayed beam reflection, termed scatter.1,2 Image artifacts may be generated if reflected ultrasound waves “re-reflect” on internal structures, delaying the time for some of the reflected ultrasound waves to return to the transducer. Proper interpretation of echocardiographic images should account for potential ultrasound artifacts. Propagation of ultrasound waves is optimal through liquid medium, such as blood. Air and bone cause significant acoustic impedance, with resulting poor ultrasound penetration. Therefore, intrathoracic air, intervening ribs, and surface bandages between the transducer and the heart result in suboptimal image generation. Transducers of different size, type, and frequency are available to optimize image quality.
ULTRASOUND IMAGING MODALITIES
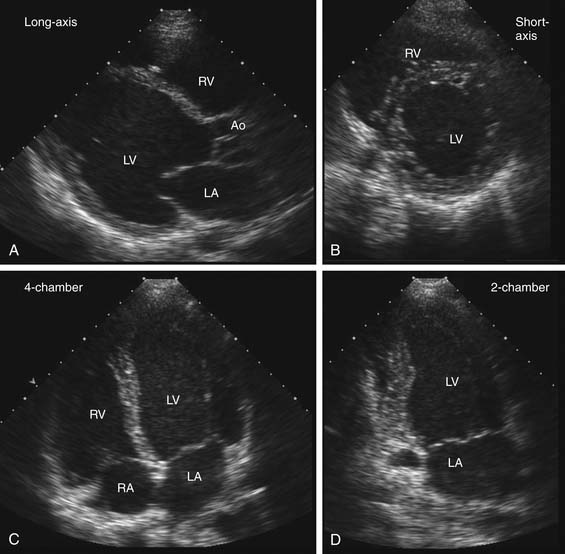
Echocardiographic examinations include use of several ultrasound modalities. The basic imaging format is real-time two-dimensional imaging that sweeps an ultrasound beam across an imaging tomographic plane to provide images at a frame rate of about 30 frames per second. For transthoracic echocardiography (TTE), the transducer is placed on the body surface, and images are taken after standard image planes are optimized (Fig. 55-1).6 Technological advances now allow decreased size of ultrasound systems with increased portability. Although most diagnostic echocardiography still requires full ultrasound systems, smaller, hand-held devices are increasingly available for preliminary diagnostic testing in intensive care units, emergency departments, and similar clinical settings.
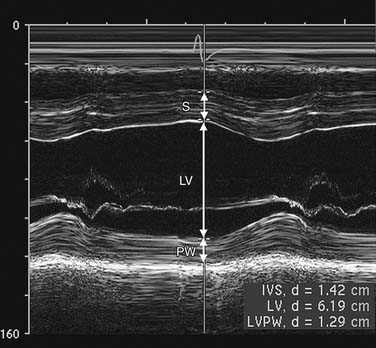
M-mode (motion) is produced by display of signals from a single ultrasound beam against the time dimension (Fig. 55-2). Temporal resolution is improved because time for the imaging sweep is not necessary for M-mode image generation. M-mode is useful for finite measurement of cardiac dimensions and timing of events, such as valve opening and closing.
Transesophageal echocardiography (TEE) is a semi-invasive procedure in which the transducer is mounted on a flexible endoscope and positioned in the esophagus and stomach. Manipulation of the TEE probe is constrained by esophageal anatomy, and oblique TEE image planes may hinder acquisition of correct cardiac dimensions. However, image resolution for TEE is significantly improved over TTE because of the lack of intervening air or bone. Placement of the TEE transducer in the esophagus permits better visualization of posterior cardiac structures, such as the mitral valve, left atrium, left atrial appendage, interatrial septum, and thoracic aorta. TEE is more accurate than TTE imaging for identification of valvular vegetations, complications of endocarditis, and aortic disease and for evaluation of mitral valve abnormalities. TEE is used to identify left atrial thrombus as a potential cardiac source of distal embolic disease and to exclude thrombus before direct current cardioversion for atrial fibrillation.7 In the intensive care unit, TEE has been used in determining the cause of unexplained hypotension8 and is helpful in evaluating patients at increased risk for ischemia, hypovolemia, and pericardial tamponade after cardiac surgery.9 However, TEE usually requires conscious sedation to reduce the patient’s discomfort, with additional monitoring and nursing support.
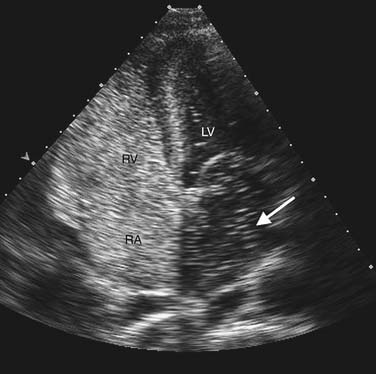
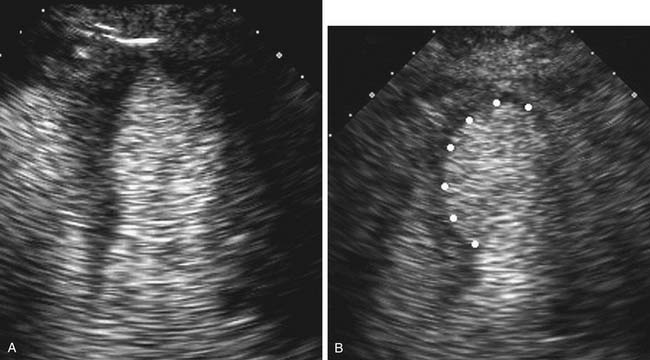
Contrast echocardiography is performed in conjunction with standard two-dimensional imaging to opacify intracardiac chambers. Contrast agents include intravenous agitated saline, used to opacify the right-sided heart chambers for detection of intracardiac shunts (Fig. 55-3), and commercially made microbubble agents that traverse the pulmonary bed to provide left-sided heart opacification. When image quality is suboptimal, opacification of the left-sided cardiac chambers enhances endocardial border definition to aid in wall motion analysis (Fig. 55-4).10 Although transpulmonary contrast agents have the potential to provide information on myocardial perfusion, this methodology is still in development.11,12
Epicardial intraoperative echocardiography is performed by placing the transducer directly on the heart during cardiac surgery. This modality is used when anterior structures are suboptimally seen through a transesophageal approach. Intravascular ultrasound imaging is performed through a percutaneously placed intravascular catheter. The most common use of this technique is intracoronary transducer placement to assist in plaque characterization and assessment of stenosis severity. Intracardiac transducers are also placed percutaneously and are used in the catheterization and electrophysiology laboratories for peri-procedural aid in catheter placement. Three-dimensional (3D) echocardiography improves spatial resolution, but increased time requirements for 3D image acquisition and processing decrease utility of 3D imaging for routine imaging.13 The greatest utility for 3D echocardiography is in imaging of the interatrial septum and mitral valve for guidance on anatomy and amenability for reparative intervention.
DOPPLER ECHOCARDIOGRAPHY
Doppler echocardiography uses the principle that reflected sound from a moving object returns with a different frequency than transmitted frequencies. This frequency “shift” allows evaluation of flow direction and velocity (higher velocities create larger Doppler shifts).1,2 With pulsed wave Doppler, the transducer alternates between sending and receiving signals, sampling blood velocities at a specified depth along the ultrasound beam. There is a limited measurable maximum velocity with pulsed wave Doppler, the Nyquist limit, beyond which the signal aliases and peak velocity cannot be accurately measured. With continuous wave Doppler, the transducer continuously transmits and receives signals along the entire length of the ultrasound beam. Although the specific depth origin of the continuous wave Doppler velocity cannot be localized, signal aliasing does not occur, and higher blood velocities, such as in stenotic valves, can be measured.
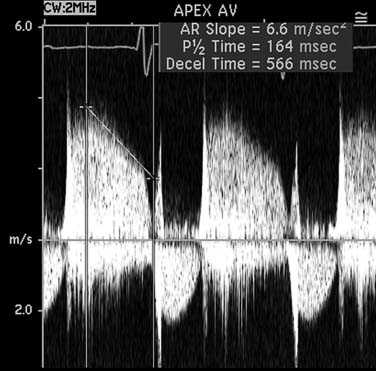
Pulsed wave and continuous wave Doppler velocity data are displayed as a graph of velocity versus time, with signal strength displayed by a decibel gray scale. By convention, frequency shifts toward the transducer are shown above the baseline. The velocity-time integral is the integral of blood flow velocity over time, measured in distance. The shape, timing, and density of spectral Doppler images provide valuable qualitative evaluation of blood flow, and increased jet density suggests increased flow volume. Rapid equalization of pressure gradients between two cardiac chambers leads to steeper jet slopes (Fig. 55-5). Color flow Doppler is a form of pulsed wave Doppler whereby velocities are sampled along multiple scan lines in a sector, color coded, and then superimposed on a two-dimensional image. By convention, flow away from the transducer is blue, and flow toward the transducer is red.
Cross-sectional area, assuming a circular orifice, is calculated by measuring the diameter at the point of interest (area = πr2). The velocity-time integral is obtained from spectral Doppler interrogation. The principle of continuity of flow describes the concept that the stroke volume passing just proximal to an orifice (SVpre) is the same as the stroke volume passing through the orifice (SVorifice). The most common application of the continuity equation is in aortic valve area measurement for stenosis, in which the stroke volume (SVpre) is measured at the left ventricular outflow tract.

Estimation of transvalvular pressure gradients is a common application of the simplified Bernoulli equation (Fig. 55-6). Another common application is estimation of pulmonary arterial pressures. The pressure gradient between the right ventricle and right atrium is calculated with the systolic velocity from the tricuspid regurgitant jet (Fig. 55-7). In the absence of pulmonary stenosis, pulmonary arterial systolic pressure is equal to the sum of right ventricular systolic pressure and right atrial pressure. Right atrial pressure is obtained by examining inferior vena cava diameter at rest and with inspiration, measured at 2 cm from the junction to the right atrium (Fig. 55-8 and Table 55-1). Measurement of pulmonary arterial systolic pressure is widely applicable as 90% of individuals have some degree of tricuspid regurgitation. Another application of the pressure-velocity relationship is calculation of the change in intraventricular pressure over time (a measure of systolic function).
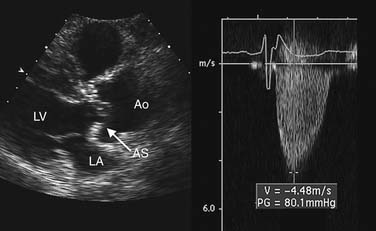
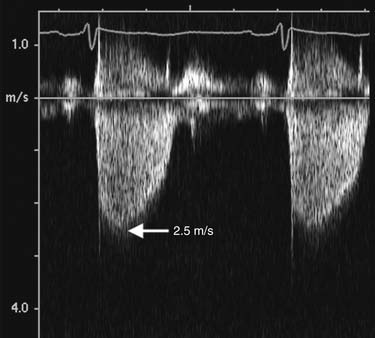
Figure 55–7 The peak pressure gradient is calculated with the peak velocity from the continuous Doppler tracings of the tricuspid regurgitant jet by use of the simplified Bernoulli equation. Peak velocity is 2.5 m/sec, which corresponds to a peak pressure gradient (right ventricular systolic pressure) of 25 mm Hg. The pulmonary arterial systolic pressure is obtained by adding the estimated right atrial pressure (see Fig. 55-1) to the peak gradient.
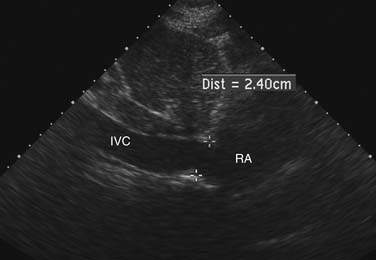
Figure 55–8 Inferior vena cava (IVC) diameter at rest in a patient with mildly increased right atrial pressures.
Table 55–1 Right Atrial Pressure Estimation
| Inferior Vena Cava Diameter | Change in Diameter with Inspiration | Right Atrial Pressure Estimation |
|---|---|---|
| Less than 1.5 cm | Collapse | 0-5 mm Hg |
| Between 1.5 and 2.5 cm | Decrease in diameter > 50% | 5-10 mm Hg |
| Between 1.5 and 2.5 cm | Decrease in diameter < 50% | 10-15 mm Hg |
| More than 2.5 cm | Decrease in diameter < 50% | 15-20 mm Hg |
| More than 2.5 cm | No change | >20 mm Hg |
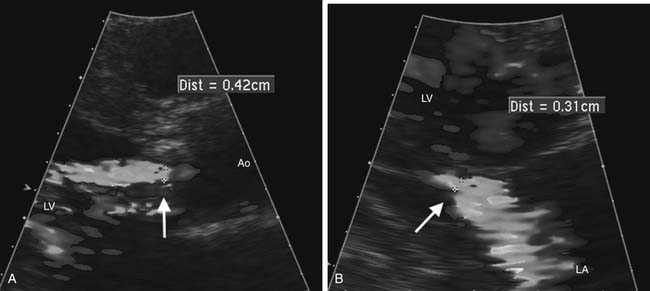
Echocardiography is the method of choice for the noninvasive evaluation of valvular regurgitation.14,15 Color Doppler mapping is helpful for visualization of the jet origin and direction. Measurement of the narrowest jet width on color Doppler imaging (vena contracta) at or just distal to the regurgitant orifice is a simple measure that correlates with regurgitation severity and is less affected by eccentric regurgitant jets (Fig. 55-9). Accuracy in measuring the vena contracta is crucial as small errors lead to inaccurate assessment of regurgitation severity. Another qualitative marker of regurgitation severity is flow reversal of the Doppler signal in adjacent upstream vascular structures, seen when regurgitation severity is moderate or greater. Quantitative measures of regurgitant severity are recommended for clinical decision making and are discussed in the later section on valve disease. Recommended quantitative approaches include the proximal isovelocity surface area approach16 and comparison of volume flow rate across the regurgitant valve with that of a normal valve.15
VENTRICULAR FUNCTION
Systolic Function
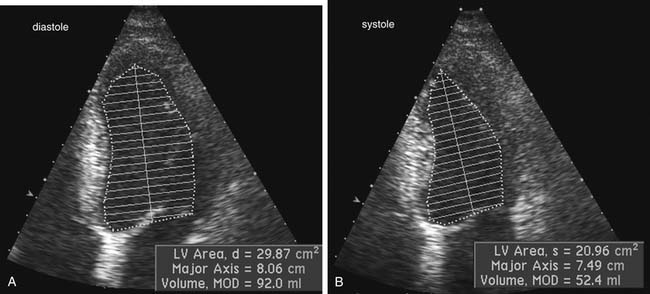
Two-dimensional echocardiographic imaging allows assessment of global and regional left ventricular systolic function. Diameter measurements of left ventricular chamber dimension at end-systole and at end-diastole by either two-dimensional or M-mode imaging are accurate and reproducible. Fractional shortening, the diastolic to systolic change in internal chamber dimension divided by the end-diastolic dimension, is a measure of systolic function, with a normal range of 25% to 45%. However, global systolic function is more precisely described by ejection fraction (EF), which uses end-diastolic volume (EDV) and end-systolic volume (ESV).6 Volumes are calculated from endocardial border tracings in two orthogonal views by geometric formulas (Fig. 55-10). The most commonly applied algorithm is the biplane apical summation of discs method. Accuracy in ejection fraction measurement depends on adequate endocardial definition. Because the left ventricle is assumed to be bullet shaped and symmetrical, standard, nonoblique imaging planes are needed for optimal measurement.
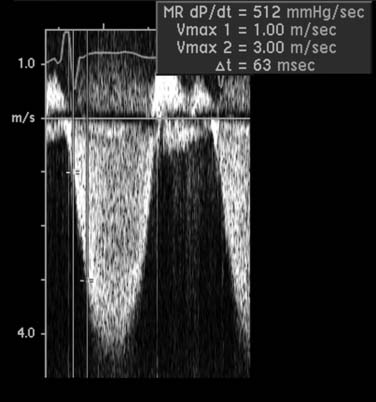
A Doppler-derived measure of left ventricular systolic function uses the early systolic rate of velocity increase in the mitral regurgitant jet, a relatively load independent measure of contractility (Fig. 55-11). The transmitral pressure gradient is measured at two points on the velocity curve. The slope of the mitral regurgitant jet between these two points represents the rate of change in left ventricular pressure over time (dP/dt). A normal dP/dt is more than 1000 mm Hg/sec; a lower dP/dt slope is concordant with a delay in left ventricular systolic pressure generation and depressed left ventricular function.
Diastolic Function
Diastole comprises four phases: (1) isovolumic relaxation; (2) atrioventricular valve opening with passive early rapid ventricular filling; (3) diastasis, or deceleration of passive left ventricular filling due to equalization of atrial and ventricular pressures; and (4) late active ventricular filling due to atrial contraction. Several echocardiographic parameters are used to evaluate diastolic function.17,18 Increased left atrial chamber size is a surrogate measure of increased left atrial (and left ventricularend-diastolic) pressures. Pulsed wave Doppler diastolic indices include evaluation of left ventricular inflow velocities with early E wave filling and the atrial contribution to filling (A wave). The time for the E wave deceleration and isovolumic relaxation time are measures of ventricular relaxation.
In normal, young individuals, early filling is the dominant component to ventricular filling, with atrial contraction contributing less than 20% to total filling volume. The E wave is dominant, with an E:A ratio above 1.0. With aging, ventricular stiffness increases with delay of myocardial relaxation and increased relative contribution of atrial contraction (impaired relaxation; Fig. 55-12). This is manifested as reversal of the E and A velocities and an E:A ratio of less than 1. In advanced diastolic dysfunction, decreased ventricular compliance leads to rapid equalization of the transmitral diastolic pressure gradient. With increased left ventricular end-diastolic pressure, the atrial contribution to ventricular filling is relatively small. This is manifested as a reversal of the transmitral filling pattern with an E:A ratio above 2, a steep deceleration slope, and a shortened isovolumic relaxation time (Fig. 55-13). Although patients in transition from an impaired relaxation pattern to a restrictive pattern have decreased ventricular compliance, the E:A ratio may appear normal, making interpretation of diastolic indices difficult. Loading conditions (heart rate, volume overload, mitral regurgitation) affect left atrial pressure and transmitral gradients. Mitral inflow evaluation repeated during a Valsalva maneuver (transient preload decrease) may unmask diastolic dysfunction, aiding in diagnosis.
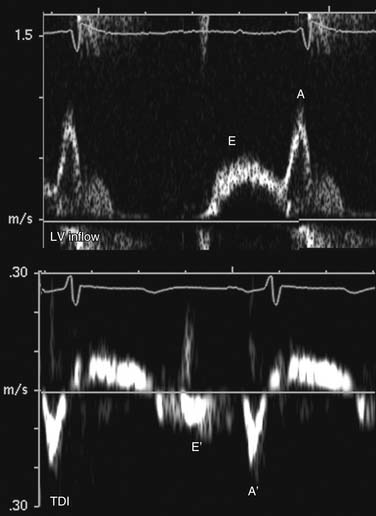
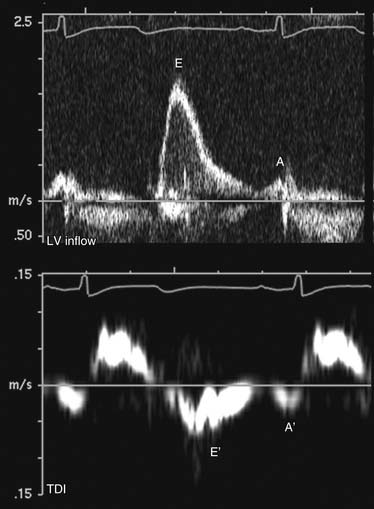
Tissue Doppler interrogation at the septum and lateral wall just below the mitral anulus allows evaluation of myocardial diastolic motion. Myocardial early (E′) and atrial (A′) waves correspond to mitral E and A waves but are less sensitive to atrial loading conditions than mitral inflow (see Figs. 55-12 and 55-13). The ratio of transmitral E to myocardial E′ is a surrogate measure of left ventricular filling pressure. An E:E′ ratio below 8 suggests normal left atrial pressure, and a ratio above 15 suggests increased left atrial pressure. A ratio between 8 and 15 is indeterminate, and other indices should be used for diastolic assessment.
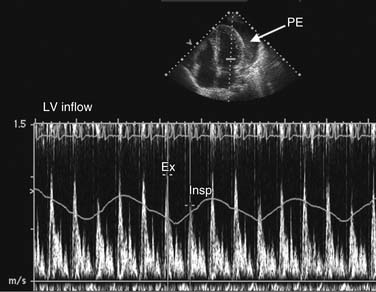
Abnormalities in diastolic indices can also be seen with extracardiac constraint of ventricular filling, such as in constrictive pericarditis or tamponade. Normal right ventricular filling demonstrates mild respiratory variation in transtricuspid velocities. On inspiration, there is an increase in systemicvenous return and a transient increase in velocities, with normal magnitude increase less than 20%. Because left atrial filling is not respiratory dependent, transmitral velocities do not normally vary with respiration. With pericardial tamponade and chronic pulmonary disease, exaggerated inspiratory-expiratory respiratory variation in the transtricuspid and transmitral velocities can be seen (Fig. 55-14).
ISCHEMIC HEART DISEASE
Echocardiography is useful in detection of coronary disease in patients with chest pain symptoms. In patients with active chest discomfort, the absence of regional wall motion abnormalities on a resting study is an effective means of ruling out acute ischemia (negative predictive accuracy ~95%).5 In the operating room, intraoperative TEE allows continuous monitoring of cardiac function and has been used during coronary revascularization, during valvular surgery, and in noncardiac surgery to monitor patients at high risk of cardiac events. TEE has also proved useful for the evaluation of cardiac function in the hemodynamically unstable patient when ischemia is suspected but transthoracic windows are suboptimal.
Takotsubo cardiomyopathy, or transient apical ballooning syndrome, is a newly recognized acute, ischemic cardiac syndrome. Clinical presentation is acute chest pain or dyspnea that follows a significant emotional or physiologic stress. The clinical manifestation is transient akinesis of the apical and mid left ventricular segments with regional wall motion abnormalities that extend beyond a single epicardial coronary arterial distribution. This condition is rare, with a strong predominance of women (>90%). Angiography demonstrates absence of obstructive coronary disease or acute plaque rupture. Outcome is generally good, and ventricular functional recovery is likely with supportive care.19,20
Stress Testing for Coronary Disease
Stress echocardiography is useful for initial diagnosis of coronary disease, monitoring of disease progression in patients with known coronary lesions, and evaluation of the functional significance of residual lesions after revascularization. Stress echocardiography provides direct, real-time visualization of myocardial function, allowing diagnosis of induced myocardial ischemia in a controlled setting.21,22 Accuracy for stress echocardiography to determine the extent and location of myocardial ischemia is excellent, and it is particularly useful when baseline electrocardiographic abnormalities render standard exercise electrocardiography testing nondiagnostic. The addition of echocardiographic images at rest and at peak stress increases both sensitivity and specificity over standard exercise electrocardiography. Various exercise (treadmill or bicycle ergometer) and nonexercise (pharmacologic—dobutamine) cardiac stressors are used. Images are acquired at rest and at peak stress. For treadmill protocols, images are acquired immediately after stress because of imaging difficulties while the patient is upright on the treadmill. Resting and stress imaging data are then integrated with electrocardiographic data, exercise tolerance, and the patient’s symptoms for final interpretation. With use of standard views of the left ventricle, side-by-side comparison of the rest and stress digital images identifies new wall motion abnormalities (see Fig. 55-4). Ischemia diagnosis is dependent on accurate evaluation of segmental wall motion and visualization of interval change from the rest images. As a consequence, diagnosis of ischemia is often more difficult in patients with preexisting coronary artery disease and resting abnormalities. When endocardial definition is suboptimal, intravenous contrast agents can be used to opacify the left ventricular cavity and to aid in endocardial border definition. Results of stress echocardiography testing offer long-term prognostic information.23–25
Stay updated, free articles. Join our Telegram channel

Full access? Get Clinical Tree


