Fig. 1 a–d..
Advantages of tissue harmonic imaging (THI) (a, c) compared to normal b-mode (b, d). Isoechoic fibroadenoma with lower visibility on normal b-mode (b) and better conspicuity on THI (a). Complicated cyst with internal echoes and less clearly visible septal structures (d); on THI, the internal part becomes anechoic and the septal structures more accentuated (c)
As a shortcoming, THI is not applicable to deeper regions and macromastia, since due to their physical properties harmonics can only be generated in more superficial layers.
Color Doppler
The development and growth of tumors is predominantly based upon neovascularization as a result of angiogenin production by the tumor cells [10]. This feature is used to visualize malignant lesions on MRI and color Doppler ultrasound. Numerous qualitative (morphological) and quantitative criteria, such as the resistance index (RI), the pulsatility index (PI), and systolic peak flow velocity (Vmax) have been described with varying diagnostic significance [11–13]. A larger number of penetrating vessels and higher values of RI, PI, and Vmax were considered as indicators of malignancy [14]. However, these flow-parameters are of less significance because of a large overlap between slowl-growing cancers with low vascularity and fast-growing cancers with higher vascularity. Moreover, they are not reproducible when the examination conditions differ (device, choice of flow parameter, location of measurement). Additionally, flow measurements are time-consuming and require vast experience. By contrast, morphological parameters are easier to assess, more reproducible, and of a higher diagnostic yield [15]. Thus, Madjar recommended simply observing the presence and number of vessels. Setting the cut-off for the depiction of vessels at >2, he was able to reach a sensitivity and specificity for the detection of malignancy of 90% and 93%, respectively [15]. Moreover, vascular pattern helps to predict the probability of a lesion’s malignancy if used together with other criteria [14]. In this context, it can be helpful to consider the exact course of the vessels adjacent to the lesion, as performed by Svennson [16] (Fig. 2). Thus, benign vascular patterns, such as avascularity, higher vascularity in the periphery, and peripheral, marginal vessels connecting with internal vessels, significantly differed from malignant patterns. Typical of malignant lesions were radially aligned external vessels, radial internal vessels connected with radial external vessels, and a higher degree of internal than external vessels. It is worth mentioning that when using the Doppler function, it is essential to apply only a slight pressure on the probe and to keep the field of view (FOV) very small, thus obtaining better Doppler signals (Fig. 3).
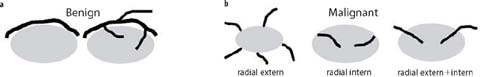
Fig. 2 a, b.
Vascular pattern with color Doppler to estimate the risk of malignancy, according to Svennson: vessels in benign lesions tend to be more in the periphery, partially connecting with internal vessels (a), whereas vessels in malignant lesions have a radial pattern either in the outer or the inner part and a higher degree of internal than external vessels (b).
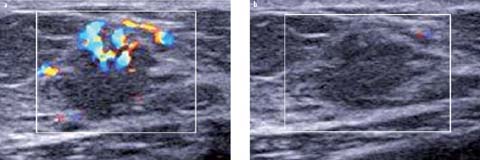
Fig. 3 a, b.
Demonstration of the use of the color Doppler function in a strongly vascularized cancer lesion. A small region of interest, just around the lesions, should be chosen to achieve better Doppler signals. Only very slight pressure should be applied on the probe (a). If higher pressure is applied the Doppler signals, and thus vascularization, cannot be depicted (b)
To summarize, the essential features to be applied when evaluating a lesion with color Doppler are the presence of vascularity, the number of vessels, and the vessel pattern. However, vascular categorization is not always applicable due to poor vessel visualization and, even more importantly, vascular characterization can only be regarded as an adjunct to other b-mode features.
Elastography
Ultrasound elastography is a recently introduced examination technique. In response to an external force, breast tissue is displaced, with stiff tissue being less displaced than soft tissue. Carcinomas exhibit an increased stiffness and thus less tissue displacement than normal breast tissue, and this mechanical characteristic is used to differentiate benign from malignant lesions. Thus, elastography is primarily a characterization rather than a detection tool, due to following physical properties: elasticity can generally be seen as the relation of necessary stress (pressure) to the relative change in length obtained (strain). It describes how much pressure has to be applied to elastically deform a tissue, which is dependent on its intrinsic elasticity (=Young’s modulus of elasticity) [17]. Young’s modulus of elasticity can therefore be considered as a description of tissue elasticity according to the formula: E= / (elasticity=pressure applied to the breast/ breast tissue deformation under pressure).
This differentiation criterion of absent strain (increased stiffness) has been evaluated in terms of its additional benefit to normal b-mode features in a series of studies, which demonstrated a general increase in specificity [18]. Nevertheless, the conditions of application and interpretation considerably vary between the different elastography software and devices. Essentially, two main elastography techniques can be distinguished: freehand strain elastography and shear-wave elastography. Strain elastography can be further subdivided into real-time-elastography (e.g., Hitachi) and tissue-Doppler/ tissue strain imaging (e.g., Toshiba), whereas shear-wave elastography can be subdivided into genuine shear-wave elastography (e.g., Supersonic) and acoustic radiation force impulse (AFRI) technology (e.g., Siemens). In the following, only real-time elastography, as the most commonly applied form of strain elastography, and genuine shear-wave elastography are discussed in detail.
Free-Hand Strain Elastography
The manual compression applied on the probe can be described as rapid and sinusoidal movements of the hand. The induced tissue movements between the frames are calculated by a dedicated software, and the resulting signals registered before and after tissue displacement are transformed into b-modes images. Strain data are displayed as either a black/white elastogram, with black representing a stiff area and white a soft area, or a color map [19]. Color-coding is not uniform among the manufacturers, thus partially aggravating the interpretation. The most commonly applied color map, primarily used by the Hitachi ultrasound device, is the one developed by Itoh et al. [20]. This elasticity score (the Tsukuba score, named after the clinic where the work was conducted) has been validated in large series of histologically proven breast lesions and is based upon a 5-point scale (Fig. 4), with the risk of malignancy increasing from a score of 1 (=benign) to a score of 5 (=malignant). Numerous studies have shown that the additional use of an elasticity score increases specificity from 56–83% to 68–87% compared to normal b-mode images [21–23]. Another helpful tool is to compare the b-mode image with the elastographic image: benign lesions on the elastographic display are typically identical in size or smaller than on b-mode display, whereas malignant lesions appear to be larger on elastography than on b-mode display.
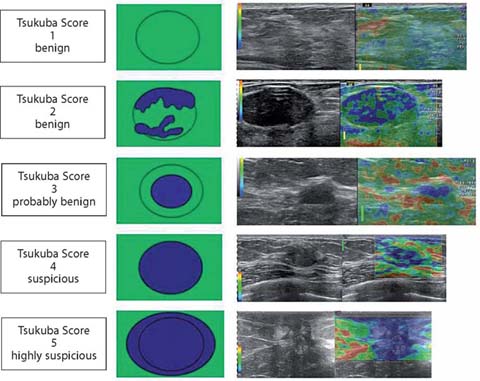
Fig. 4.
Tsukuba elasticity score to estimate the risk of a lesion of being malignant. 1: lesion entirely green (same elasticity throughout the lesion). 2: blue and green mosaic (most of the lesion deformable). 3: deformability only in the periphery of the lesion. 4: blue lesion (no deformability throughout the entire lesion). 5: lesion and adjacent tissue are blue (no deformation of the lesion or the adjacent tissue).
Nevertheless, the main disadvantage of strain elastography is that it is strongly operator-dependent such that large images may vary widely [23, 24]. Attempts have been made to reduce the interobserver variability by implementing semi-quantitative region of interest (ROI) measurements, such as the strain-ratio (strain of surrounding fat tissue/ strain of the lesion to be investigated). Lesion assessment was further improved by the additional use of a cut-off value, which can vary between 2.27 and 4.3 [21, 25, 26]. Values below the cut-off value indicate a benign lesion whereas values above the cut-off indicate a suspicious lesion. Although a certain improvement in interobserver agreement [21] and accuracy [25] has been obtained by the strain-ratio compared to the basic Tsukuba-elastography scoring, the difficulty in accurately assigning a lesion to a certain category remains, since strain-ratio measurements are based upon the individually generated elastography image.
Moreover, free-hand elastography requires a certain training phase to learn the adequate manual skills to be applied [19]: pressure on the probe, frequency of compression/decompression, and angulation of the probe. Hence, misinterpretations are possible by improper compression, deeply located lesions (>3 cm), large lesions (especially lesions larger than the FOV), non-perpendicular orientation of the probe, and if the lesions slides out of the FOV When drawing the FOV, it is essential that the lesion is surrounded by sufficient adjacent tissue to avoid images of poor quality and misleading color coding; thus, it is advisable to draw the FOV as large as possible (from the subcutaneous fat layer to the superficial fascia of pectoral muscle) (Fig. 5).
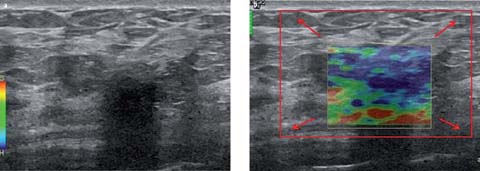
Fig. 5 a, b.
Demonstration of improper field of view (FOV) placement for strain elasticity measurements (a, b) of a hypoechoic lesion with posterior shadowing on b-mode (a). The originally placed FOV covers only the lesion; thus, its estimation using the obtained color map remains difficult (b). For correct calculations, the lesion has to be surrounded by enough adjacent tissue. Therefore, the size of the FOV should reach from the subcutaneous fat layer to the superficial fascia of pectoral muscle (red rectangle in b)
Shear-Wave Elastography
In shear-wave elastography, unlike the method described above, mechanical vibrations are generated by an acoustic radiation impulse induced by the ultrasound probe itself. This push impulse generates slowly propagating shear waves at a low-frequency (∼50 Hz) and at different depths. The ultrasound probe is equipped with an ultrafast acquisition frequency (5000 frames/s) and captures the propagation of shear waves. The propagation speed is used to calculate Young’s modulus of elasticity according to the formula: E=acoustic radiation impulse/ strain=3 μ=3 p v2 (m/s) where μ is the shear wave, p is a constant and v the shear wave speed.
Stiffness information can be displayed in kPa based upon ROI measurements (e.g., maximum elasticity, Emax, in kPa). Additionally, images can be evaluated on a realtime color map linked to the value in kPa, ranging from 0 to 249 kPa(=Ecol)(Fig. 6).
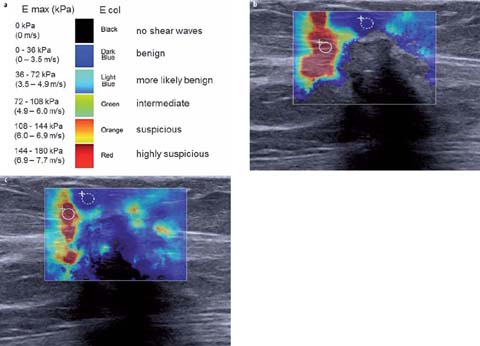
Fig. 6 a–c.
Color spectrum of shear waves with quantitative parameters of maximum elasticity Emax (kPa) and qualitative parameters of elasticity color Ecol (a) to characterize the depicted cancer lesion. The red color at the margin of the cancer lesion along with the measured Emax of 156 kPa (region of interest within the red area) indicates increased stiffness. With standard mode (b) no shear waves are visible in the center of the lesion, which suggests that their shear wave speed is extremely high. When penetration mode (c) is used, shear-wave signals are increased and shear waves become visible even in the center of the lesion, even though the stiffest part is still at the margin of the lesion
Given that the probe is constantly held using only a light pressure, interobserver agreement is good, or at least much better than strain imaging [27]. As shear waves propagate quickly in stiff tissue and slowly in soft tissue, higher shear-wave speeds are typical of cancer (red color=highly suspicious). The color indicating shear-wave speed can be located either in the center or at the margin of the lesion. There are two theories explaining the absence of shear waves in the lesion’s center: (1) the shear-wave speed is too high to be captured by the probe and (2) the ultrasound beam to capture the shear waves cannot penetrate the deeper parts of scirrhous cancer [28]. It is worth mentioning that there are different modes of lesion visualization (Fig. 6b, c). Thus, in penetration rather than standard mode, the amplitude of the signal and the signal-to-noise ratio (SNR) are increased based upon constructive interfaces and color-coding of the lesion can thus be modified e.g., from no shear waves in the center of the lesion with standard mode to a certain color-coding assigned with penetration mode.
Stay updated, free articles. Join our Telegram channel

Full access? Get Clinical Tree


