Fig 1 a–f.
Types of calcification. Benign: a central, b central multifocal, c uniform, d lamellar. Indeterminate: e eccentric, f stippled
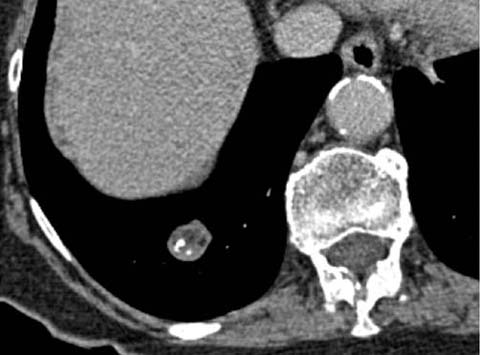
Fig 2.
Pulmonary hamartoma. Intralesional fat and popcorn calcification are seen
Other morphological features that are associated with benign lesions include a polygonal, elongated (length: width ratio >2), elliptical, linear, or plaque-like shape, particularly when related to the fissures or pleural surfaces. Indeed, not all such lesions are by definition strictly nodules, as some are best characterized as scars. Elliptoid nodules in the upper lobes are occasionally due to benign intrapulmonary lymph nodes. These findings are reported with variable incidence by pathologists and with variable incidence and confidence by radiologists. The confident accurate diagnosis of benign intrapulmonary lymph nodes requires an upper lobe location of an elongated nodule aligning lengthwise along typical lymphatic locations, such as the fissures or bronchi of the central axial interstitium.
Features of Malignant Solid Nodule
Specific features of malignancy are common in larger nodules but relatively uncommon in nodules smaller than 1 cm. Spiculation, microlobulation, pleural tags, satellite nodules, and the presence of a bronchus leading directly into a nodule (“CT bronchus sign”) (Fig. 3) are associated with a high probability of neoplastic disease, although occasionally they are also seen in inflammatory or infectious diseases, including mycobacterial disease. Cavitation is a feature that can be seen in neoplastic as well as benign infectious diseases (including bacterial, mycobacterial, and fungal diseases) and inflammatory diseases (e.g., vasculitides, Langerhans cell histiocytosis). The appearance of thicker-walled cavities on chest radiographs has historically been described as a feature favoring neoplasia [1]; however, this earlier radiographic interpretation has not been corroborated by CT evaluation of the wall thickness of nodules or masses [2].
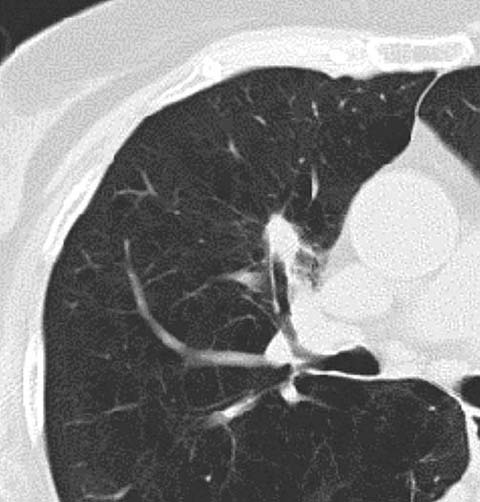
Fig 3.
CT bronchus sign in an adenocarcinoma of the lung
CT Studies of Nodule Enhancement
Evaluation of the physiology of a solid lung nodule may be of assistance in determining whether the lesion is benign or malignant. Nodule enhancement studies consist of a non-contrast acquisition through the lesion at 120 kVp followed by repeated post-contrast acquisitions at 1, 2, 3, 4, and 5 min. Adapted protocols that evaluate initial nodule enhancement to extract perfusion metrics have also been developed. A multicenter study by Swensen et al. demonstrated that nodules that enhance <15 HU are highly likely to be benign [3]. Nodules that enhance more than 15 HU may be benign or malignant. Important caveats to this study are that the region of interest for evaluating nodule density before and after contrast should cover at least 70% of the lesion’s surface area and that heterogeneous or cavitary lesions cannot be evaluated by nodule enhancement studies. Moreover, false-negative results are frequently obtained in mucin-rich lesions such as mucinous adenocarcinomas. The clinical value of this imaging approach is in its very high negative predictive value (96%). However, in clinical practice only a small fraction of benign lesions exhibit low level enhancement; thus, even after this imaging approach the vast majority remain indeterminate. Therefore, PET/CT is gaining increasing favor as an alternative physiological assay of nodule activity, as it is more likely to alter the pre-test probability of malignancy or benignity.
The introduction of dual-energy CT, either by dual-source or rapid kVp switching, has permitted the accurate determination of contrast enhancement without the need for pre-contrast images [4]. This may be helpful in assessing the extent and pattern of lesion enhancement, perhaps as a surrogate marker of enhancement before and after treatment (Fig. 4). Yet, it is unclear whether this technological evolution can be used to distinguish benign from malignant disease. Certainly, the implementation of nodule enhancement is problematic in that in the original studies imaging was performed at 120 kVp. As such, appropriate thresholds for enhancement evaluation at kVp values ranging from 80 to 140 kVp have not been determined.
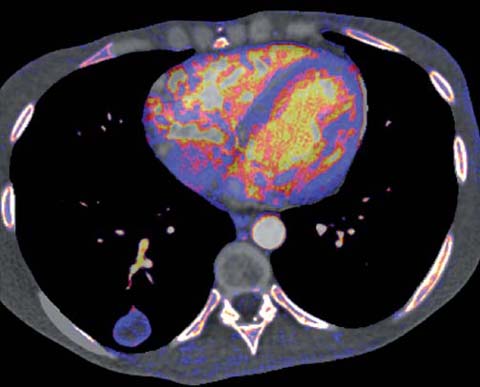
Fig 4.
Dual-energy CT demonstrating peripheral enhancement of a pulmonary metastasis
Indeterminate Solid Nodules
Unfortunately, the majority of nodules are indeterminate on CT imaging, as they do not demonstrate features that can be definitively considered as benign or malignant. In the Mayo screening series of more than 1,500 patients, over 3,300 indeterminate non-calcified nodules were identified, the vast majority of which were small (≼4 mm) and benign [5]. Even in established smokers, the risk of malignancy in nodules of this size is <1% [6]. The management of indeterminate nodules was previously a matter of debate. However, recent evidence-based guidelines from the Fleischner Society have greatly transformed the management of these nodules [7]. It should be noted that the guidelines apply to the management of incidentally detected solid nodules in patients over the age of 35 who are not immune-suppressed. The guidelines vary according to whether patients are smokers (high risk) or non-smokers (low risk) but significantly eliminate the need for follow-up of small nodules in low-risk patients and greatly reduce the frequency of follow-up in other patients (Table 1). In addition, these guidelines do not apply to subsolid nodules, nor to patients with suspected neoplastic disease. In the former, a more infrequent follow-up may be appropriate (see below); in the latter, a more aggressive follow-up schedule or correlation with biopsy or PET may be indicated.
Table 1.
Fleischner guidelines for incidentally detected solid nodules
Nodule size | Low risk | High risk |
|---|---|---|
≼4 mm | No follow-up | 12 months follow-up No change→Stop |
>4–6 mm | 12 months follow-up No change→Stop | 6–12 months then 18–24 months follow-up No change→Stop |
>6–8 mm | 6–12 months then 18–24 months follow-up No change→Stop | 3–6, 9–12 months, then 24 months follow-up No change→Stop |
>8 mm | 3, 9, 24 months follow-up, or CT/PET, or biopsy | |
Role of Computer-Assisted Diagnosis for Solid Nodules
Computer-aided detection (CAD) improves the detection of pulmonary nodules, although its sensitivity varies depending on the characteristics of the lesion, including its size, density, and location. Sensitivity also depends on technical parameters, such as the thickness of the evaluated CT images. Moreover, there are vendor-specific issues related to CT algorithm optimization with the goal of obtaining high detection rates with an acceptable rate of false-positive detections. Most CAD systems also contain computer-aided diagnosis (CADx) features for the evaluation of pulmonary nodules. CADx systems may incorporate algorithms that can perform two- or three-dimensional analysis of the density of focal lung opacities as well as morphometry to determine the likelihood of malignancy, often expressed as a percentage probability of malignancy. But while this complex method of analysis performs better than human readers across multiple cases, it is difficult to reliably apply percentage probabilities to individual cases [8].
One of the most useful features of CADx is the ability to segment individual nodules, which permits a three-dimensional evaluation of the lesion’s size and shape and can be coupled with follow-up examinations to determine volumetric growth. This approach is based on the observation that the doubling time of benign lesions is far longer than that of malignant lesions [9]. Volumetric evaluation of growth is also more reliable than reader-generated uni- or bidimensional size measurements [10]. Moreover, volumetric evaluation may be more sensitive to the detection of asymmetric growth, a feature that is limited to malignant lesions (Fig. 5). A commonly applied threshold for the volume doubling time of a solid lesion is 400 days, although several authors have advocated a threshold of 500 days [11–13]. This extended threshold is perhaps more prudent when the veracity of volumetric nodule evaluation is assessed. The accuracy and reproducibility of lung nodule segmentation have been confirmed in artificial and porcine models. However, the reproducibility of in vivo human nodule measurements can vary by up to 15%. This was demonstrated by evaluating the same nodule in different phases of inspiration or by using CT data based on different slice thicknesses or obtained with different software packages [13, 14]. Less significant changes may occur as a result of different reconstruction algorithms or radiation-dose variation. The presence or absence of intravenous contrast appears to play a largely inconsequential role. Nonetheless, by ensuring that a similar technique is employed on initial and follow-up examinations, lung nodule volumetry shows great promise and may further reduce the need for follow-up examinations.
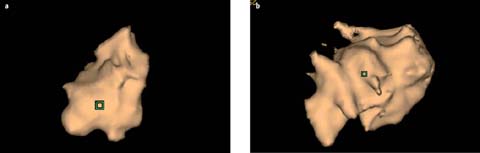
Fig 5 a, b.


Adenocarcinoma of the lung. Computer aided 3-D volumetric evaluation demonstrating asymmetric growth over an 11-month period. a Initial evaluation, b follow-up evaluation
Stay updated, free articles. Join our Telegram channel
Full access? Get Clinical Tree
