Cardiac rehabilitation (CR) improves functional capacity and reduces mortality in patients with cardiovascular disease. It also improves cardiovascular risk factors and aids in weight reduction. Because of the increase in morbidly obese patients with cardiovascular disease, the prevalence of obesity and patterns of weight change in those undergoing CR merit fresh study. We studied 1,320 participants in a 12-week CR program at our academic medical center. We compared 5 categories: 69 class III obese (body mass index [BMI] ≥40) patients, 128 class II obese patients (BMI 35.0 to 39.9), 318 class I obese patients (BMI 30.0 to 34.9), 487 overweight patients (BMI 25.0 to 29.9), and 318 normal weight patients (BMI 18.5 to 24.9). Exercise capacity in METs, weight, blood pressure, and fasting lipid profile were measured before and after CR. Overall, 131 patients gained weight, 827 had no significant weight change, and 363 lost weight (176 lost 3% to 5% of their baseline weight, 161 lost 5% to 10%, and 26 lost >10%). Exercise capacity, blood pressure, and low-density lipoprotein cholesterol improved in all patients. Class III obese patients had the smallest improvement in peak METs (p <0.001), but the greatest weight loss. Patients who lost >10% of their baseline weight had the greatest improvements in exercise capacity, low-density lipoprotein, and triglycerides. In conclusion, after CR, a minority of patients lost weight. Most patients had no significant weight change and some even gained weight. The greatest loss was seen in class III obese patients. All patient groups showed improvements in exercise capacity and risk factors, regardless of the direction or degree of weight change.
The prevalence of obesity has drastically increased in the United States with 35% of US adults now classified as obese (body mass index [BMI] ≥ 30 kg/m 2 ). Obesity is associated with major cardiovascular diseases and excess mortality. CR improves risk factors, exercise capacity, and mortality rates in patients with cardiovascular disease. CR is also associated with weight loss in mild-to-moderate obesity, although degrees of weight loss have often simply been reported as means. Obesity also negatively impacts aerobic capacity in patients undergoing CR. Despite the suggestion of an obesity paradox in obese patients with cardiovascular disease, purposeful weight loss in these patients leads to improvements in exercise capacity and risk factors. We undertook the present study to explore the prevalence and consequences of obesity, and the direction and effect of weight change, in patients undergoing CR.
Methods
Between October 2004 and September 2013, 1,320 patients enrolled in CR at our institution within 1 year after interventions for coronary artery disease and/or valvular heart disease, including cardiothoracic surgery. Clinical data were taken from patient records, and our institutional review board approved this study.
The details of our CR program have been described previously. Briefly, our program consists of 3 sessions per week for 12 weeks (total of 36 sessions) of exercise and health and nutrition education. An exercise physiologist creates individualized exercise plans based on history, co-morbidities, physical fitness, clinical status, and recommendations by the American College of Sports Medicine Guidelines for Exercise Testing and Prescription.
At each visit, baseline vital signs, including height, weight, systolic and diastolic pressures, heart rate at rest, and METs level achieved were recorded for all patients. Patients were weighed on a standard scale while wearing regular clothes at the beginning of each rehab session. Obesity indices were measured at the start and the end of the 36-week program. Quality of life was also evaluated at the beginning and the end of the program using the Ferrans and Powers Quality of Life Index Cardiac Version IV questionnaire. Additional initial blood measurements included a lipid profile and hemoglobin A1C. Left ventricular function was measured by standard echocardiographic techniques. Exercise training was implemented during 30- to 40-minute sessions including upper and lower body training, walking laps on a track, and the use of cycle ergometers, treadmills, and stair-climbers. Steady-state METs levels were recorded at each session and were obtained either automatically from exercise devices or using a standardized METs formula.
Based on BMI at the time of enrollment in CR, participants were categorized by World Health Organization (WHO) definitions as: normal weight (BMI 18.5 to 24.9), overweight (BMI 25 to 29.9), class I obese (BMI 30 to 34.9), class II obese (BMI 35 to 39.9), or class III obese (BMI ≥40). We compared baseline demographics, exercise capacity, weight, blood pressure, and fasting lipid profile as well as changes in these parameters between enrollment and completion of the program among participants in each category.
In a separate analysis, patients were categorized based on change in weight from CR entry to CR exit based on American Heart Association/American College of Cardiology (AHA/ACC) recommendations for meaningful weight loss. These categories were: weight gain, no significant change in weight (−3% to +3%), 3% to 5% weight loss, 5% to 10% weight loss, and >10% weight loss. We compared baseline characteristics, including age, gender, BMI, exercise capacity, blood pressure, and fasting lipid profile. We also examined changes in CR metrics (exercise capacity, low-density lipoprotein [LDL], high-density lipoprotein, triglycerides, systolic and diastolic pressures, and so forth) as they related to these weight change categories.
Descriptive statistics (frequency and percentage for categorical factors, mean and standard deviation for continuous factors) were calculated and compared for statistical significance by BMI group or weight change using chi-square or Fisher’s exact tests for categorical variables and Student’s t test for continuous variables. Baseline and postrehabilitation measurements were compared using paired t -tests, and changes calculated as mean (95% CI) of postrehabilitation minus baseline levels. Multivariable linear regression models were constructed with METs as the dependent variable, and independent predictors were selected for inclusion using a backward selection methodology. All potentially significant univariate predictors of exercise capacity (p <0.10) were included in the model, and least significant covariates were removed individually until all remaining covariates were statistically significant predictors of exercise capacity. A p value of 0.05 was considered statistically significant. The SAS statistical software package (version 9.1, SAS Institute, Cary, North Carolina) was used for all analyses.
Results
To define the prevalence and degree of obesity in patients entering CR, we analyzed participants based on the WHO weight definitions. Between October 2004 and September 2013, a total of 1,326 patients enrolled into CR at our institution, attended at least 2 CR sessions, and had complete data, including BMI before CR and weight before and after CR. Six patients were excluded because of being underweight (BMI <18.5). Of the remaining patients, 318 were normal weight and 1,002 had a BMI ≥25. Baseline demographic and clinical characteristics of the 1,320 participants are listed in Table 1 . Significant trends were seen across BMI groups for age, female gender, hypertension, hyperlipidemia, and diabetes. Class III obese patients were younger (56 ± 10), more likely to be female (51%), and reported the worst baseline quality of life. Patients in all groups had similar METs at baseline. After CR, participants in all BMI classes showed improvements in exercise capacity and weight, although peak METs decreased with increasing BMI ( Figure 1 ).
| Characteristic | Body Mass Index (Kg/m 2 ) | |||||
|---|---|---|---|---|---|---|
| ≤ 25 N = 318 (24%) | 25.0-29.9 N = 487 (37%) | 30.0-34.9 N = 318 (24%) | 35.0-39.9 N = 128 (9%) | ≥ 40.0 N = 69 (5%) | P for trend | |
| Age (years) | 67 ± 12 | 64 ± 11 | 61 ± 11 | 58 ± 10 | 56 ± 10 | <0.001 |
| Men | 226 (71%) | 377 (77%) | 234 (74%) | 84 (66%) | 34 (49%) | 0.002 |
| Quality of life | 24 ± 4 | 23 ± 4 | 22 ± 4 | 22 ± 4 | 20 ± 6 | <0.001 |
| Hypertension | 219 (69%) | 379 (78%) | 258 (81%) | 113 (88%) | 62 (91%) | <0.001 |
| Systolic pressure (mm Hg) | 120 ± 19 | 121 ± 18 | 123 ± 18 | 125 ± 15 | 128 ± 17 | <0.001 |
| Diastolic pressure (mm Hg) | 69 ± 11 | 70 ± 10 | 71 ± 10 | 72 ± 10 | 73 ± 10 | <0.001 |
| Hyperlipidemia | 214 (67%) | 381 (79%) | 256 (81%) | 109 (85%) | 54 (78%) | <0.001 |
| Diabetes mellitus | 54 (17%) | 136 (28%) | 97 (31%) | 59 (46%) | 42 (61%) | <0.001 |
| Hemoglobin A1C (mg/dL) | 5.9 ± 1.1 | 6.3 ± 1.4 | 6.4 ± 1.3 | 6.6 ± 1.5 | 7.0 ± 1.2 | <0.001 |
| Body mass index (Kg/m 2 ) | 23 ± 1 | 27 ± 1 | 32 ± 1 | 37 ± 1 | 45 ± 6 | <0.001 |
| Weight (pounds) | 153 ± 20 | 183 ± 22 | 212 ± 26 | 241 ± 29 | 285 ± 52 | <0.001 |
| Waist circumference (inches) | 35 ± 4 | 39 ± 3 | 43 ± 3 | 47 ± 4 | 51 ± 5 | <0.001 |
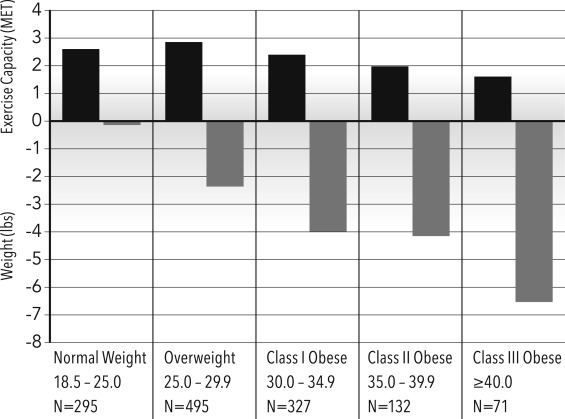
Class III obese patients had the smallest improvements in exercise capacity but the greatest reductions in weight and waist circumference (p <0.001). All groups had similar improvements in LDL cholesterol and blood pressure, but variable changes in triglycerides and high-density lipoprotein concentrations ( Table 2 ).
| Mean difference (95% CI) | N | Body Mass Index (Kg/m 2 ) | ||||||
|---|---|---|---|---|---|---|---|---|
| ≤ 25.0 N = 318 (24%) | 25.0 – 29.9 N = 487 (37%) | 30.0 – 34.9 N = 318 (24%) | 35.5 – 39.9 N = 128 (9%) | ≥ 40 N = 69 (5%) | Spearman Coefficient | P- Value | ||
| Systolic BP (mm Hg) | 1307 | -3.9 (-6.0 to -1.8) | -3.9 (-5.3 to -2.4) | -4.7 (-6.5 to -2.8) | -3.9 (-6.9 to -0.8) | -6.8 (-11.2 to -2.4) | -0.03 | 0.28 |
| Diastolic BP (mm Hg) | 1305 | -1.6 (-2.8 to -0.4) | -1.4 (-2.4 to -0.5) | -1.9 (-3.2 to -0.6) | -2.4 (-4.4 to -0.4) | -3.5 (-6.0 to -1.0) | -0.04 | 0.19 |
| LDL (mg/dL) | 926 | -12.4 (-17.0 to -7.8) | -19.9 (-24.1 to -15.7) | -15.7 (-20.8 to -10.7) | -15.6 (-22.6 to -8.6) | -13.3 (-21.5 to -5.0) | -0.01 | 0.70 |
| HDL (mg/dL) | 964 | 2.8 (1.1 to 4.4) | 2.0 (1.1 to 3.0) | 0.7 (-0.4 to 1.8) | 0.1 (-2.8 to 3.0) | 2.8 (0.3 to 5.4) | -0.06 | 0.06 |
| Triglycerides (mg/dL) | 963 | -8.3 (-18.6 to 1.9) | -13.1 (-22.9 to -3.3) | -27.3 (-41.8 to -12.8) | -32.2 (-68.1 to 3.8) | -19.6 (-42.6 to 3.5) | -0.02 | 0.46 |
Patients were also analyzed based on their degree of weight change. One hundred thirty-one patients gained weight, 827 patients had no significant change (−3 to +3%), 175 patients lost 3% to 5%, 161 patients lost 5% to 10%, and 26 patients lost >10% of baseline weight. Baseline characteristics of weight change groups are provided in Table 3 .
| Characteristic | Weight Gain > 3% N = 131 (10%) | No Change +/-3% N = 827 (62%) | Weight Loss | P for trend | ||
|---|---|---|---|---|---|---|
| 3 to 5% N = 175 (13%) | 5 to 10% N = 161 (12%) | >10% N = 26 (2%) | ||||
| White | 99 (76%) | 683 (83%) | 147 (84%) | 142 (88%) | 25 (96%) | 0.002 |
| Reason for referral | ||||||
| Coronary artery disease | 92 (75%) | 642 (81%) | 148 (87%) | 136 (89%) | 21 (81%) | 0.002 |
| Valvular disease | 29 (24%) | 134 (17%) | 22 (13%) | 12 (8%) | 4 (15%) | 0.001 |
| Diabetes mellitus | 43 (33%) | 259 (31%) | 48 (27%) | 31 (19%) | 7 (27%) | 0.003 |
| Body mass index (Kg/m 2 ) | 27 +/-6 | 29 +/-6 | 30 +/-6 | 30 +/-6 | 30 +/-5 | <0.001 |
| Weight (pounds) | 187 ± 40 | 194 ± 42 | 198 ± 44 | 204 ± 48 | 200 ± 37 | <0.001 |
| Waist circumference (inches) | 38 +/-6 | 41 +/-5 | 41 +/-6 | 42 +/-5 | 43 +/-4 | <0.001 |
| Medication use at start of CR | ||||||
| ACE inhibitors | 81 (62%) | 493 (60%) | 119 (68%) | 107 (66%) | 23 (88%) | 0.005 |
| Sessions attended | 31 +/-8 | 28 +/-11 | 31 +/-9 | 33 +/-7 | 34 +/-7 | 0.001 |
Stay updated, free articles. Join our Telegram channel

Full access? Get Clinical Tree


