Rivaroxaban has been found to be noninferior to warfarin for preventing stroke or systemic embolism in patients with high-risk atrial fibrillation (AF) and is associated with a lower rate of intracranial hemorrhage. To assess the cost–effectiveness of rivaroxaban compared to adjusted-dose warfarin for the prevention of stroke in patients with AF, we built a Markov model using a United States payer/Medicare perspective and a lifetime time horizon. The base-case analysis assumed a cohort of patients with AF 65 years of age with a congestive heart failure, hypertension, age, diabetes, stroke (2 points) score of 3 and no contraindications to anticoagulation. Data sources included the Rivaroxaban Once-daily Oral Direct Factor Xa Inhibition Compared with Vitamin K Antagonism for Prevention of Stroke and Embolism Trial in Atrial Fibrillation (ROCKET-AF) and other studies of anticoagulation. Outcome measurements included costs in 2011 United States dollars, quality-adjusted life years (QALYs), and incremental cost–effectiveness ratios (ICERs). Patients with AF treated with rivaroxaban lived an average of 10.03 QALYs at a lifetime treatment cost of $94,456. Those receiving warfarin lived an average of 9.81 QALYs and incurred costs of $88,544. The ICER for rivaroxaban was $27,498 per QALY. These results were most sensitive to changes in the hazard decrease of intracranial hemorrhage and stroke with rivaroxaban, cost of rivaroxaban, and time horizon. Monte Carlo simulation demonstrated rivaroxaban was cost–effective in 80% and 91% of 10,000 iterations at willingness-to-pay thresholds of $50,000 and $100,000 per QALY, respectively. In conclusion, this Markov model suggests that rivaroxaban therapy may be a cost–effective alternative to adjusted-dose warfarin for stroke prevention in AF.
The Rivaroxaban Once-daily Oral Direct Factor Xa Inhibition Compared with Vitamin K Antagonism for Prevention of Stroke and Embolism Trial in Atrial Fibrillation (ROCKET-AF) demonstrated rivaroxaban was noninferior to warfarin in preventing stroke or systemic embolism in patients with high-risk atrial fibrillation (AF) and significantly decreased the hazard ratio (HR) of intracranial hemorrhage (ICH) by 33%. Although rivaroxaban is a reasonable therapeutic alternative to warfarin, the extent of its adoption and usage for the stroke prevention indication will depend—to some extent—on its economic practicality. The objective of the decision analysis was to estimate the costs, quality-adjusted life years (QALYs), and cost–effectiveness of rivaroxaban compared to adjusted-dose warfarin for the prevention of stroke in patients with AF.
Methods
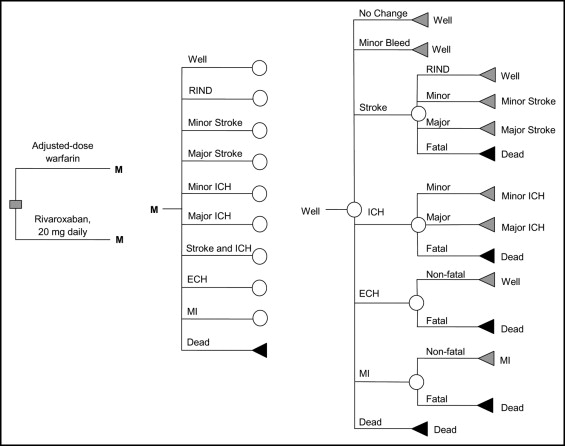
We developed a Markov cohort model to evaluate the cost–effectiveness of rivaroxaban 20 mg 1 times/day (15 mg/day in patients with creatinine clearances from 15 to 50 mL/min) compared to adjusted-dose warfarin in patients with AF ( Figure 1 ). Base-case analysis consisted of a cohort of patients with AF 65 years old at high-risk for stroke (congestive heart failure, hypertension, age, diabetes, stroke [CHADS 2 ] score of 3) and no contraindications to anticoagulation. Health states modeled included well with AF, ischemic stroke, ICH, extracranial hemorrhage, myocardial infarction, minor hemorrhage and death. All patients entered the Markov model in the “well with AF” state and were allowed to transition between health states based on defined transition probabilities that were derived predominantly from the ROCKET-AF trial. Other sources of probabilities included published studies of anticoagulation identified through searches of MEDLINE and the Tufts Cost–Effectiveness Analysis Registry. A cycle length of 1 month, a United States payer/Medicare perspective, and a time horizon of 35 years (to assure patients have the opportunity to be followed for a lifetime) were used. Evaluated outcomes included total AF treatment costs in 2011 United States dollars, QALYs, and incremental cost–effectiveness ratios (ICERs). All costs and health outcomes were discounted at a rate of 3% annually. The model was built in TreeAge Pro 2007 (TreeAge Software, Inc., Williamstown, Massachusetts).
Our model’s ischemic stroke rates for warfarin were based on historical rates observed in a national registry of Medicare beneficiaries ( Table 1 ). Stroke rates for those patients receiving rivaroxaban were derived by multiplying the on-warfarin rates by the HR of ischemic stroke on rivaroxaban reported in ROCKET-AF. We classified ischemic stroke into 1 of 4 categories—fatal, major, minor, or reversible ischemic neurologic deficit—and assumed that 28% of all stroke events were transient ischemic attacks. In our model, patients who developed 2 minor strokes were subsequently placed in the major stroke health state, and patients who developed 2 major strokes progressed to the death health state. In addition, we assumed that risk of stroke would increase by 1.4-fold per 10 years of life.
| Variable | Base Case | Range | Reference |
|---|---|---|---|
| Cost in 2011 (US$) | |||
| Warfarin, monthly (tablets only) | 32 | 2–51 | 23 |
| Cost of international normalized ratio monitoring (per test) | 6 | 4–10 | 23 |
| Total cost of warfarin and international normalized ratio monitoring, monthly | 39 | 6–61 | 23 |
| Rivaroxaban, monthly | 205 | 123–300 | 16 |
| Aspirin, monthly | 0.6 | 0.15–6.00 | 23 |
| Event cost of minor stroke | 9,619 | 4,500–18,000 | 17–20 |
| Monthly cost of minor stroke | 2,578 | 1,000–4,500 | 17–20 |
| Event cost of moderate to severe stroke | 14,283 | 11,000–27,500 | 17–20 |
| Monthly cost of moderate to severe stroke | 5,616 | 2,200–9,500 | 17–20 |
| Event cost of reversible ischemic neurologic event | 6,340 | 3,500–13,000 | 17–20 |
| Event cost of intracranial hemorrhage | 40,237 | 16,500–71,000 | 17–20 |
| Monthly cost of intracranial hemorrhage | 5,935 | 2,000–10,500 | 17–20 |
| Monthly cost of stroke and intracranial hemorrhage | 7,525 | 3,500–15,000 | 17–20 |
| Event cost of extracranial hemorrhage | 5,633 | 2,000–9,000 | 17–20 |
| Event cost of clinically relevant nonmajor bleeding | 41 | 0–200 | 23 |
| Event cost of myocardial infarction | 19,669 | 16,500–24,000 | 21,22 |
| Monthly cost of myocardial infarction | 318 | 150–650 | 21,22 |
| Event cost of nonevent death | 6,000 | 3,500–7,500 | 23 |
| Annual discount rate (%) | 3 | 0–5 | 23 |
| Utility | |||
| Healthy on warfarin | 0.987 | 0.940–1 | 10,13 |
| Healthy on rivaroxaban | 0.994 | 0.975–1 | 13 |
| Healthy on aspirin | 0.998 | 0.994–1 | 10,13 |
| Major neurologic event | 0.39 | 0–1 | 10 |
| Minor neurologic event | 0.76 | 0–1 | 10 |
| Disutility of major bleed (2 weeks) | −0.16 | −0.3 to 0 | 11,13,23 |
| Disutility of minor bleed (2 days) | −0.16 | −0.3 to 0 | 11,13,23 |
| Myocardial infarction | 0.84 | 0.50–1 | 12 |
| Probabilities | |||
| Baseline rate of stroke on warfarin (%/year) (CHADS 2 score) | 1.89 (3) | 0.61–5.82 (0–6) | 2,3 |
| Hazard ratio of stroke on rivaroxaban | 0.94 | 0.75–1.17 | 1 |
| Proportions of ischemic strokes with warfarin or rivaroxaban (%) | |||
| Fatal | 8.2 | 8.2–10.1 | 13 |
| Major | 40.2 | 40.2–41.7 | 13 |
| Minor | 42.5 | 34.8–42.5 | 13 |
| No residual deficit | 9.1 | 9.1–13.3 | 13 |
| Relative risk of stroke per 10 years of life | 1.4 | N/A | 3 |
| Relative risk of stroke for aspirin | 2.08 | 1.59–2.70 | 13,23 |
| Proportions of ischemic strokes with aspirin (%) | |||
| Fatal | 17.9 | 10.1–17.9 | 13 |
| Major | 30 | 30.0–41.1 | 13 |
| Minor | 41 | 34.8–41.0 | 13 |
| No residual deficit | 11 | 11.0–13.3 | 13 |
| Baseline rate of intracranial hemorrhage on warfarin (%/yea)r | 0.7 | 0.59–0.90 | 1 |
| Relative risk of intracranial hemorrhage per 10 years of life | 1.97 | N/A | 5 |
| Hazard ratio of intracranial hemorrhage on rivaroxaban | 0.67 | 0.47–0.93 | 1 |
| Relative risk of intracranial hemorrhage on aspirin | 0.51 | 0.16–1.60 | 14 |
| Proportions of intracranial hemorrhage with warfarin, rivaroxaban, and aspirin (%) | |||
| Fatal | 36.4 | 28.3–45.2 | 4 |
| Major | 14.1 | 9.0–21.4 | 4 |
| Minor | 49.5 | N/A | 4 |
| Baseline rate of extracranial hemorrhage on warfarin (%/year) | 2.7 | 2.35–2.93 | 1 (estimation) |
| Hazard ratio of extracranial hemorrhage on rivaroxaban | 1.04 | 0.90–1.20 | 1 (estimation) |
| Relative risk of extracranial hemorrhage on aspirin | 1.14 | 0.47–2.73 | 14 |
| Proportion of extracranial hemorrhage that are fatal (%) | 1.47 | 1–4 | 1 |
| Baseline rate of clinically relevant nonmajor bleeding on warfarin (%/year) | 11.4 | 10.0–12.0 | 1 |
| Hazard ratio clinically relevant nonmajor bleeding on rivaroxaban | 1.04 | 0.96–1.13 | 1 |
| Relative risk of clinically relevant nonmajor bleeding on aspirin | 0.63 | 0.32–1.22 | 14 |
| Baseline rate of myocardial infarction on warfarin (%/year) | 1.12 | 0.93–1.31 | 1 |
| Relative risk of myocardial infarction per 10 years of life | 1.3 | N/A | 7,23 |
| Hazard ratio of myocardial infarction on rivaroxaban | 0.81 | 0.63–1.06 | 1 |
| Relative risk of myocardial infarction on aspirin | 1.42 | 0.84–2.39 | 14 |
| Proportion of myocardial infarction that are fatal (%) | 16.6 | 15.8–17.4 | 6 |
| Relative risk of nonevent death with nonvalvular atrial fibrillation | 1.3 | 1.12–1.62 | 8 |
| Relative risk of nonevent death with nonvalvular atrial fibrillation and stroke | 2.3 | 1.3–3.0 | 9 |
Major hemorrhage rates for those receiving warfarin were based on rates observed in ROCKET-AF. Major hemorrhage rates for those receiving rivaroxaban were derived using the warfarin rate multiplied by HRs of major hemorrhage on rivaroxaban observed in ROCKET-AF. ICHs could be classified as fatal, major, or minor and followed distributions reported by Hylek and Singer. Annual rates of ICH were also adjusted by a factor of 1.97 per 10 years of life. We further assumed a major hemorrhage would warrant the discontinuation of rivaroxaban or warfarin and result in the initiation of aspirin only. Clinically relevant minor hemorrhage rates for those receiving warfarin were based on rates reported in patients during ROCKET-AF, with rivaroxaban and aspirin rates derived by multiplying warfarin rates by relative risks for rivaroxaban and aspirin reported in ROCKET-AF and the meta-analysis by Roskell et al, respectively.
Base-case analysis assumed a baseline rate of myocardial infarction as reported in ROCKET-AF. We further assumed a 16.6% myocardial infarction fatality rate and a 1.3-fold increased risk per 10 years of life. Age-adjusted mortality rates for nonevent death were derived from the most recent published United States Census Bureau estimates and multiplied by a factor of 1.3 to reflect mortality rates in patients with AF and by 2.3 for patients with AF who developed a stroke.
QALYs were calculated by multiplying life years by utility scores derived from the medical literature. The utility weights of neurologic events (ischemic stroke or ICH), bleeding, and myocardial infarction were derived from the published literature ( Table 1 ). Because of the inconvenience and time commitment required for international normalized ratio testing on the patient’s part, being healthy on warfarin was assigned a lower utility than being healthy on rivaroxaban. For minor hemorrhage and nonfatal extracranial hemorrhage, it was assumed that all patients entering these health states would have a short-term disutility of only 2 days for minor hemorrhages and only 2 weeks for nonfatal extracranial hemorrhage. The disutility of myocardial infarction was applied only for 30 days.
Our cost–effectiveness analysis examined direct costs only. Cost of warfarin included the cost of the drug plus 14 international normalized ratio tests per year. Monthly cost of rivaroxaban was estimated at its wholesale acquisition cost. Costs of complications and adverse events were based on values from the Agency of Healthcare Research and Quality’s Healthcare Cost and Utilization Project (HCUP) and previously published estimates. One-time costs and monthly costs were incorporated into the model. Cost of a major extracranial hemorrhage was estimated by the diagnosis-related group-related cost of a gastrointestinal bleed (diagnosis-related group 378) because it was the most common extracranial hemorrhage in ROCKET-AF. Minor hemorrhage was valued at the cost of an outpatient visit (Current Procedural Terminology code 99213).
One-way sensitivity analyses were performed on all variables across a priori determined plausible ranges. This also included an analysis to assess the impact of changing the time horizon (from 1 year to 35 years) on the model’s conclusions. Two-way sensitivity analysis was performed by altering HRs for ischemic stroke and ICH for rivaroxaban simultaneously. A 10,000 iteration Monte Carlo simulation was performed. For each variable in Monte Carlo simulation, we assumed a triangle distribution (defined by a likeliest, low, and high value) because the true nature of variance for these variables is not well understood and the triangle distribution (when used appropriately) does not violate the requirements of any variable (i.e., costs cannot be <$0 and probabilities and utilities must be from 0 to 1).
Stay updated, free articles. Join our Telegram channel

Full access? Get Clinical Tree


