Abnormal water metabolism is frequently observed after Fontan surgery. We hypothesized that patients’ adrenal hormones show unique responses immediately after Fontan operation and that such a hormonal profile is related to postoperative hemodynamics and water imbalance. Twenty-eight patients who underwent a Fontan operation (n = 16) or a non-Fontan type operation (n = 12; controls) under cardiopulmonary bypass were studied. Postoperative urine cortisol and aldosterone levels were measured daily to minimize the influence of circadian rhythms and temporal hemodynamic variations. Cortisol excretion was markedly elevated on postoperative day (POD) 0 in controls, consistent with a stress-induced cortisol response. Cortisol excretion was not high on POD 0 in Fontan patients and was markedly lower than that in the controls (444 ± 150 vs 34 ± 6 μg/m 2 /day, p <0.05), indicating an adrenal insufficiency status. Conversely, aldosterone levels were significantly higher in Fontan patients than in controls immediately after surgery and remained so thereafter. The cortisol-to-aldosterone ratio was significantly lower in Fontan patients on POD 0 (p <0.05 vs controls); low cortisol-to-aldosterone ratios were associated with a longer pleural drainage duration and intensive care unit stay. Daily cortisol and aldosterone levels were significantly associated with postoperative hemodynamics; low cortisol levels correlated with low cardiac and urine outputs, whereas high aldosterone levels correlated with low cardiac output and increased blood pressure and central venous pressure. Thus, aldosterone-to-cortisol imbalance occurred specifically after the Fontan operation. This unique hormonal profile significantly affected patients’ postoperative water balance and hemodynamics. Modulation of the adrenal hormone could be useful for reducing postoperative complications after the Fontan operation.
Immediately after the completion of Fontan circulation, patients are inevitably exposed to a marked increase in central venous pressure (CVP) and often exhibit abnormal water metabolism that leads to the development of pleural effusion and/or ascites. Although an increase in CVP per se has been postulated as a predisposing factor to such abnormal water metabolism, previous studies have failed to demonstrate a convincing correlation between the degree of CVP elevation and the development of pleural effusion and/or ascites. Thus, it seems likely that other factors contribute to causing the abnormal water metabolism after the Fontan operation. Aldosterone and cortisol released from the adrenal cortex are key hormones that regulate fluid homeostasis. In response to stress and hemodynamic disarrangement, these hormones interact to maintain hemodynamic stability by preserving cardiovascular functional integrity through their diverse physiological actions. Imbalance between these hormones, therefore, can have profound effects on fluid balance and cardiovascular hemodynamics. We hypothesized that adrenal hormones (cortisol and aldosterone) show unique responses immediately after the Fontan operation and that such a hormonal profile is significantly associated with the postoperative hemodynamics and abnormal water balance that cause the development of pleural effusion and/or ascites.
Methods
Sixteen consecutive patients who underwent a Fontan operation and 12 consecutive patients who underwent non-Fontan operation under cardiopulmonary bypass (controls) were enrolled in this study. The patients’ underlying cardiac diseases and the types of surgical procedure other than Fontan are listed in Table 1 . Total cavopulmonary connection with fenestration was performed in all the Fontan patients according to our institutional protocol. The anesthetic technique was identical in all the patients, and none of the patients required postoperative mechanical circulatory support or dialysis.
| Fontan Group | n | Control Group: Disease (Procedure) | n | |
|---|---|---|---|---|
| Hypoplastic left heart syndrome | 4 | Ventricular septal defect (closure) | 5 | |
| Single right ventricle | 3 | Atrial septal defect (closure) | 2 | |
| Double outlet from right ventricle | 3 | Sinus venous atrial septal defect (Warden procedure) | 1 | |
| Pulmonary atresia with intact ventricular septum | 3 | Subpulmonary muscular stenosis (right ventricular musclectomy) | 1 | |
| Tricuspid atresia | 2 | Transposition of great arteries (arterial switch procedure) | 1 | |
| Single left ventricle | 1 | Unbalanced atrioventricular septal defect (Damus-Kaye-Stansel procedure + Glenn procedure) | 1 | |
| Pulmonary atresia with ventricular septal defect (central shunt + unifocalization) | 1 | |||
| Total | 16 | 12 |
During the postoperative stay in the intensive care unit (ICU), 24-hour urine collection was performed by continuous urethral catheterization, and the total daily amounts of cortisol and aldosterone in the collected urine were measured by radioimmunoassay using commercially available kits (Shionogi, Japan). The urine collection was discontinued when monitoring urine output by urethral catheterization became clinically unnecessary. Hemodynamic data, including cardiac index (CI), blood pressure (BP), CVP, urine output, and creatinine clearance (Ccr), were obtained from the ICU chart records. CI was calculated using Fick’s method, based on the peripheral arterial and central venous oxygen saturation at steady point of blood drawn from the catheters inserted for the postoperative intensive care. Oxygen consumption was estimated from the normative value based on age and heart rate. Data for CI, BP, and CVP were summarized as mean values at 8 a.m. , 12 noon, and 4 p.m. on each postoperative day (POD). Ccr was calculated based on the total amount of creatinine in the urine collected for each 24 hours and the serum levels of creatinine on the same day. Systemic vascular resistance was also calculated as (mean BP − CVP)/CI. Chest drain tubes were removed when the amount of drainage had been less than about 5 ml/kg/day during the preceding 12 to 24 hours. Whether patients should stay in the ICU was determined based on the respirocirculatory status of the patient independent of the chest tube drainage. Postoperative changes in adrenal hormones, hemodynamics, water balance, and their associations were then investigated in both the Fontan and control patients. The study was approved by the Institutional Review Board of Saitama Medical University (International Medical Center, No. 11-131).
All data are presented as mean ± SD values. Comparisons of data between the Fontan and control groups were performed using the unpaired t test. Differences in data between each POD within the groups were tested using the paired t test. Relation between hormonal excretion and hemodynamic data were assessed using linear regression analysis. A value of p <0.05 was considered as statistically significant. All the statistical analyses were performed using the JMP version 9 software (SAS Institute, Inc, Cary, NC).
Results
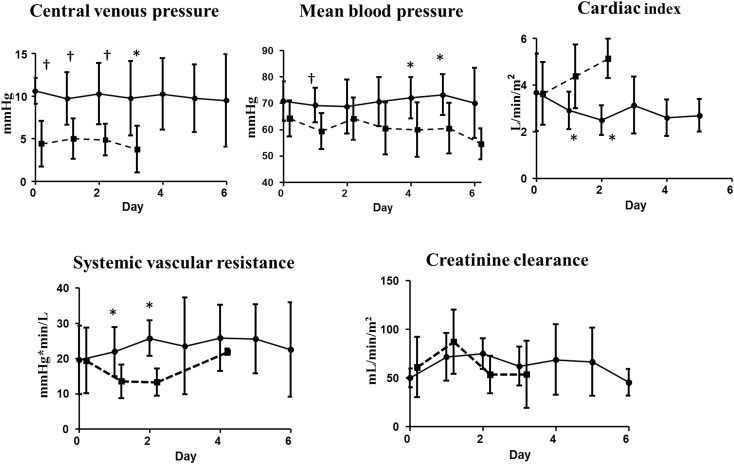
The patients’ characteristics, including demographic, hemodynamic (on ICU arrival), and operative data, as well as the doses of cardiovascular agents administered, are listed in Table 2 . None of the patients had known co-morbidities that may have affected their urinary hormone levels, such as diabetes or hypertension. No significant differences in age, body size, or operative and hemodynamic data were observed between the 2 groups, except for postoperative CVP, which showed significantly higher values in the Fontan patients than in the controls. The doses of the cardiovascular agents administered at the time of ICU arrival were also similar between the 2 groups. Figure 1 shows the serial changes in postoperative hemodynamics for each group. CVP and mean BP were consistently higher in the Fontan patients than in the controls. CI decreased significantly during the first 2 operative days in the Fontan group (3.7 ± 1.3 L/min/m 2 for POD 0, 2.9 ± 0.8 L/min/m 2 for POD 1, and 2.5 ± 0.6 L/min/m 2 for POD 2, both p <0.05 vs baseline), whereas it increased during the same postoperative period in the control group (3.6 ± 1.3 L/min/m 2 for POD 0, 4.4 ± 1.4 L/min/m 2 for POD 1, and 5.1 ± 0.8 L/min/m 2 for POD 2), resulting in significantly lower CI values on PODs 1 and 2 in the Fontan patients than in the controls (both p <0.05 vs baseline). These changes in CI and BP were consistent with higher levels of systemic vascular resistance on PODs 1 and 2 in the Fontan patients than in the controls (21.9 ± 7.0 vs 13.5 ± 4.7 mm Hg × min/L for POD 1 and 25.7 ± 5.0 vs 13.1 ± 3.9 mm Hg × min/L for POD 2, respectively, p <0.05 for both). The 2 groups showed no significant difference in Ccr at any point during the postoperative course.
| Fontan Group (n = 16) | Control Group (n = 12) | p Value | |
|---|---|---|---|
| Age (years) | 2.5 ± 0.63 | 3.3 ± 2.8 | 0.30 |
| Body weight (kg) | 10.8 ± 1.9 | 11.7 ± 6.4 | 0.66 |
| Height (cm) | 89.6 ± 9.3 | 85.5 ± 21.5 | 0.90 |
| Body surface area (m 2 ) | 0.52 ± 0.09 | 0.51 ± 0.21 | 0.85 |
| Preoperative B-type natriuretic peptide (pg/mL) | 27.3 ± 19.1 | 30.6 ± 32.9 | 0.75 |
| Preoperative medication (n) | |||
| Anti-aldosterone drug | 10 | 4 | 0.25 |
| Angiotensin-converting enzyme inhibitor | 2 | 0 | 0.49 |
| Aldosterone receptor blocker | 0 | 0 | 1.0 |
| Hemodynamics upon intensive care unit arrival | |||
| Mean blood pressure (mm Hg) | 70.8 ± 7.5 | 64.2 ± 6.8 | 0.11 |
| Cardiac index (L/min/m 2 ) | 3.1 ± 1.5 | 3.6 ± 1.4 | 0.53 |
| Central venous pressure (mm Hg) | 10.6 ± 1.5 | 4.4 ± 2.7 | <0.001 |
| Operative data | |||
| Extracorporeal circulation time (min) | 137 ± 31 | 112 ± 69 | 0.34 |
| Aortic cross clamp time (min) | 65 ± 46 | 48 ± 33 | 0.34 |
| Cardiovascular agents | |||
| Dobutamine (μg/kg/min) | 3.4 ± 1.7 | 2.3 ± 2.3 | 0.22 |
| Olprinone (μg/kg/min) | 0.25 ± 0.06 | 0.18 ± 0.16 | 0.12 |
| Carperitide (μg/kg/min) | 0.15 ± 0.11 | 0.16 ± 0.08 | 0.67 |
| Furosemide (mg/kg/day) | 6.0 ± 3.2 | 4.5 ± 2.5 | 0.21 |
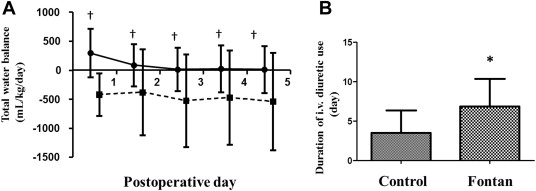
The total cumulative water balance was negative from POD 0 and remained unchanged thereafter in the control patients, whereas significant water retention was observed in Fontan patients until POD 5, especially during the first 72 hours after the operation ( Figure 2 ). In addition, Fontan patients required a significantly longer time before discontinuation of the intravenous administration of furosemide compared with controls ( Figure 2 ; 6.9 ± 3.5 vs 3.5 ± 2.8 days, p = 0.021). Serial changes in the total urinary excretion of cortisol and aldosterone are shown in Figure 3 . Cortisol excretion was highest on POD 0 and gradually decreased thereafter in the control group, consistent with postoperative stress-induced augmented cortisol excretion. Intriguingly, cortisol excretion was markedly lower on POD 0 in the Fontan patients than in the controls (34 ± 6 vs 444 ± 150 μg/m 2 /day, p = 0.021), indicating a status of adrenal insufficiency after the completion of Fontan circulation. The levels gradually increased and reached levels similar to those in the controls on PODs 2 and 3. In sharp contrast to the postoperative cortisol responses was aldosterone excretion, which showed a significantly higher value in the Fontan patients than in the controls immediately after surgery and remained so thereafter (p <0.01 on PODs 0 and 1, and p <0.05 on POD 2). Thus, the cortisol-to-aldosterone ratio was significantly lower in the Fontan patients than in the controls on POD 0 (4.7 ± 5.7 vs 50.3 ± 44.4 μg/m 2 /day, p <0.05) and during the first 3 PODs (mean 3 days; 4.1 ± 4.9 vs 31.6 ± 37.6 μg/m 2 /day, p = 0.003).